Integration of Spatially Aggregated Physical Process Models with

 – Rapid Dispute")

 on water quantity")


 Barton Creek Williamson Creek Interstream recharge Slaughter")


- Slides: 16
Integration of Spatially Aggregated Physical Process Models with Systems Dynamics Models to Assist the Decision Support Process Sandia National Laboratories University of Texas – Austin Geological Society of America 2005 Annual Meeting
Introduction • Motivation • Approach – Integrated Modular Simulation Framework (IMSF) – Rapid Dispute Prevention (RDP) • Example – Barton Springs segment of the Edwards Aquifer, Austin, TX
‘High-Level’ Motivation • Incorporate scientific analysis into the decision making process • Allow stakeholders to guide the scientific process • Employ advanced policy and decision making techniques • Maximize economic, environmental, and demographic sustainability
Barton Springs • Assess impacts of development (e. g. impervious cover) on water quantity and quality issues – Spring flow – Drought triggers – Economic impacts • Groundwater flow models • Stakeholder involvement Areal extent of Austin from 1885 to 1985
‘Core’ Motivation • Need to incorporate spatially detailed modeling capabilities • Need to analyze systems level responses • Need this as one tool that can be implemented by non-modelers
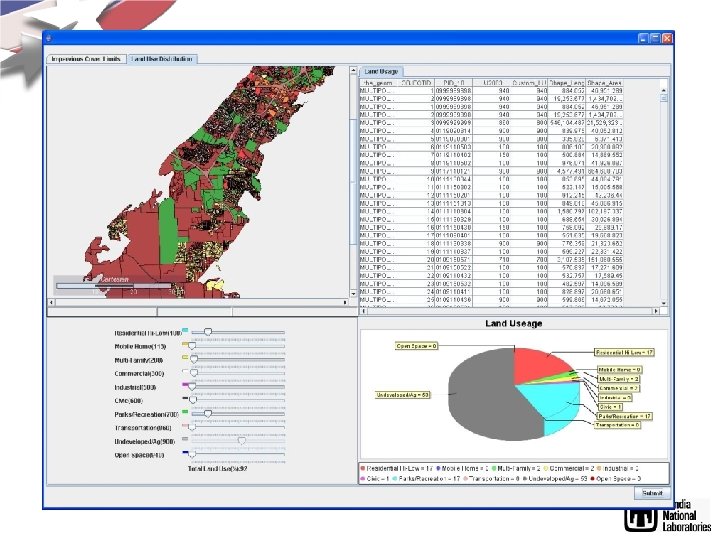
Approach • Link physical process models to system dynamics models – Common GUI – Common data store – Two-way communication – Automatic calibration IMSF
Integrated Modular Simulation Framework Dynamic Data Manager SD Model Impervious Cover GUI Stream Buffers Pipe Leakage Min. Spring Flow Compare Results Add Method Optimization Spatially Indexed Database T A B U Pumping Limits Drought Triggers PP Model
Example: Barton Springs Groundwater Availability Model (GAM) Barton Creek Williamson Creek Interstream recharge Slaughter Creek Bear Creek Onion Creek No recharge • 120 x 120 cells • 1000 m x 500 m cell size • Steady State and Transient Versions • Recharge, well pumping, drains (Barton and Cold Springs)
Change of Resolution Convert PP model to coarse-resolution SD model through zonation 3 Effective parameters are extracted from the MODFLOW model. Powersim model is calibrated using a TABU search. 1 7 2 6 9 8 11 4 10 5
Calibration Zone 8 8 to 7 3 1 4 2 6 7 9 8 10 11 5 8 to 11 MODFLOW Powersim 8 to 10 Powersim MODFLOW Powersim MODFLOW • Flow b/t Zones • Average Heads • Spring Flow 8 to 9 MODFLOW 8 to 6 MODFLOW 8 to 2
Calibration 3 1 2 7 • Flow b/t Zones • Average Heads • Spring Flow 3 4 2 1 7 11 5 10 8 9 4 6 6 9 8 10 11 5
Calibration 4 2 1 7 6 9 8 10 11 5 Powersim MODFLOW Powersim • Flow b/t Zones • Average Heads • Spring Flow 3 Cold Springs MODFLOW Barton Springs
Benefits and Summary • SD model executes much faster than the PP model – Scenario testing – Stakeholder education • Allows for connecting important physical processes to other systems • Provides a single user interface that works with both models • Provides on-the-fly calibration between each model • Modular approach allows for application to different types of problems
Acknowledgements • Sandia National Laboratories – Thomas S. Lowry – Vincent C. Tidwell • University of Texas – Suzanne Pierce – John M. Sharp – Marcel Dulay – David Eaton – Michael Ciarleglio – Aliza Gold – Roy Jenevein – A host of others…. . • William Cain
Thank You