
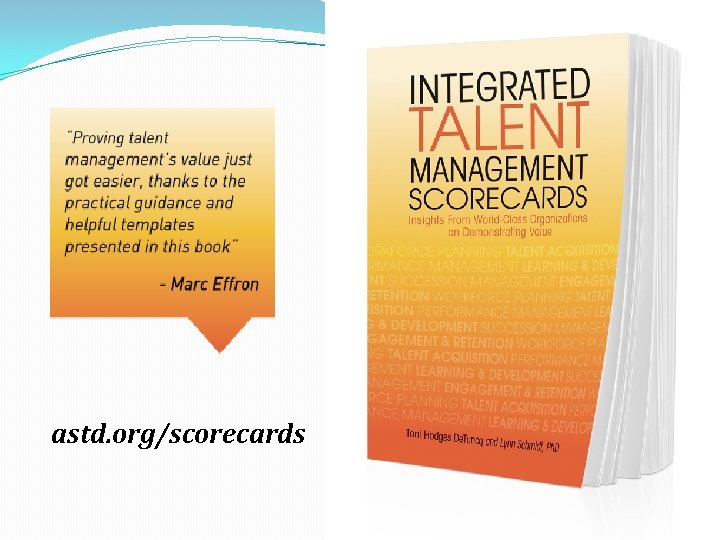
Integrated Talent Management Scorecards Insights from WorldClass Organizations









- Slides: 27
Integrated Talent Management Scorecards: Insights from World-Class Organizations on Demonstrating Value Lynn Schmidt, Ph. D lschmidt 912@hotmail. com ATD Puget Sound October 21, 2014
Session Objectives This session will enable you to: �list the components of integrated talent management (TM) �explain the integrated TM scorecards model �describe a micro level TM scorecard �assess what data is required to populate TM scorecards
About the Presenter Lynn Schmidt, Ph. D ØAuthor of: - “In Action: Implementing Training Scorecards” - “The Leadership Scorecard” - “Integrated Talent Management Scorecards” Ø 20+ years as a talent management leader in large corporations ØSelected as “ROI Practitioner of the Year” ØInternational Coach Federation (ICF) credentialed coach ØRecipient of the “Talent Leadership Award” at the World HRD Congress in Mumbai, India
Talent Management Components
In what areas of TM do you have job experience? �Workforce Planning �Talent Acquisition �Performance Management �Learning & Development �Succession Management �Engagement & Retention
Talent Management Scorecards What’s Your Score? “Score” – a record of points made by competitors in a game or a match “Scorecard” – a card for keeping score of a sports contest
Integrated Talent Management Scorecards Model
Why would you use TM Scorecards to keep score? �? �? �?
Why use TM Scorecards to keep score? �Ensure business alignment �Track performance �Demonstrate accountability �Justify expenses �Make program improvements �Communicate successes
TM Initiative Micro Scorecard �A 1 to 2 page table of a TM initiative’s results �Shows activity metrics: target audience, number of attendees, duration �Lists business objectives for the initiative �Presents findings for levels 1 – 5 evaluations �Provides a quick summary of isolation, conversion, cost components, and barriers �Lists any recommendations made
What levels of evaluation have you conducted? �Level 1 – Satisfaction �Level 2 – Learning �Level 3 – Application �Level 4 – Business Impact �Level 5 - ROI
TM Initiative Micro Scorecard Example - Mentoring Program �Banking industry �Established a mechanism to enroll sales workforce new hires in the “Partnering for Success Program” to increase revenue �Wanted to ensure the new hires used the program �Established a partnership between the mentors and the mentees using critical success factors �Measured the results of a pilot program
Mentoring Program Evaluation �Used a control versus experimental group design �Level 1: Satisfaction surveys sent to both mentors and mentees �Level 2: Not conducted because of protracted duration of the intervention �Level 3: Application surveys sent to both groups – comparing new program results (experimental group) to previous results (control group) �Level 4: Average funded units per seller per month �Level 5: Finance team translated increased sales production of units into a revenue number and compared to cost of program
Mentoring Program TM Initiative Micro Scorecard Initiative Title: Partnering for Success Target Audience & Number: New-Hire Sales Associates 29 pilot and 9 control group participated Duration: 8 months Business Objectives: Increase adoption of mentoring program and increase sales Results Satisfaction Level 1 – Satisfaction Mentors – 80% Mentees – 79% Learning Level 2 – Not collected Application Level 3 – 100% adoption Tangible Benefits Intangible Benefits Level 4 –$211, 000 Associate net revenue Satisfaction Added to value Level 5 – of working at BCR 10: 1 the Bank Technique to Isolate Effects: Control versus Experimental Group Design Technique to Convert Data to Monetary Value: Standard value for unit of sales Fully-loaded Initiative Costs: $21, 000 Barriers to Application: Lack of program control, oversight and structure Recommendations: Deploy nationally
Tips for Implementing TM Initiative Micro Scorecards �Plan for the evaluation before and during the TM initiative design �Keep the process simple �Always account for the influence of other factors �Be conservative when converting and isolating �Involve staff and management in the process of data collection planning and execution �Use the Micro Scorecard to communicate to the organization
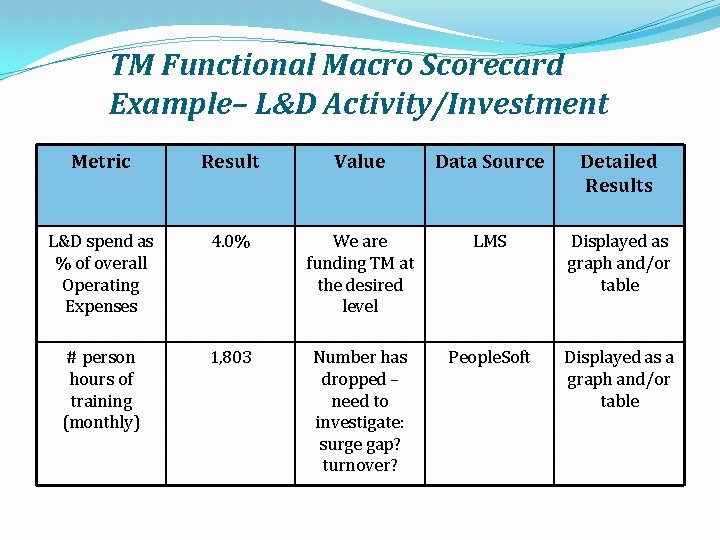
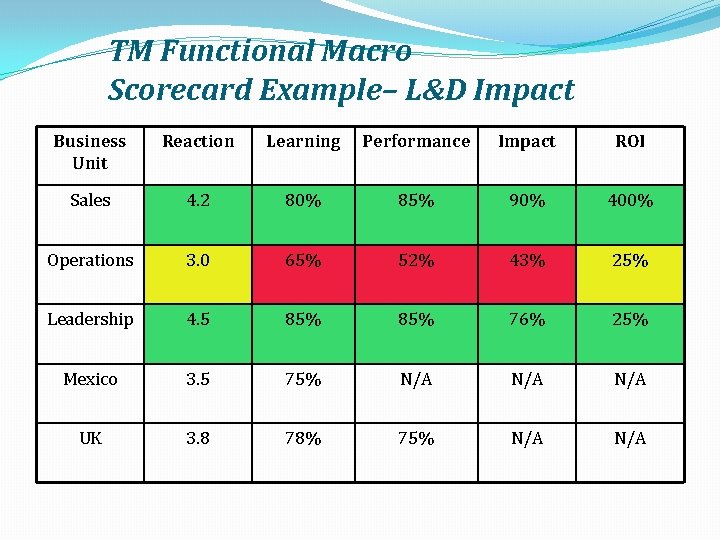
TM Functional Macro Scorecard �Tracks activity & efficiency – how much, how often �Tracks impact results using levels of evaluation 1 - 5 �Provides value statements on results – answers the “so what? ” question �Depicts program results overall and individually �Presents data by business units as well as the organization as a whole �Provides an opportunity for you to determine what is important to track and present – don’t wait for management’s lead
TM Functional Macro Scorecard Example– L&D Activity/Investment Metric Result Value Data Source Detailed Results L&D spend as % of overall Operating Expenses 4. 0% We are funding TM at the desired level LMS Displayed as graph and/or table # person hours of training (monthly) 1, 803 Number has dropped – need to investigate: surge gap? turnover? People. Soft Displayed as a graph and/or table
TM Functional Macro Scorecard Example– L&D Impact Business Unit Reaction Learning Performance Impact ROI Sales 4. 2 80% 85% 90% 400% Operations 3. 0 65% 52% 43% 25% Leadership 4. 5 85% 76% 25% Mexico 3. 5 75% N/A N/A UK 3. 8 78% 75% N/A
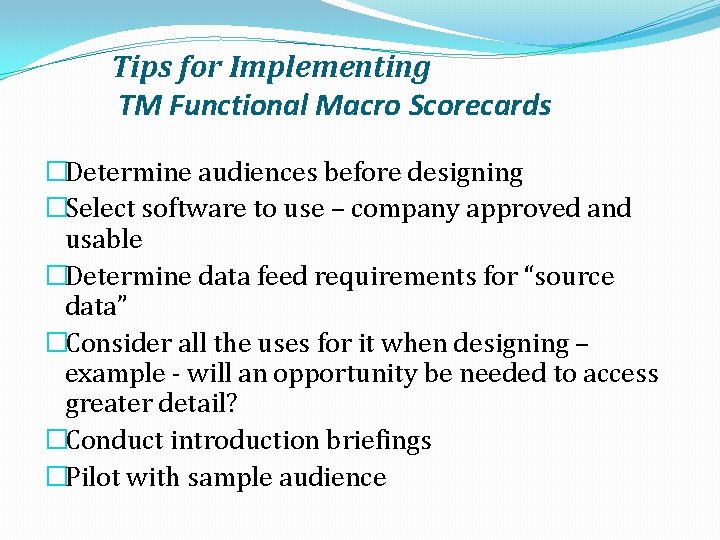
Tips for Implementing TM Functional Macro Scorecards �Determine audiences before designing �Select software to use – company approved and usable �Determine data feed requirements for “source data” �Consider all the uses for it when designing – example - will an opportunity be needed to access greater detail? �Conduct introduction briefings �Pilot with sample audience
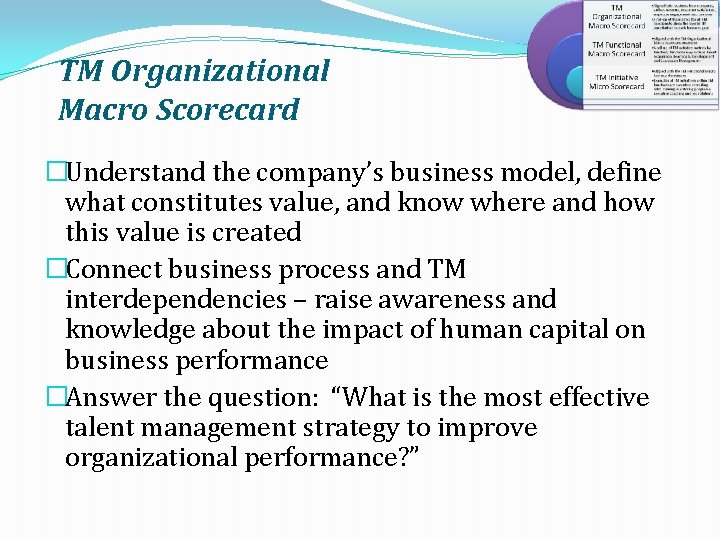
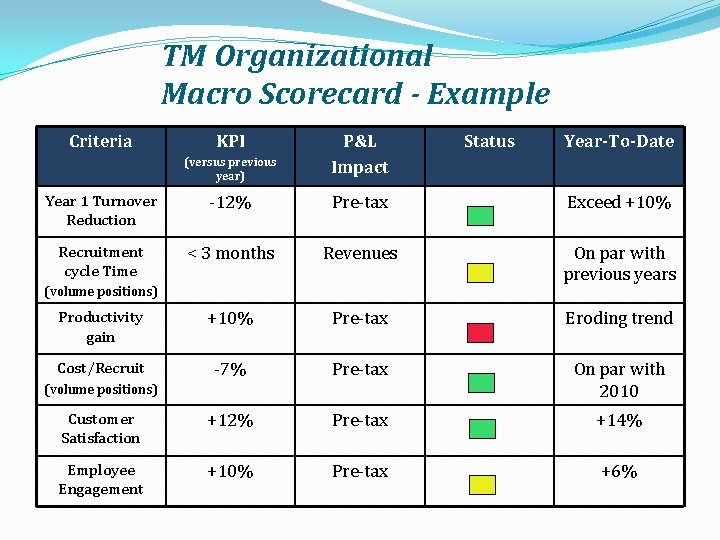
TM Organizational Macro Scorecard �Understand the company’s business model, define what constitutes value, and know where and how this value is created �Connect business process and TM interdependencies – raise awareness and knowledge about the impact of human capital on business performance �Answer the question: “What is the most effective talent management strategy to improve organizational performance? ”
TM Organizational Macro Scorecard - Example Criteria KPI (versus previous year) P&L Impact Year 1 Turnover Reduction -12% Pre-tax Exceed +10% Recruitment cycle Time < 3 months Revenues On par with previous years Productivity gain +10% Pre-tax Eroding trend Cost/Recruit -7% Pre-tax On par with 2010 Customer Satisfaction +12% Pre-tax +14% Employee Engagement +10% Pre-tax +6% (volume positions) Status Year-To-Date
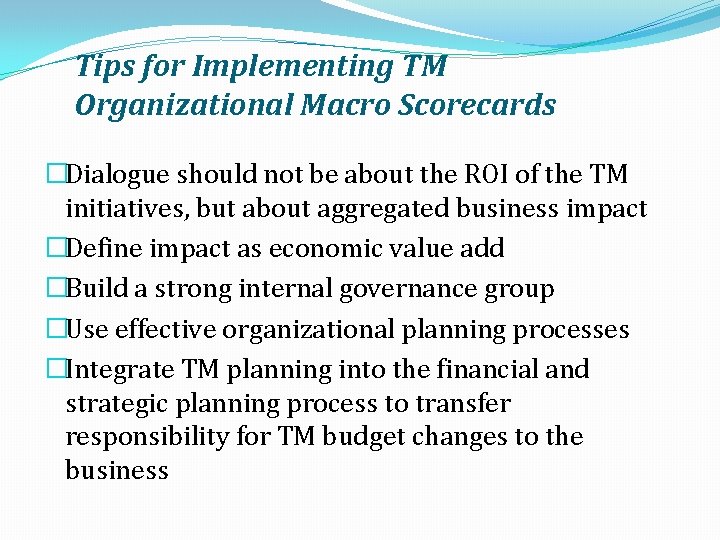
Tips for Implementing TM Organizational Macro Scorecards �Dialogue should not be about the ROI of the TM initiatives, but about aggregated business impact �Define impact as economic value add �Build a strong internal governance group �Use effective organizational planning processes �Integrate TM planning into the financial and strategic planning process to transfer responsibility for TM budget changes to the business
Integrated Talent Management Scorecards Model
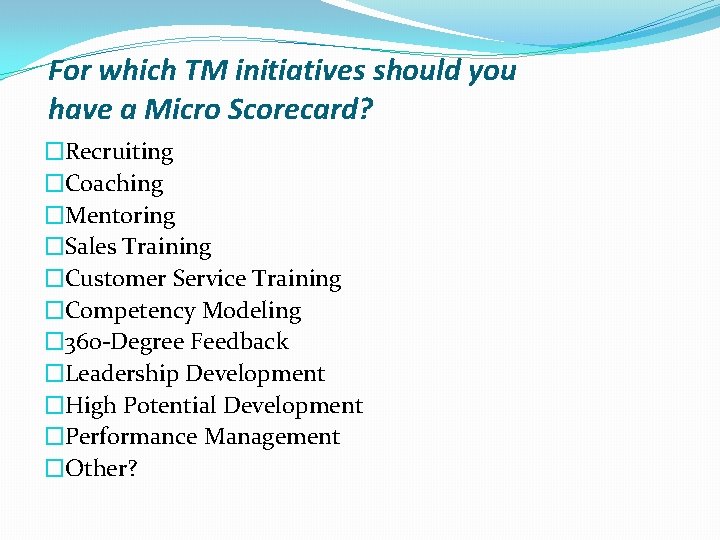
For which TM initiatives should you have a Micro Scorecard? �Recruiting �Coaching �Mentoring �Sales Training �Customer Service Training �Competency Modeling � 360 -Degree Feedback �Leadership Development �High Potential Development �Performance Management �Other?
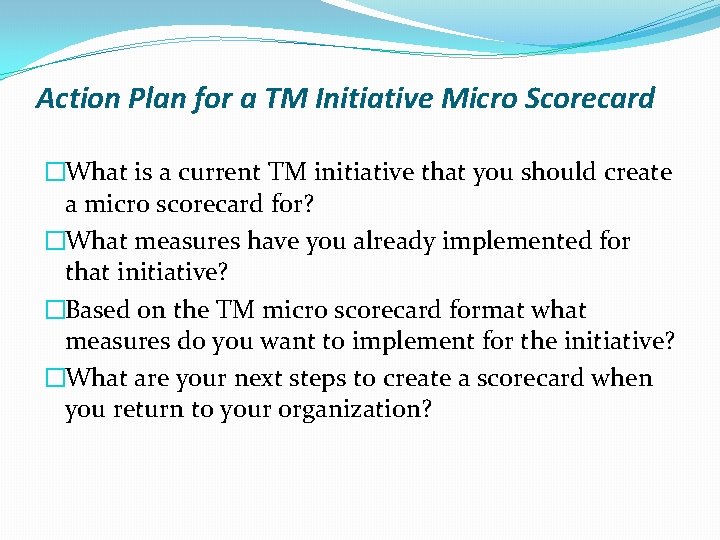
Action Plan for a TM Initiative Micro Scorecard �What is a current TM initiative that you should create a micro scorecard for? �What measures have you already implemented for that initiative? �Based on the TM micro scorecard format what measures do you want to implement for the initiative? �What are your next steps to create a scorecard when you return to your organization?
astd. org/scorecards
Using Integrated TM Scorecards to Demonstrate Value Questions?