Integrated reporting assessment Measuring visuality navigability and technological

Integrated reporting assessment: Measuring visuality, navigability and technological elements Banco de España. Madrid, September 24 & 25 2020 Enrique Bonsón, Universidad de Huelva Michaela Bednárová, Universidad Pablo de Olavide Roman Klimko, University of Economics in Bratislava

Agenda Integrated Report Regulation Challenges and problems Quality aspects Conclusions Methodology Findings

• Concept of IR - In response to the growing information needs of stakeholders, the Integrated Report (IR) has been proposed to enhance overall transparency by merging traditional reporting and corporate social responsibility Integrated Report • The IIRC's Framework identifies two goals for integrated reporting: improved information for outside providers of financial capital and better internal decision making. • a tool to help firms understand their value creation process and to communicate effectively with external stakeholders • Pilot program already in 2010 • Ten years have elapsed since the launch of the International Integrated Reporting Council. Stakeholders increasingly question whether integrated reporting (IR) meets the objectives of decisionusefulness and accountability.

European Regulation • Regarding the current EU regulations on non-financial disclosure, on October 22, 2014, the EU Council adopted a new Directive 2014/95/EU on the disclosure of CSR by large companies and groups, which modifies Directive 2013/34 /EU previously adopted on annual financial statements, consolidated financial statements and related reports of certain types of companies. • In response to the global 2030 Agenda, approved by the United Nations General Assembly in September 2015, the European Commission published its Communication entitled “Next steps for a sustainable European future”. The disclosure requirements presented in this Directive make a significant contribution to the Sustainable Development Goals (EUR-LEX, 2017 Commission Communication 2017 / C 215/01) - Guidelines for the presentation of non-financial reports

Spanish Regulation • As a consequence, Spain approved Royal Decree-Law 18/2017, which was the antecedent of Law 11/2018 of December 28, which modifies the Commercial Code, the revised text of the Capital Companies Law approved by Royal Legislative Decree 1/2010 of July 2 and Law 22/2015 of July 20, of Auditing of Accounts, in the matter of nonfinancial information and diversity. The new Law requires large companies to provide certain non-financial information by referring to international standards or national initiatives (BOE, 2018).

General requirements • description of the business model • environmental issues • social issues (employees, human rights, society, anti-corruption) - Policies, KPIs, risks in these areas • companies are free to choose the international or national reporting standards (GRI, OECD, UN, ISO 26000, SA 8000, etc. ) • Auditors just confirm whether the particular information has been included.

Challenges and problems • Despite the fact that the sustainability reporting in general is getting obligatory (e. g. EU legislation), the format is rather flexible. • Companies are required to be more transparent and add more information, many of them adopted the concept of the Integrated Report (IR) including the GRI standards. • But what about the final user ?

Challenges and problems • EU legislation requiring more information on sustainability issues • Reports are long and getting longer • Users’ perspective: “do not inform me more, but inform me better” – Quality of the report • Tools that improves readability – are the companies applying them to make the report more users’ friendly ?

Quality aspects of the IRs • High level of subjectivity in the measurement of the IRQ • Many studies relied on the EY excellence in IR Awards as a reference of the IRQ (Olalaken, 2019; Barth, 2019; Mans-Kemp and Van de Lugt, 2020). • Other authors (Gerwanski et al. , 2019; Pozzoli and Gesuele, 2016, Pistoni et al. , 2018; Dilling and Caykoylu, 2019; Malola and Maroun, 2019) developed their own scoring systems, however, normally focused on the content of the report. • There is a need to develop a comprehensive model counting with various dimensions of disclosure quality - focusing on the primary goal – effective communication to outside parties • we added the technology layer into the Integrated Reporting Quality Index such as easy navigability and technological elements and aspects such as visuality while not omitting the central point of the IR, business model (content).

Quality aspects of the IR • Visuality • Easy navigability • Business model (a central point of the IR) • Technological elements (quick access)
 often")
Easy navigability • In the era of Big Data, internet users (company`s stakeholders) often do not seek higher quantity of information, rather more organized content. • Nowadays, we can find IRs with more than 200 pages. From a user`s perspective who seeks certain information about a particular aspect of the company or wants to obtain general insights regarding the company`s attitude towards sustainability matters, such a report simply does not add value, hence, his perception of usefulness of such a report would be low. • IR available on the company`s website, allows simplifying and customization of the large quantity of information. This is a crucial aspect for the user`s perception of the usefulness of such a report (Bednárová, 2015). • Fogg (2003) also points out that the simplicity matters when it comes to user`s experience. Understanding, that the IR easily navigable through hyperlinks might simplify users` search for particular information and enhance his experience while interacting with the report.

Visuality • The disclosure literature highlights the importance of the medium with which the information is presented. • Previous research (Cho et al. 2009; Graves et al. 1996) points out that text disclosure alone is no longer adequate to articulate information. • According to Davison (2007), having simple pictures in annual reports affects the perception of richness and potency of the message. • Thus, the accounting scholars point out the importance of visual imagery such as graphics, photos, and pictures, stressing that these are more powerful communication tools that affect the viewer’s perception and potency of a message.

Technological elements • The rapidly changing business environment is forcing companies to adapt quickly and consider the most effective ways of communication and reporting. • The Internet enables companies to reach wider audiences and various groups of stakeholders, moreover, it is cost saving and facilitates timely information disclosure (Koreto, 1997; Jones et al. 1998). • The evolution of Web 2. 0 has brought even more flexibility and facilities for companies seeking the transparency and stakeholder engagement especially due to the massive spread of social media such as Facebook, Twitter, Linked. In, You. Tube, etc. . • Information and transformation function of IR (Serafeim and Eccles, 2014) • Therefore, recent sophisticated technologies enable companies to enhance their corporate presence. Indeed, incorporating different social networking sites or other technological features such as QR codes into the IR, might improve the user`s experience with the report as this is being perceived more efficient and interactive.

Business model • The IIRC points out the seven key elements of the IR, which are organizational overview and external environment; governance; business model; risks and opportunities; strategy and resource allocation; performance; outlook; and basis of presentation (IIRC, 2013). • Nevertheless, the main emphasis is put on the business model which should provide the description of how the company manage to create and sustain value over time. It includes a description of the key inputs, business activities, outputs and outcomes. • Also the EU Communication (2017) in their guidelines for sustainability reporting points out the importance of this concept. • Thus, a comprehensive description of the business model can be considered a central point of the integrated report.

Methodology • IBEX 35 companies – a comparative analysis of the quality of the IR (2016 - 2019) • In 2019 the listed companies in Spain have to follow the new regulation related to the sustainability reporting – did it affect the quality of the reports ? • We developed an index and measured scoring for visuality, navigability, description of the business model, and technological elements to assess user’s experience while using the report.
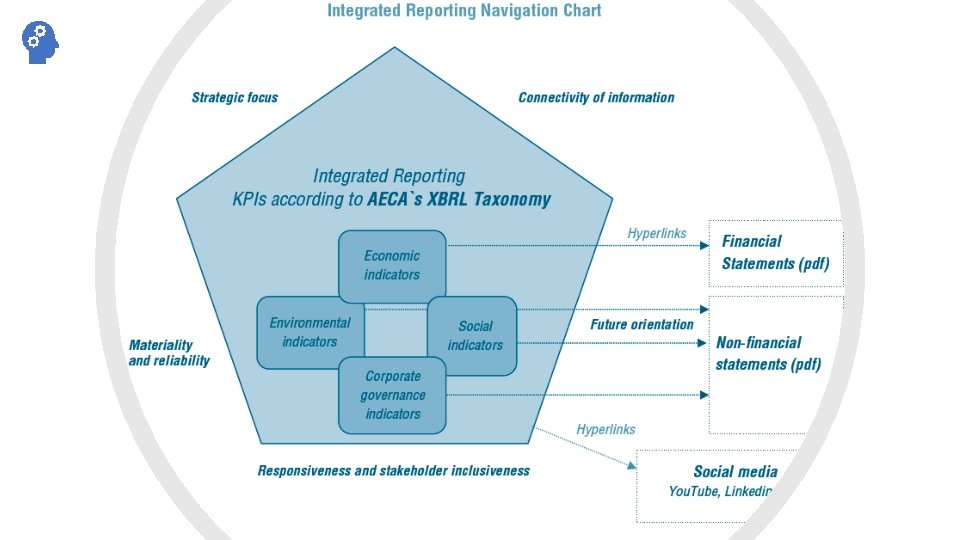
 Evaluation 5 Description Navigation chart 4 Clickable internal")
Index development Criteria Easy navigability (conciseness) Evaluation 5 Description Navigation chart 4 Clickable internal links within a report No internal links, but the report has less than 180 pages 180 -360 pages More than 300 pages, no internal links 3 2 1
,")
Criteria Evaluation Description Visuality 5 High usage of visual elements (charts, photos, etc. ), proportion is approximately 1: 1 or more Moderate usage of visual elements Mostly narrative character 3 1
 5 elements a)")
Criteria Points Description Technological elements (1 point for each element ae) 5 elements a) navigation chart type of the IR 4 elements b) External links 3 elements c) videos 2 elements d) Links to SNs 1 element e) QR codes
 Evaluation 5 Description The IR")
Criteria Business model (as a key element of IR) Evaluation 5 Description The IR includes all the elements below: Features that can enhance the effectiveness and readability of the description of the business model include: • Explicit identification of the key elements of the business model • A simple diagram highlighting key elements, supported by a clear explanation of the relevance of those elements to the organization • Narrative flow that is logical given the particular circumstances of the organization • Identification of critical stakeholder and other (e. g. , raw material) dependencies and important factors affecting the external environment • Connection to information covered by other Content Elements, such as strategy, risks and opportunities, and performance (including KPIs and financial considerations, like cost containment and revenues). 3 The company introduces the key elements of the business model, however, some details mentioned above might be omitted. The information about the business model is rather scarce. 1

Type and number of Integrated Reports Quality Reporting Index 2016 vs. 2019 20 25 15 20 10 5 15 0 AB AC ER ER TIS AR IN CE LO A OX RM EN IT A TA B. . . A CE N LL KI NE B A X BV TE A LE C. SI. . EM DI E EN ND A S G ES A A GR ME. IN IB IF. . DR ER O A DR LS SI O ST LA E M ME MA ER DI S LIN AS E TE PR T CN IC RE OP AS P. R SO VI EUN L SC I. OF. . AN 10 5 0 No IR 2016 IIRC Total score 2016 2019 Evolution of total quality score Average quality aspects scoring 150 12. 0 10. 0 114 100 8. 0 6. 0 50 8 -10 9 20 14 0 4. 0 50 40 0 -8 -9 -15 33 25 27 12 RT AD -50 EU SI AB E -38 -100 -30 -50 -27 -50 2. 0 0 0 IS A T GR CS OU BA P CE NK LL IA NE X BB TE VA LE CO EN M A FE G GA RRO AS S N VI AT AL UR IN AL DI T M MA EX EL P I F RE Á H RE D OT EL E É LS TE CTR LE IC FÓ A NI CA 0 AM Findings Total score 2019 -46 -57 -67 Easy navegability Visuality Technological elements 2016 2019 Business model Total Score
 and Quality Reporting Index Findings")
Statistical analysis Mann-Whitney test • Sector (critical vs. non-critical) and Quality Reporting Index Findings • In 2016, companies operating in critical sector tend to have higher quality reporting index (p-value – 0. 039). • In 2019, there is no significant difference between the two groups.

Findings More companies are using some form of the IR 4 companies maintained it Average number of pages increased from 180 pages (2016) to 250 pages (2019) 11 companies improved the quality of the report 7 new companies, which started with IR in 2019 show medium or low quality (average score was 7 points out of 20) 13 companies worsened the quality of the report Enagas, great improvement, particularly in easy navigability, technological elements and business model description.

Conclusions • Quantity for the sake of quality - Increased number of IRs (those are also getting longer). • Companies try to comply with the new regulation (WHAT? ) by providing more information but rather neglect the user’s experience (HOW? ) in using the report. • One of the principles of the IR – conciseness - is not being applied. • ”putting together” vs. “integrated” – misconception on the side of managers • The final experience of the report user to gain his trust and perception of usefulness should not be forgotten.

Conclusions - regulation • general public support regarding the regulations related to the sustainability • For the companies: more bureaucracy which can be burdensome • costs of regulation are never “absorbed” by businesses, but they always fall on the final consumer (Beales et al. , 2017). • regulation in terms of sustainability disclosure by large corporations can be critically important to improvements in environmental quality (clean air and water), fair trade, social welfare (non-discrimination, etc. ). • BUT poorly designed regulation -> counterproductive : lower quality of such disclosure, greenwashing, or unnecesarily increasing the costs for companies.

Thank you for your attention
- Slides: 26