INTEGRATED MARINE OBSERVING SYSTEM IMOS DATA MANAGEMENT PROCEDURES
 DATA MANAGEMENT PROCEDURES MUN WOO, CHARITHA PATTIARATCHI")
INTEGRATED MARINE OBSERVING SYSTEM (IMOS) DATA MANAGEMENT PROCEDURES MUN WOO, CHARITHA PATTIARATCHI
 Australian National Facility for Ocean Gliders (ANFOG)")
INTEGRATED MARINE OBSERVING SYSTEM (IMOS) Australian National Facility for Ocean Gliders (ANFOG)
 Temperature Depth 4 -channel downwelling irradiance Dissolved Oxygen Optical backscatter")
MEASURED VARIABLES Conductivity (salinity) Temperature Depth 4 -channel downwelling irradiance Dissolved Oxygen Optical backscatter Chlorophyll a fluorescence CDOM (coloured dissolved organic matter) fluorescence
")
AUSTRALIAN NATIONAL FACILITY OF OCEAN GLIDERS (ANFOG)
")
FINDINGS AND ACHIEVEMENTS Climatology: NSW shelf Schaeffer et al. (2016)

DSWC around Australia High tide 7~10 m Strong Wind 10~15 m/s

MEAN VERTICAL STRUCTURE CHLOROPHYLL: WA > 20 million scans

ANFOG DATA PROCESSING WORKFLOW
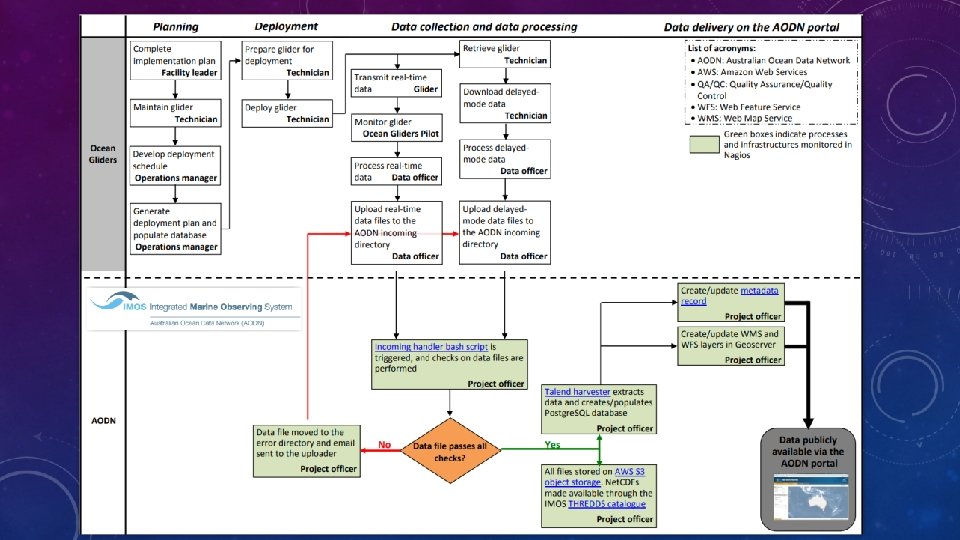

REAL-TIME DATA • data not qualified • plots of measured parameters and engineering variables (anfog. uwa. edu. au) Net. CDF files available on IMOS AODN portal https: //portal. AODN. org. au

DELAYED MODE – AUTO CORRECTIONS • CTD corrected for conductivity and temperature sensor lag & thermal lag Before Blue - before Red - after After

DELAYED MODE – AUTO CORRECTIONS • DOXY corrected for time lag, geometric alignment, salinity compensation. Before After

DELAYED MODE – AUTOMATED TESTS Automated tests: 1. Impossible date test within timeframe of deployment 2. Impossible location test latitude -90 to 90 longitude -180 to 180 4. Impossible depth test Flagged when exceeding: TEMP 6. 0 °C (< 500 db) 2. 0 °C (> 500 db) PSAL 0. 9 PSU (< 500 db) 0. 3 PSU (> 500 db) DOXY 4. 0 kg m-3 FLU 2 1. 1 mg m-3 CDOM 1. 0 ppb VBSC 0. 002 m-1 sr-1 3. Range test gross filter on observed scientific values Flagged when exceeding: 4. Spike test value = | V 2 - (V 3 + V 1)/2 | - | (V 3 - V 1) / 2 | 5. Gradient test value = | V 2 - (V 3 + V 1)/2 | TEMP 9. 0 °C (< 500 db) 3. 0 °C (> 500 db) PSAL 1. 5 PSU (< 500 db) 0. 5 PSU (> 500 db)

DELAYED MODE – AUTOMATED TESTS 7. Surface data Noise due to surface water interactions. Bio-optical parameters flagged as bad (QC flag = 4) above 0. 5 db. 8. Descending IRRAD profiles Radiometer angled at -20 o to horizontal. Only level when glider ascending. Descending IRRAD data flagged as bad (QC flag = 4).

DELAYED MODE - MANUAL QC • Subjective visual inspection of data values by an operator • Time consuming. To avoid delays, not mandatory before real-time distribution

MANUAL QA/QC REQUIRED

END OF MISSION BIOFOULING NOISE

• Check for reasons that may explain ‘anomalous’ points At end of manual QC of physical variables, check consistency of flags for TEMP/CNDC/PSAL/DOX
")
INSERTION OF PROPER METADATA • IMOS follows the net. CDF Climate and Forecast (CF) Metadata Conventions v 1. 6 - datasets contain sufficient metadata that they are self-describing - Units and time parameter are compliant • One Net. CDF-4 file per Oceanglider mission - file names created following IMOS File Naming Convention Document • A great tool to view or edit all metadata is :
 https: //portal. AODN. org. au/")
Australian Ocean Data Network (AODN) https: //portal. AODN. org. au/

GLOBAL GLIDER TRACKS IOOS EGO ANFOG

DISCREPENCIES IN GLOBAL GLIDER DATA FILES TIME: • Uppercase for IMOS and EGO, but lowercase for IOOS. • Although the TIME variable is the same for IMOS and EGO, their units differ. Time is recorded as days since 1/1/1950 for IMOS, but in seconds since 1/1/1970 for IOOS and EGO. DEPTH: • Absent from EGO data. Has to be calculated using pressure and latitude data. • Uppercase for IMOS, lowercase for IOOS. LATITUDE, LONGITUDE: • Uppercase for IMOS and EGO, lowercase for IOOS. TEMPERATURE: • TEMP for IMOS and EGO, temperature for IOOS SALINITY: • SALINITY is saved as PSAL for IMOS and EGO, but as salinity for IOOS. DENSITY: • Density is recorded as DENS for IMOS and density for IOOS. It is not available for EGO and will have to be calculated using CTD data.
 Data Visualisation Software for Ocean")
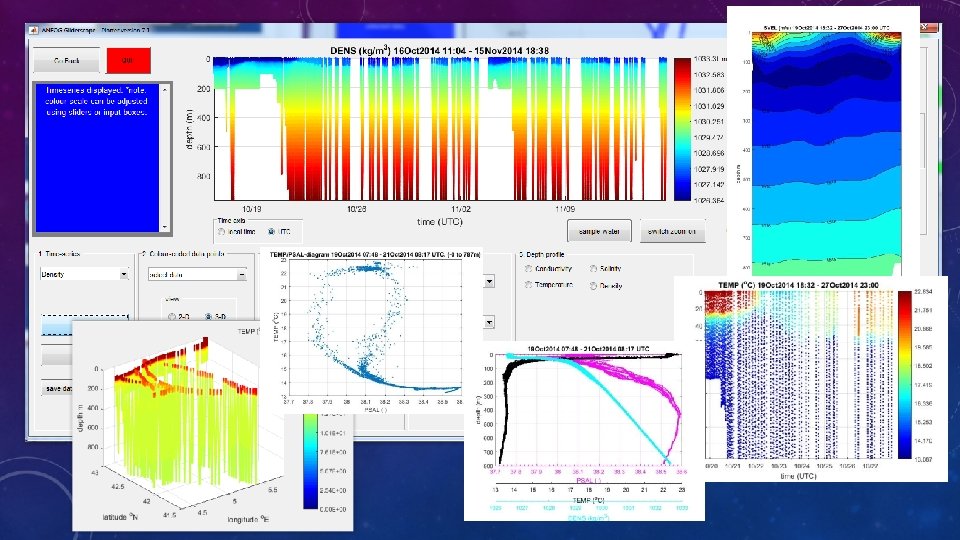
ANFOG SOFTWARE http: //imos. org. au/facilities/oceangliders/glider-data/ (free for download) Data Visualisation Software for Ocean Glider Data GLIDERSCOPE v 7 View/edit any Net. CDF file JUST GOOGLE IT!

GLIDERSCOPE – DATA VISUALISATION TOOL Depth-mean estimate of water velocity Extract a single segment Draw a box to extract data in a region Direction of travel Export data to text file (. txt) or net. CDF (. nc) Isolate data for a time of day, or GLIDERSCOPE's main dashboard with controls for loading and extracting data in a certain depth

GLIDERSCOPE – DATA VISUALISATION TOOL Local time? No problem! Gliderscope calculates it based on location Drop a virtual Niskin bottle Isolate a layer Adjust colour scale by sliding
 Light Attenuation")
Property comparison Contoured crosssection Colour-coded data points Property comparison (eg. TS diagram) Light Attenuation Coefficient (calculated) Depth profiles

GLIDERSCOPE – WORKSHOP PAPER

GLIDERSCOPE - INSTRUCTIONAL VIDEOS

NETCDF NINJA • Easily look up file contents - Scientific data - Global variables & Metadata • Quickly edit contents & save to Net. CDF file • Export data to text file (. txt)

EXAMPLE OF EGO FILE ERROR Problem with time data?

EXAMPLE OF EGO FILE ERROR Correct the value

SUCCESS !!!
 operates ocean gliders all around")
SUMMARY • ANFOG (Australian National Facility for Ocean Gliders) operates ocean gliders all around Australia as part of IMOS (Integrated Marine Observing System) • Raw data available within a few hours • Delayed mode available < 3 months 1 delayed mode net. CDF file per mission, includes metadata, auto and manual QA/QC • AODN Data Portal (Australian Ocean Data Network) checks files and releases to public • Gliderscope - software for extracting and visualizing international glider data Includes Workshop paper & Video Tutorials • Net. CDF Ninja – software for viewing and editing any net. CDF file
- Slides: 34