INSTRUMENTS MULTIMETER AND OSCILLOSCOPE BASIC INSTRUMENTS MULTIMETER capable

INSTRUMENTS: MULTI-METER AND OSCILLOSCOPE

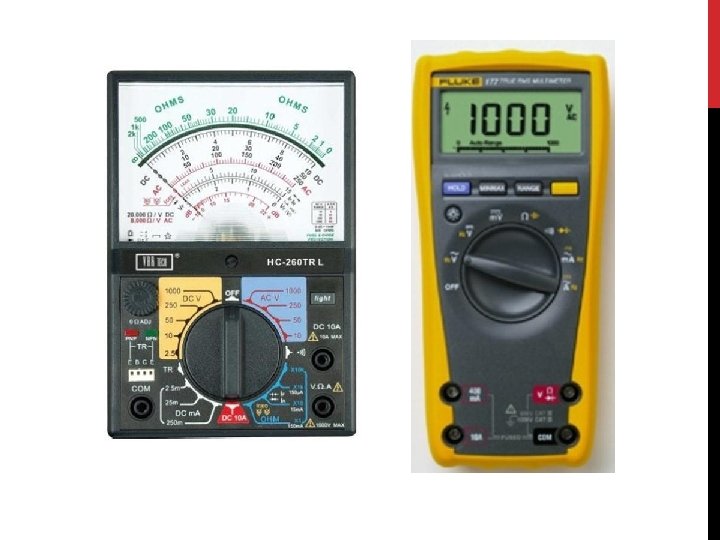
BASIC INSTRUMENTS – MULTI-METER • capable of measuring DC and AC voltages as well as current and resistance • contains the following elements: • Balanced-bridge DC amplifier and indicating meter • Input attenuator or RANGE switch, to limit the magnitude of the input voltage to the desired value • internal battery and additional circuitry, to provide the capability of resistance measurement • Rectifier section, to convert an AC input voltage to a proportional DC value • FUNCTION switch, to select the various measurement functions of the instrument

Balanced-bridge DC amplifier and indicating meter Without input signal, the gate terminals of the FETs are at GND potential and the transistors operate under identical static conditions. Ideally no current should flow through the meter With a positive input signal applied to the gate of input transistor Q 1 its drain current increases causing the voltage at the source terminal to rise. The resulting unbalance between the two transistors Q 1 and Q 2 source voltages is shown by the meter movement, whose scale is calibrated in terms of the magnitude of the applied input voltage.

Input attenuator or RANGE switch 6 M 1. 2 M 600 k 8 M 120 k 60 k 20 k The range of input voltages can easily be extended by an input attenuator or RANGE switch. The unknown DC input voltage is applied through a large resistor in the probe body to a resistive voltage divider. Thus, with the RANGE switch in the 3 -V position as shown, the voltage at the gate of the input FET is developed across 8 M of the total resistance of 11. 3 M and the circuit is so arranged that the meter deflects full scale when 3 V is applied to the tip of the probe. With the RANGE switch in the 12 -V position, the gate voltage is developed across 2 M of the total divider resistance of 11. 3 M and an input voltage of 12 V is required to cause the same full-scale meter deflection.

Resistance Measurement Rx = the unknown resistance When unknown resistor Rx is connected to the multi-meter, the 1. 5 -V battery supplies current through one of the range resistors and the unknown resistor to ground. Voltage drop Vx is then applied to the input of the bridge amplifier and causes a deflection on the meter. Since the voltage drop across Rx is directly proportional to its resistance the meter scale can be calibrated in terms of resistance.

Rectifier using Diodes This combination circuit will produce the peak voltage. Initially during positive cycle, the capacitor is charged until peak value. Then, capacitor discharges through the load resistor. The problem here is the forward voltage drop of the rectifying diodes. If we are measuring large voltages, this voltage loss may be negligible. The lowest AC voltage is normally limited to 10 V. Lower range voltages cannot be achieved because of the diode forward voltage

Rectifier using Op-amps To capacitor and resistor circuitry

BASIC INSTRUMENTS - OSCILLOSCOPES • An oscilloscope is an instrument that allows observation of constantly varying signal voltages, usually as a twodimensional graph of one or more electrical potential differences using the vertical or 'Y' axis, plotted as a function of time, (horizontal or 'x' axis).

1. TYPES OF WAVEFORMS 2. WAVEFORM MEASUREMENTS 3. OSCILLOSCOPE CONTROLS • Vertical controls • Horizontal controls • X-Y Mode 4. OSCILLOSCOPE PROBES • • Passive Probes Active Probes

TYPES OF WAVEFORMS Triangular or Sawtooth Wave Sinewave Pulses Square or Rectangular Wave A sudden change in the amplitude of the signal and back to the previous value

WAVEFORM MEASUREMENTS AMPLITUDE Measured from the maximum peak to the minimum peak of the voltage (peak-to-peak voltage) Can also be useful to measure the RMS voltage PERIOD AND FREQUENCY A period, T : amount of time the signal takes to complete one cycle and it is expressed in seconds A frequency: number of times the signal repeats itself in one unit of time (1/T) unit is Hertz (Hz) PHASE SHIFT When you have two similar waveforms, the oscilloscope can measure the time difference between them. This is measured in degrees or radians.

RISE TIME Time for the signal to go from 10% to 90% of its peak-to-peak voltage. But the percentage can be changed arbitrarily FALL TIME Similarly, the time for the signal to go from 90% to 10% of its peakto-peak voltage.

Determine the pulse amplitude, frequency, rise time and fall time of the waveform in the figure below pulse amplitude = 4 x 2 V = 8 V T = 5. 6 x 5 μs /div = 28 μs Frequency, f = 1/T = 1/28 μs = 35. 7 k. Hz rise time, tr = (0. 5 ) x ( 5 μs /div ) = 2. 5 μs

Find the phase difference between the two sine waves as shown below. From the figure, observe that 1 complete cycle takes 8 divisions = 360 One division = 45 The phase difference = 1. 4 x 45 = 63

OSCILLOSCOPE CONTROLS VERTICAL CONTROLS Position: Controls vertical positioning of oscilloscope display. DC and AC Coupling: DC coupling is the most used position on a scope because it allows the scope to display both AC and DC voltage signals present in the circuit.

When AC coupling is selected, a capacitor is placed into the meter lead circuit, which effectively blocks all DC voltage signals but allows the AC portion of the signal to pass and be displayed

2 V DC offset 0 V DC offset

HORIZONTAL CONTROLS Position: Controls horizontal positioning of oscilloscope display. Controls the time scale and position. 50 Hz 0. 02 s 100 Hz 0. 01 s 0. 02 / 4 = 5 ms / div 0. 01 / 8 = 1. 25 ms / div

X-Y MODE
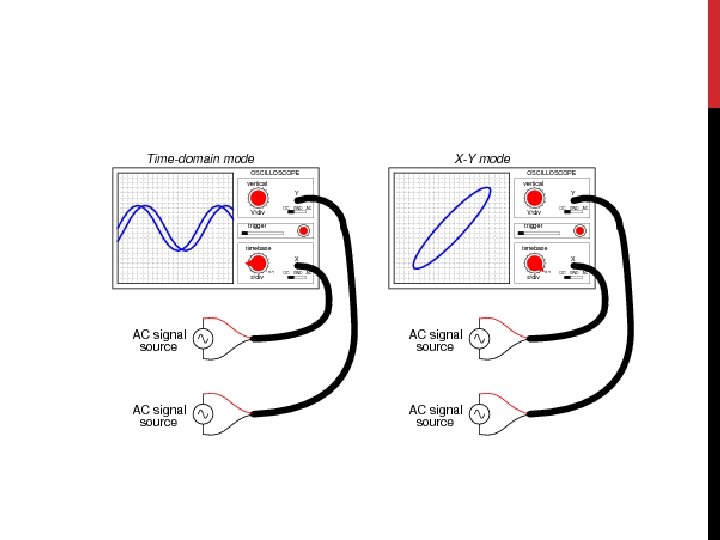

X-Y Mode is generally used to find out what is the phase difference between two waveforms. This measurement technique involves in putting one signal into the vertical system as usual and then another signal into the horizontal system The waveform that results from this arrangement is called a Lissajous pattern Only focus on signals with same ratio frequency

2. At 45 1. At 0 3. At 90 4. At 135 5. At 180

Sin = Y 1 / Y 2 = X 1 / X 2 For example, a circle shape: Y 2 = Y 1 Hence, sin-1 (Y 1 / Y 2 ) = sin -1 (1) = 90 X 2 = X 1

What if the amplitude of one of the signal is higher but the frequency between them stays the same? Y 2 = Y 1 X 2 = X 1 The phase difference is still 90 But the ratio between Y and X equal to ratio of amplitudes between the two waveforms REF: http: //lissajousfigures. tk/

Example 1 The figure shows a Lissajous curve. Calculate the value of the phase difference between the two sine waves.

OSCILLOSCOPE PROBES Test leads are likely to pick up interference or noise, so they are not suitable for low level signals. Furthermore, the leads have a high inductance, so they are not suitable for high frequencies.

So to solve this, we use coaxial cables The coaxial cable consists of an insulated central conductor surrounded by a braided circular conductor which is covered by an outer layer of insulation The central conductor carries the input signal, and the circular conductor is grounded so that it acts as a screen to help prevent unwanted signals being picked up by the oscilloscope input.

Using the coaxial cable, oscilloscope probes may be categorized into two main types, and they can fall into one of two main areas: PASSIVE AND ACTIVE PROBES Passive oscilloscope probes: • This type of probe is the one that is in most widespread use. • It only includes passive elements and may provide 1: 1, i. e. straight through connectivity from the point under test, to the scope input. • Normally use when the input signal impedance is lower than the probe input impedance • Other types may provide a defined degree of attenuation. 1 X scope probe ( 1: 1 attenuation ratio ) • The input impedance of the oscilloscope at the front panel is typically Ri in parallel with Ci. • The coaxial cable connecting the probe to the oscilloscope has a capacitance (Ccc) (typically 90 -100 p. F) which can overload a high-frequency signal source. • Hence, this probe is suitable to be used for signals from 6 MHz to 10 MHz

• The value of Ri and Ci can be found at the front panel. • Value of Ri is normally 1 M and value of Ci ranges from 15 – 30 p. F

At high frequency or high impedance signal, loading effect occurs. Basically what happens is that the output is no longer a correct representation of the input waveform The total impedance offered by the coaxial cable and the oscilloscope input should always be much larger than the signal source impedance. When this is not the case, the signal is attenuated and phase shifted when connected to the oscilloscope. Vin / Vout 0. 707 output is no longer a correct representation of the input waveform 1 f 3 db
 Hence, the 10 X")
10 X scope probe ( 10: 1 attenuation ratio ) Hence, the 10 X scope probe is introduced in order to control the attenuation factor. In order to obtain a properly compensated voltage divider, the time constant between the input network and output network must be the same C 2, capacitance of the coaxial cable 12. 2 p. F 90 p. F Time constant, RC = C 1 x 9 M 1. 1 x 10 -4 = C 1 x 9 M C 1 = 12. 2 p. F 20 p. F Time constant, RC = (20 + 90) p. F x 1 M RC = 1. 1 x 10 -4 = 110 µs

Z 1 = X 110 // 1 M = 72. 3 Z 2 = X 12. 2 // 9 M = 650. 7 Which means that the output will be factorized by a factor of 1/10
 It means that the")
10 X scope probe ( 10: 1 attenuation ratio ) It means that the impedance, Z 2 has to be 9 times larger than Z 1 C 2, capacitance of the coaxial cable 12. 2 p. F 90 p. F 20 p. F XC = 57. 87*9 = 520. 83 Let’s try at frequency 25 MHz

INPUT AT PROBE TIP INPUT AT THE OSCILLOSCOPE

Take note that the scope’s input capacitance, Cin must falls within the probe’s compensation range For example, Agilent’s 8000 Series oscilloscope’s input characteristics show that at 1 M input it exhibits 13 p. F of typical input capacitance. And hence the probe you’re going to use with this scope has 6 -15 p. F of compensation range.

102 p. F 15 p. F - 50 p. F The input capacitance of an oscilloscope can be from 15 p. F to 50 p. F (depending on the instrument). Calculate the range of the adjustable capacitor (hint: use time constant) Answer = 13 p. F to 17 p. F

AN OSCILLOSCOPE PROBE Can switch to 1: 1 or 10: 1 probe settings

Example Xcc = 50 Total impedance = 450 Calculate the capacitance of the adjustable capacitor if the capacitance of the coaxial cable is 106 p. F and given that its reactance is 50 Answer = 11. 8 p. F f = 30 MHz

It is important that every probe be correctly adjusted when it is first connected for use with a particular oscilloscope - CALIBRATION Value of adjustable capacitor is too low Value of adjustable capacitor is too high It is generally accepted that for generalpurpose mid-to-low-frequency (less than around 500 -MHz) measurements, the 10: 1 probe is the most suitable option.

The factor of 10 loss in voltage is not a problem as long as the voltage that is being measured is not so small that dividing it by 10 makes it unreadable by the scope. This means that the scope's sensitivity and the signal voltage may be factors in deciding whether to use a 10: 1 probe.

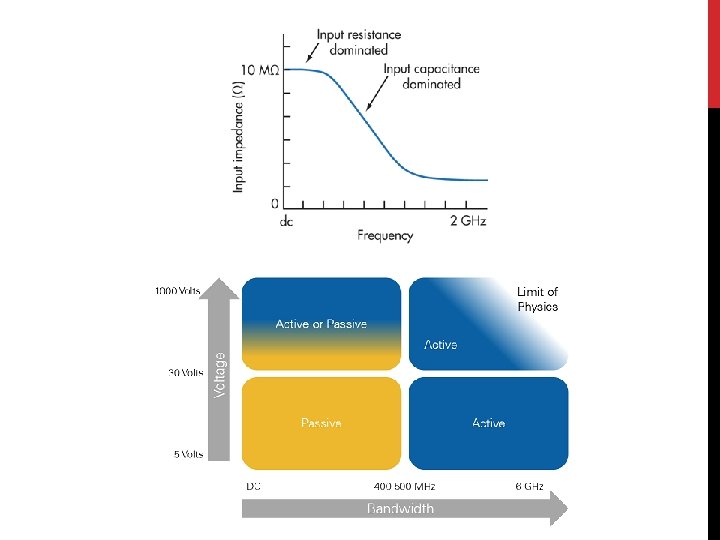
Active oscilloscope probes: • For connecting fast rising and high frequency signal, active probe is used - range of frequency up to 2 GHz • As indicated by the name, this type of scope probe has active components incorporated within the probe itself. • This enables greater levels of functionality and higher levels of performance to be attained. • However they are much more expensive and normally reserved for more exacting or specialist requirements.

Probe tip Block Diagram of an Active Probe FET acts as a source follower. The stage that follows the FET provides bipolar transistors wired as common collector. The FET provides a high-input resistance for low frequency signals and a low capacitance for high frequency signals to the circuit being probed, and the bipolar transistors produce a current gain. Normally active probe is used for i. high input signal impedance – normally around 1 M ii. high frequencies signals iii. low signal level

At low frequency 1 M + + 10 M Vin - High Impedance – no current flow Vout - Circuit under test At high frequency 1 M + + Vin 10 M Low capacitance (2 p. F) - small reactance Vout - - Circuit under test The common collector provides a current source with small output impedance to reduce the loading effect
- Slides: 45