
Instrumental Analysis Elementary Statistics I Significant Figures The

- Slides: 16
Instrumental Analysis Elementary Statistics
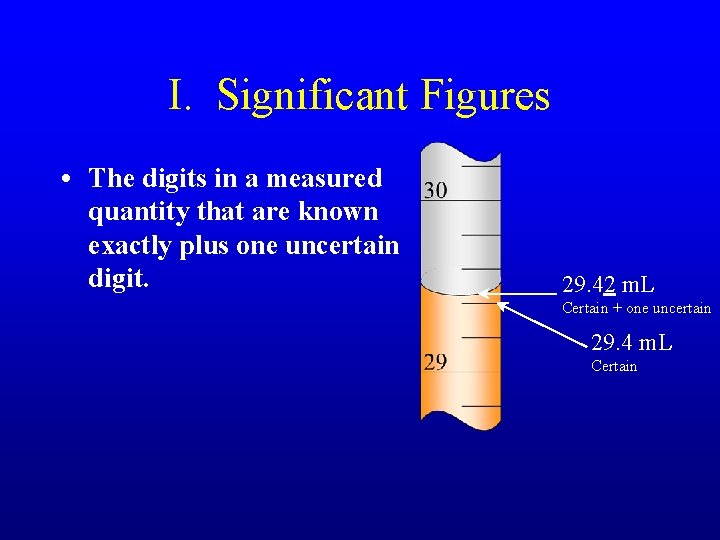
I. Significant Figures • The digits in a measured quantity that are known exactly plus one uncertain digit. 29. 42 m. L Certain + one uncertain 29. 4 m. L Certain
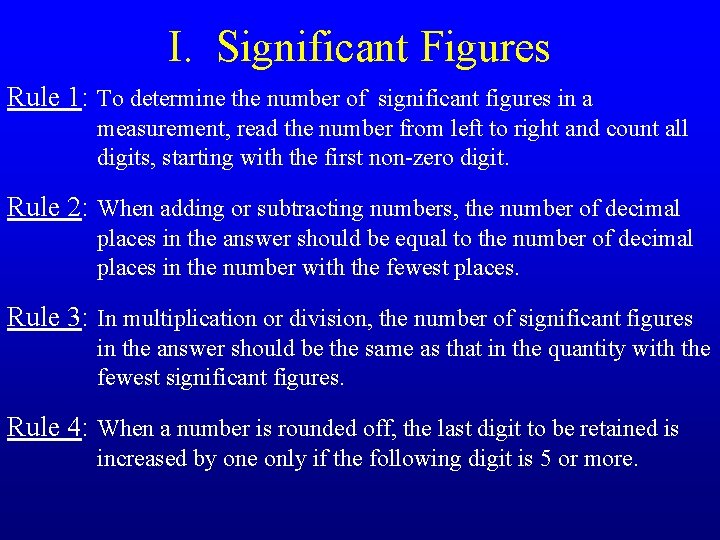
I. Significant Figures Rule 1: To determine the number of significant figures in a measurement, read the number from left to right and count all digits, starting with the first non-zero digit. Rule 2: When adding or subtracting numbers, the number of decimal places in the answer should be equal to the number of decimal places in the number with the fewest places. Rule 3: In multiplication or division, the number of significant figures in the answer should be the same as that in the quantity with the fewest significant figures. Rule 4: When a number is rounded off, the last digit to be retained is increased by one only if the following digit is 5 or more.
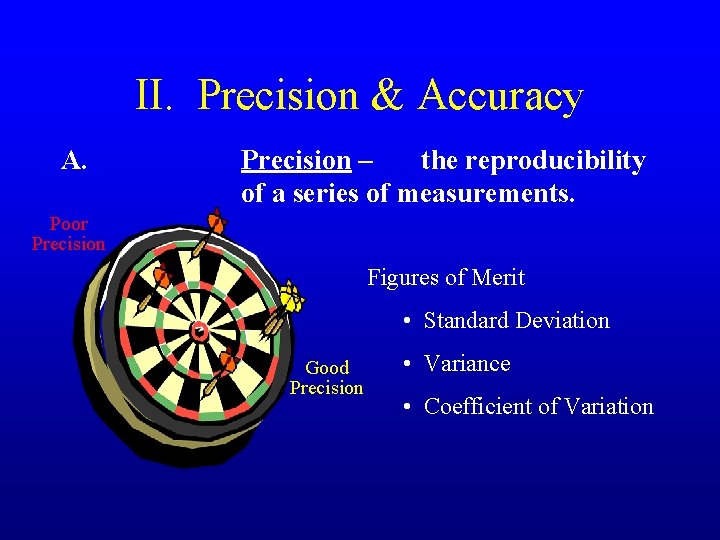
II. Precision & Accuracy A. Precision – the reproducibility of a series of measurements. Poor Precision Figures of Merit • Standard Deviation Good Precision • Variance • Coefficient of Variation
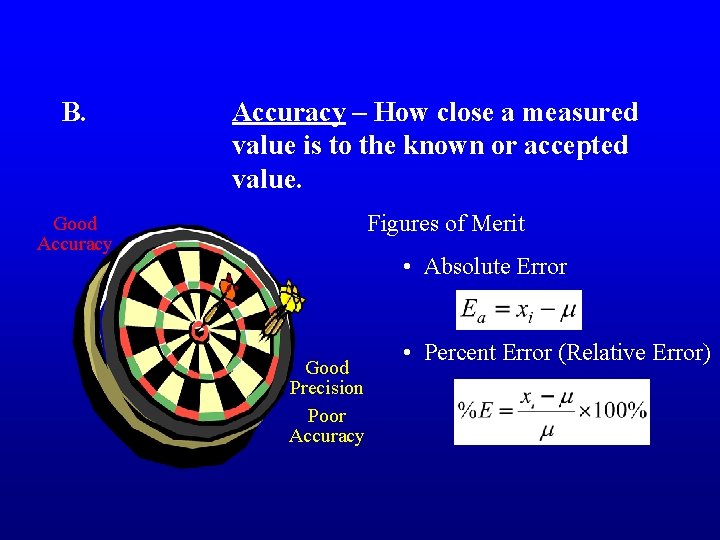
B. Accuracy – How close a measured value is to the known or accepted value. Figures of Merit Good Accuracy • Absolute Error Good Precision Poor Accuracy • Percent Error (Relative Error)
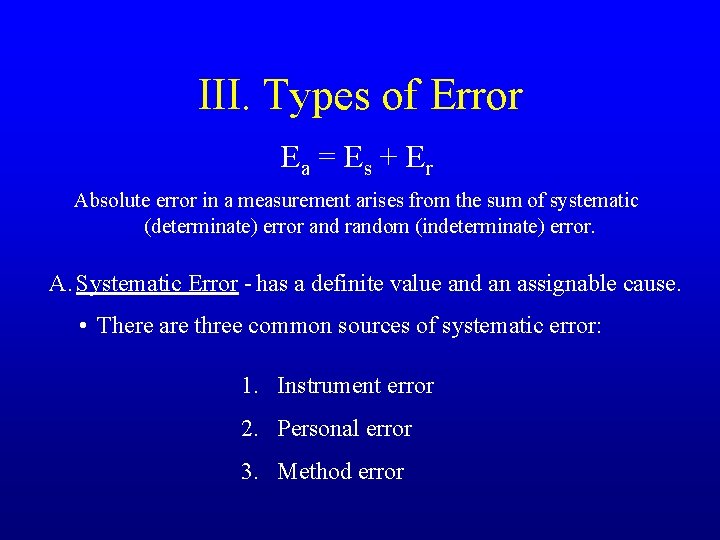
III. Types of Error Ea = E s + Er Absolute error in a measurement arises from the sum of systematic (determinate) error and random (indeterminate) error. A. Systematic Error - has a definite value and an assignable cause. • There are three common sources of systematic error: 1. Instrument error 2. Personal error 3. Method error
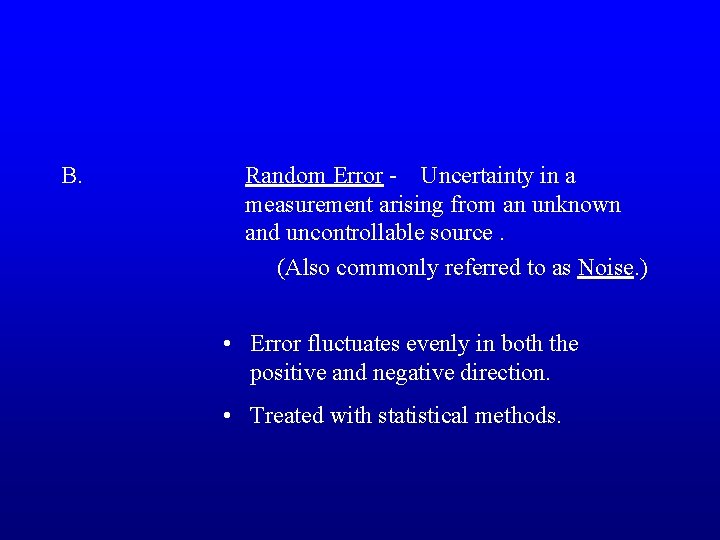
B. Random Error - Uncertainty in a measurement arising from an unknown and uncontrollable source. (Also commonly referred to as Noise. ) • Error fluctuates evenly in both the positive and negative direction. • Treated with statistical methods.
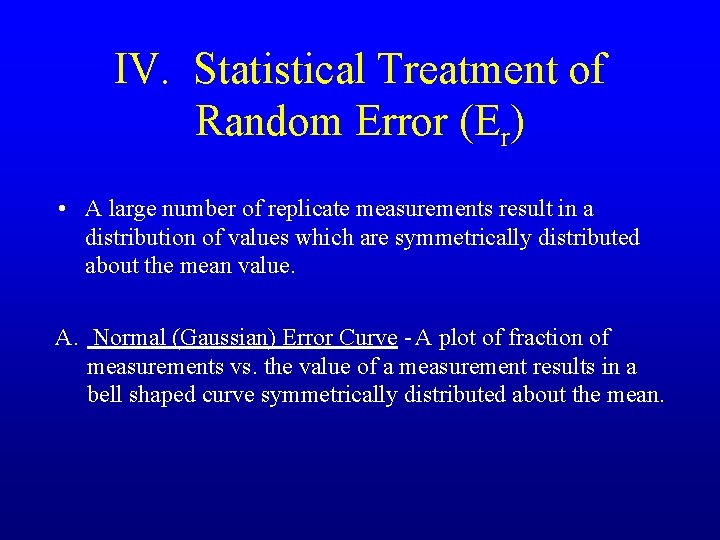
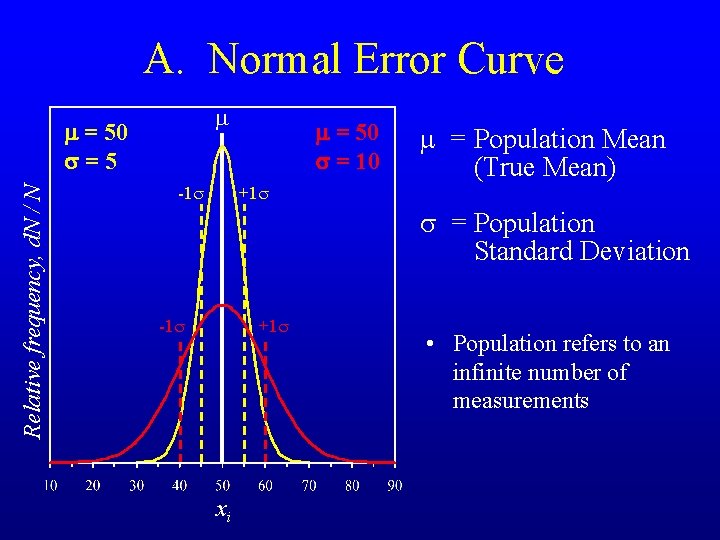
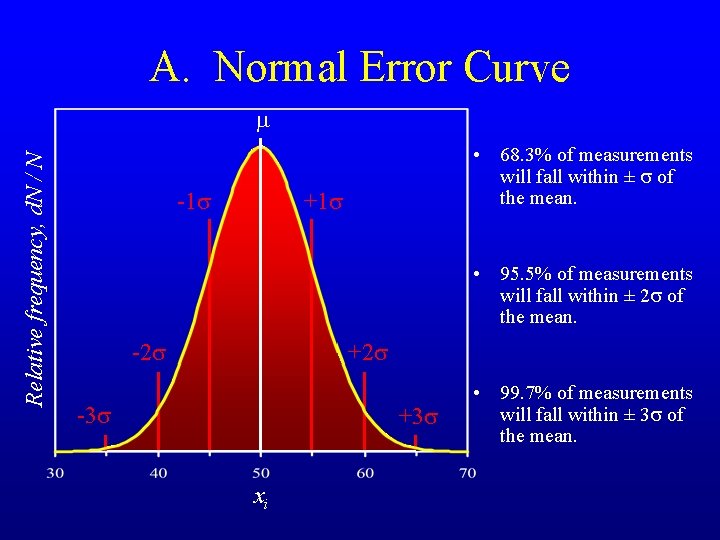
IV. Statistical Treatment of Random Error (Er) • A large number of replicate measurements result in a distribution of values which are symmetrically distributed about the mean value. A. Normal (Gaussian) Error Curve - A plot of fraction of measurements vs. the value of a measurement results in a bell shaped curve symmetrically distributed about the mean.
A. Normal Error Curve m Relative frequency, d. N / N m = 50 s=5 -1 s m = 50 s = 10 m = Population Mean (True Mean) +1 s s = Population Standard Deviation -1 s +1 s xi • Population refers to an infinite number of measurements
A. Normal Error Curve Relative frequency, d. N / N m -1 s • 68. 3% of measurements will fall within ± s of the mean. +1 s • 95. 5% of measurements will fall within ± 2 s of the mean. -2 s +2 s -3 s +3 s xi • 99. 7% of measurements will fall within ± 3 s of the mean.
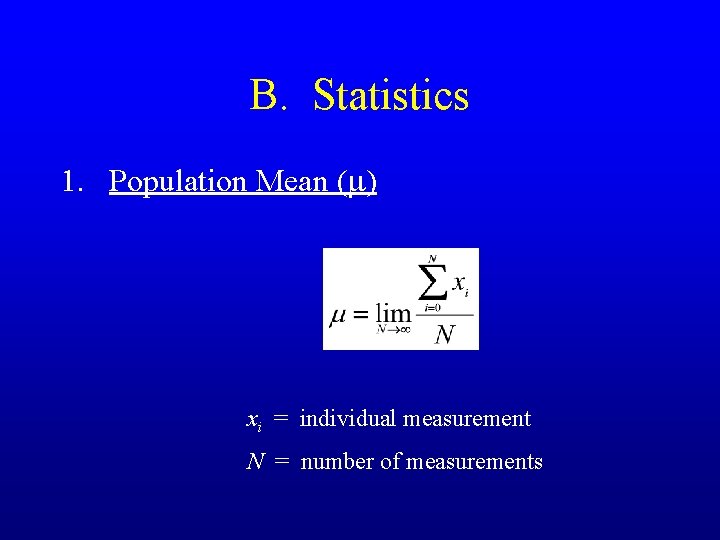
B. Statistics 1. Population Mean (m) xi = individual measurement N = number of measurements
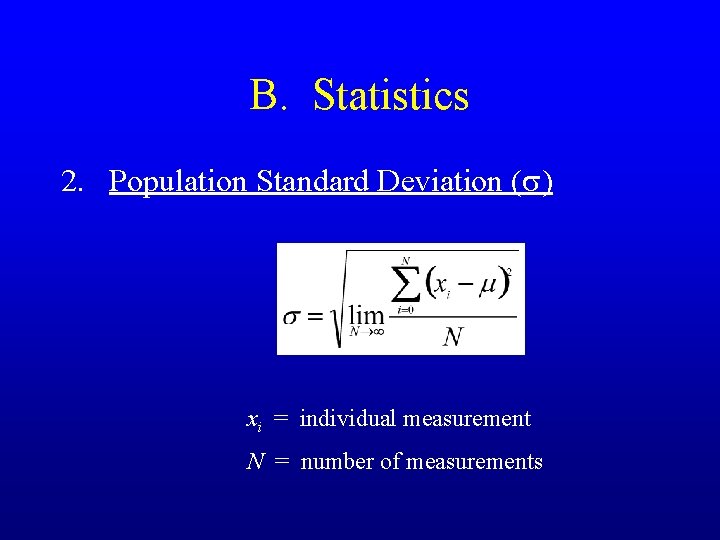
B. Statistics 2. Population Standard Deviation (s) xi = individual measurement N = number of measurements
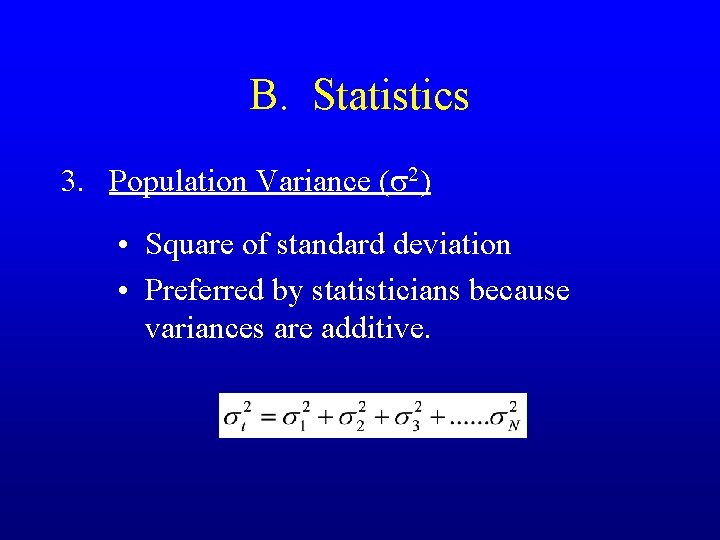
B. Statistics 3. Population Variance (s 2) • Square of standard deviation • Preferred by statisticians because variances are additive.
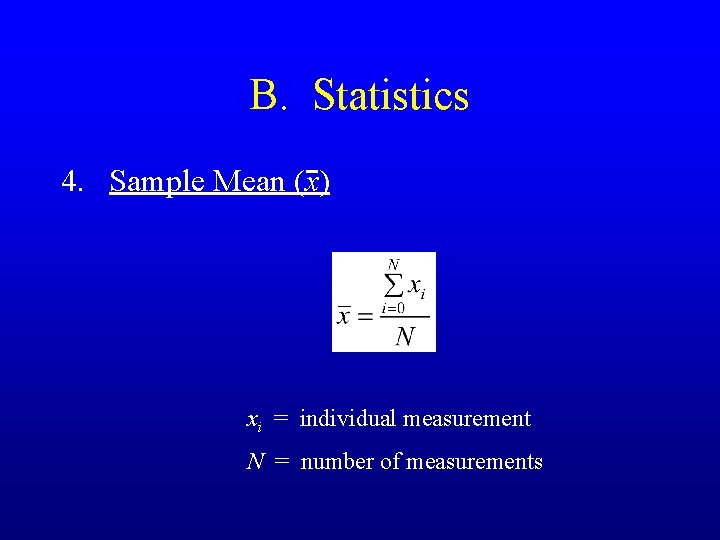
B. Statistics 4. Sample Mean (x) xi = individual measurement N = number of measurements
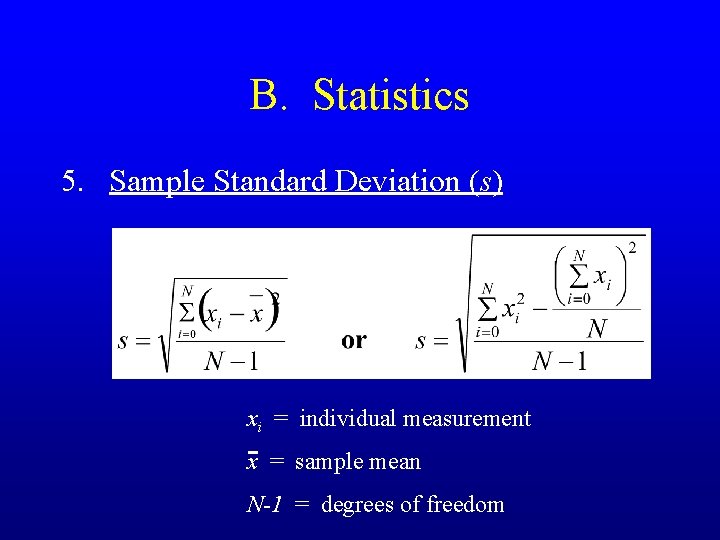
B. Statistics 5. Sample Standard Deviation (s) xi = individual measurement x = sample mean N-1 = degrees of freedom
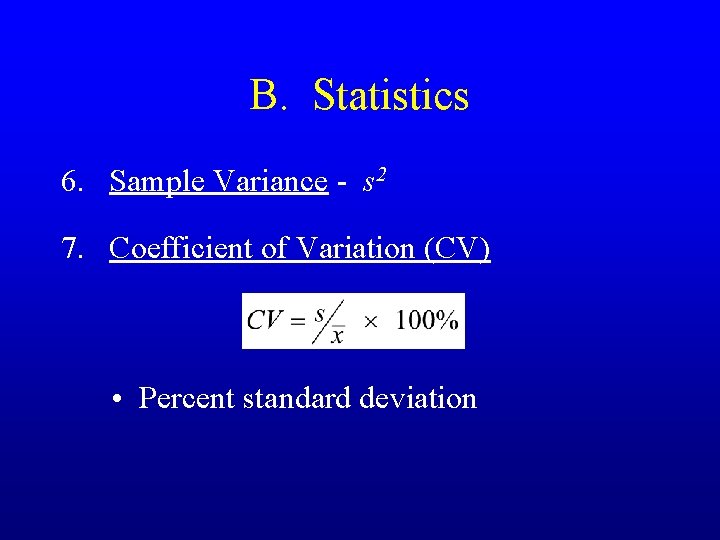
B. Statistics 6. Sample Variance - s 2 7. Coefficient of Variation (CV) • Percent standard deviation