
Instrument Comparison 2017 Bio Molecular Systems Pty Ltd

Instrument Comparison © 2017 Bio Molecular Systems Pty. Ltd. – All rights reserved
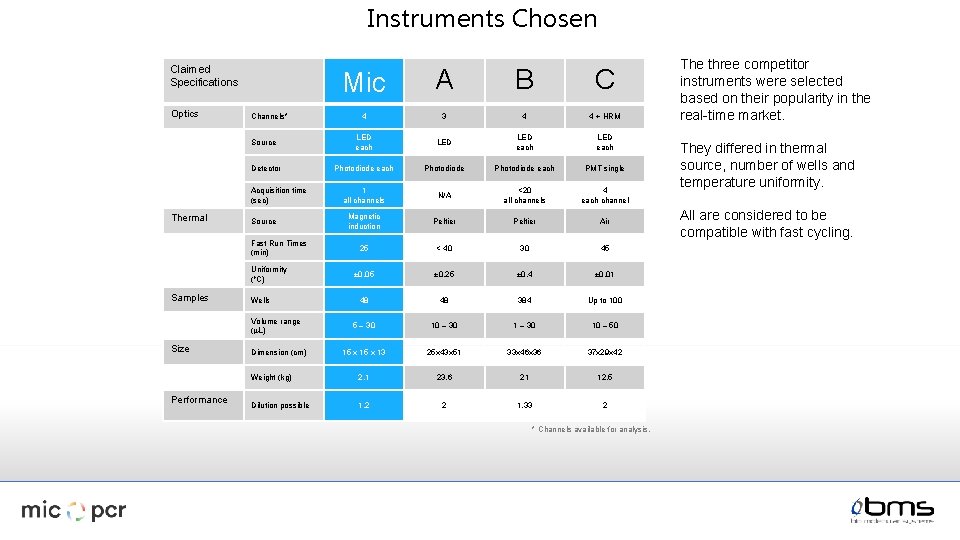
Instruments Chosen Claimed Specifications Optics Mic A B C 4 3 4 4 + HRM LED each Photodiode each PMT single 1 all channels N/A <20 all channels 4 each channel Magnetic induction Peltier Air 25 < 40 30 45 ± 0. 05 ± 0. 25 ± 0. 4 ± 0. 01 48 48 384 Up to 100 5 – 30 10 – 50 15 x 13 25 x 43 x 51 33 x 46 x 36 37 x 29 x 42 Weight (kg) 2. 1 23. 6 21 12. 5 Dilution possible 1. 2 2 1. 33 2 Channels* Source Detector Acquisition time (sec) Thermal Source Fast Run Times (min) Uniformity (o. C) Samples Wells Volume range (m. L) Size Performance Dimension (cm) * Channels available for analysis. The three competitor instruments were selected based on their popularity in the real-time market. They differed in thermal source, number of wells and temperature uniformity. All are considered to be compatible with fast cycling.
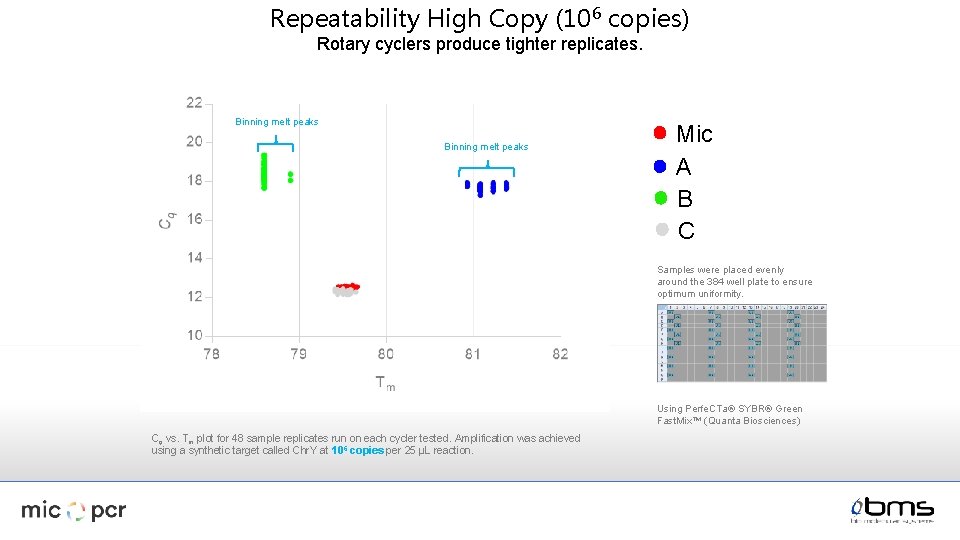
Repeatability High Copy (106 copies) Rotary cyclers produce tighter replicates. Binning melt peaks Mic A B C Samples were placed evenly around the 384 well plate to ensure optimum uniformity. Using Perfe. CTa® SYBR® Green Fast. Mix™ (Quanta Biosciences) Cq vs. Tm plot for 48 sample replicates run on each cycler tested. Amplification was achieved using a synthetic target called Chr. Y at 106 copies per 25 µL reaction.
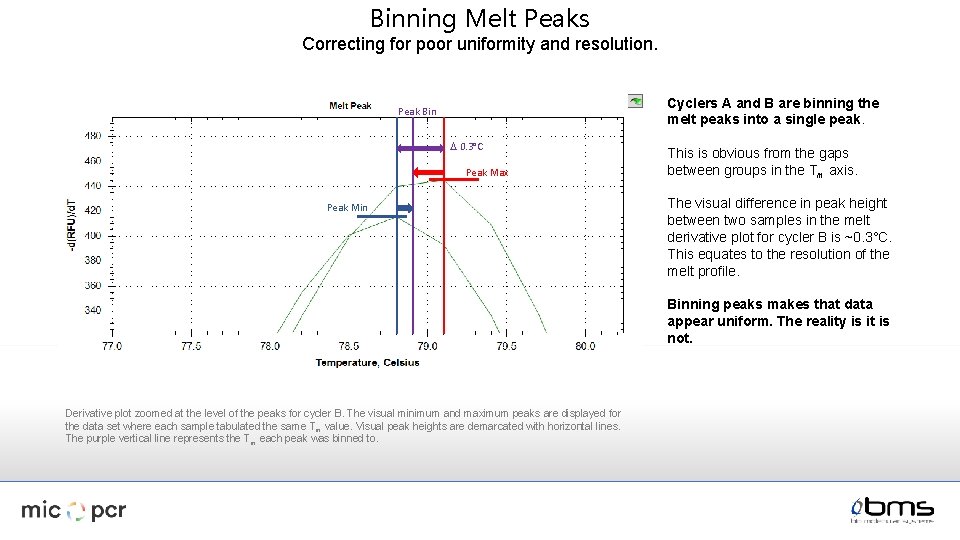
Binning Melt Peaks Correcting for poor uniformity and resolution. Cyclers A and B are binning the melt peaks into a single peak. Peak Bin D 0. 3°C Peak Max Peak Min This is obvious from the gaps between groups in the Tm axis. The visual difference in peak height between two samples in the melt derivative plot for cycler B is ~0. 3°C. This equates to the resolution of the melt profile. Binning peaks makes that data appear uniform. The reality is it is not. Derivative plot zoomed at the level of the peaks for cycler B. The visual minimum and maximum peaks are displayed for the data set where each sample tabulated the same Tm value. Visual peak heights are demarcated with horizontal lines. The purple vertical line represents the T m each peak was binned to.
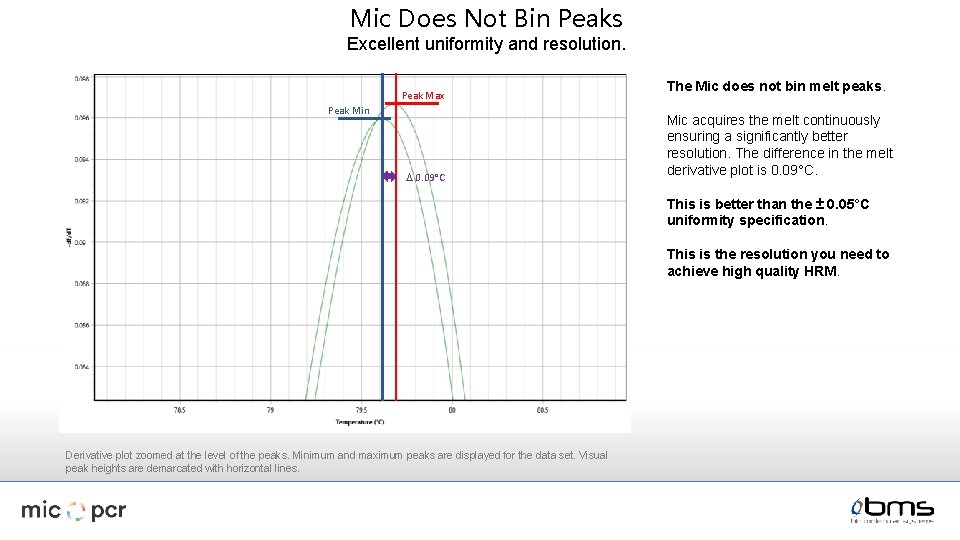
Mic Does Not Bin Peaks Excellent uniformity and resolution. Peak Max Peak Min D 0. 09°C The Mic does not bin melt peaks. Mic acquires the melt continuously ensuring a significantly better resolution. The difference in the melt derivative plot is 0. 09°C. This is better than the ± 0. 05°C uniformity specification. This is the resolution you need to achieve high quality HRM. Derivative plot zoomed at the level of the peaks. Minimum and maximum peaks are displayed for the data set. Visual peak heights are demarcated with horizontal lines.
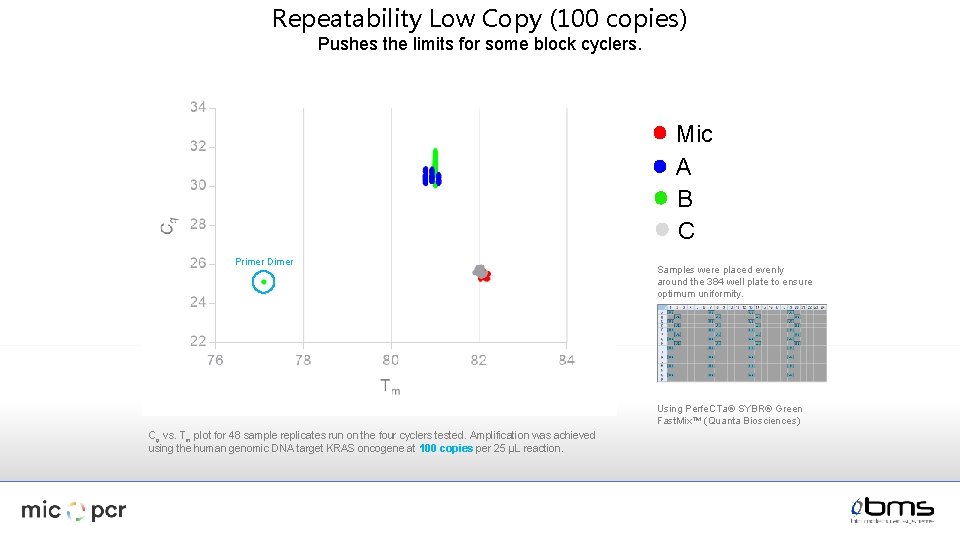
Repeatability Low Copy (100 copies) Pushes the limits for some block cyclers. Mic A B C Primer Dimer Samples were placed evenly around the 384 well plate to ensure optimum uniformity. Using Perfe. CTa® SYBR® Green Fast. Mix™ (Quanta Biosciences) Cq vs. Tm plot for 48 sample replicates run on the four cyclers tested. Amplification was achieved using the human genomic DNA target KRAS oncogene at 100 copies per 25 µL reaction.
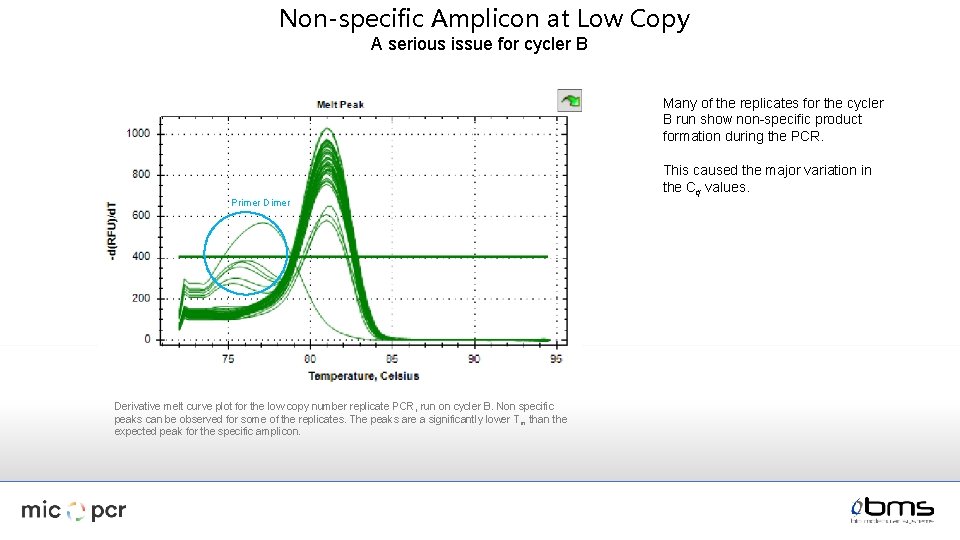
Non-specific Amplicon at Low Copy A serious issue for cycler B Many of the replicates for the cycler B run show non-specific product formation during the PCR. Primer Derivative melt curve plot for the low copy number replicate PCR, run on cycler B. Non specific peaks can be observed for some of the replicates. The peaks are a significantly lower T m than the expected peak for the specific amplicon. This caused the major variation in the Cq values.
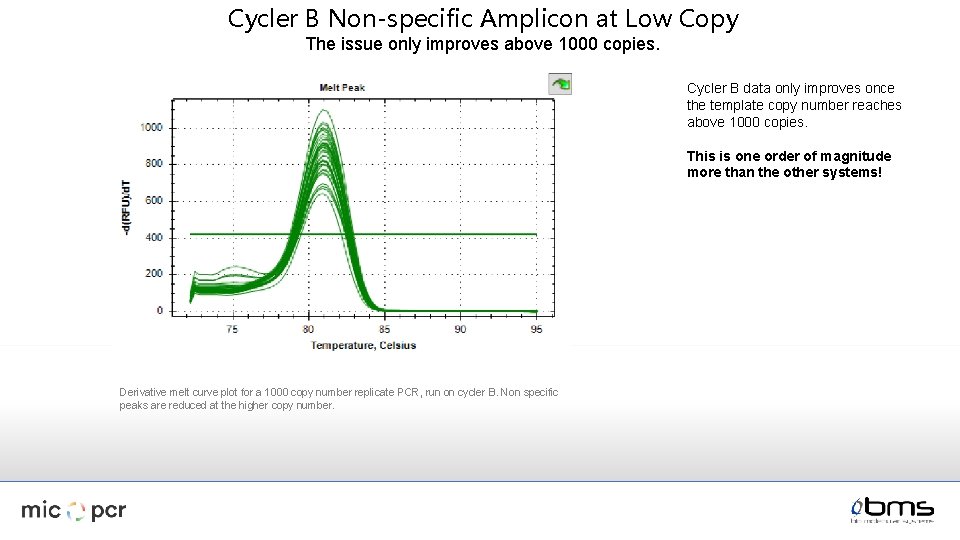
Cycler B Non-specific Amplicon at Low Copy The issue only improves above 1000 copies. Cycler B data only improves once the template copy number reaches above 1000 copies. This is one order of magnitude more than the other systems! Derivative melt curve plot for a 1000 copy number replicate PCR, run on cycler B. Non specific peaks are reduced at the higher copy number.
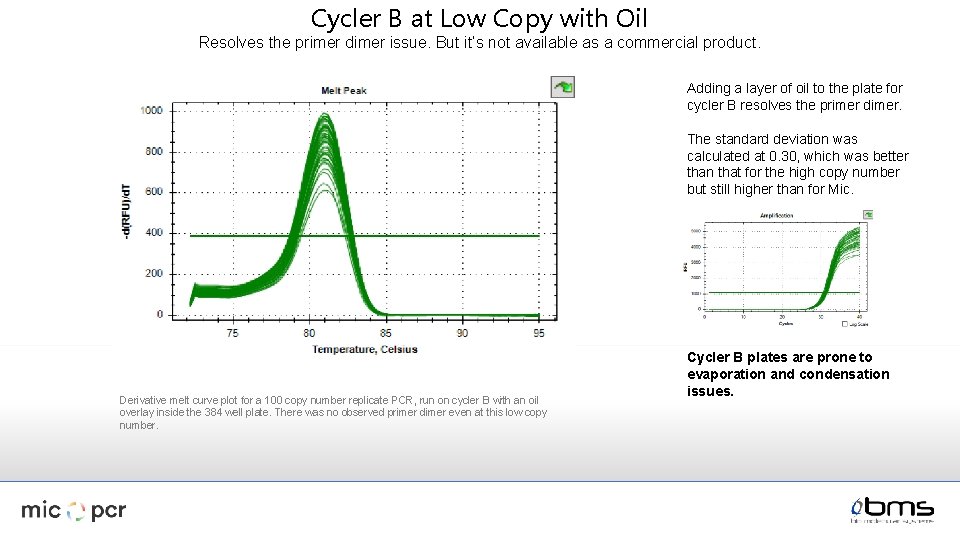
Cycler B at Low Copy with Oil Resolves the primer dimer issue. But it’s not available as a commercial product. Adding a layer of oil to the plate for cycler B resolves the primer dimer. The standard deviation was calculated at 0. 30, which was better than that for the high copy number but still higher than for Mic. Derivative melt curve plot for a 100 copy number replicate PCR, run on cycler B with an oil overlay inside the 384 well plate. There was no observed primer dimer even at this low copy number. Cycler B plates are prone to evaporation and condensation issues.
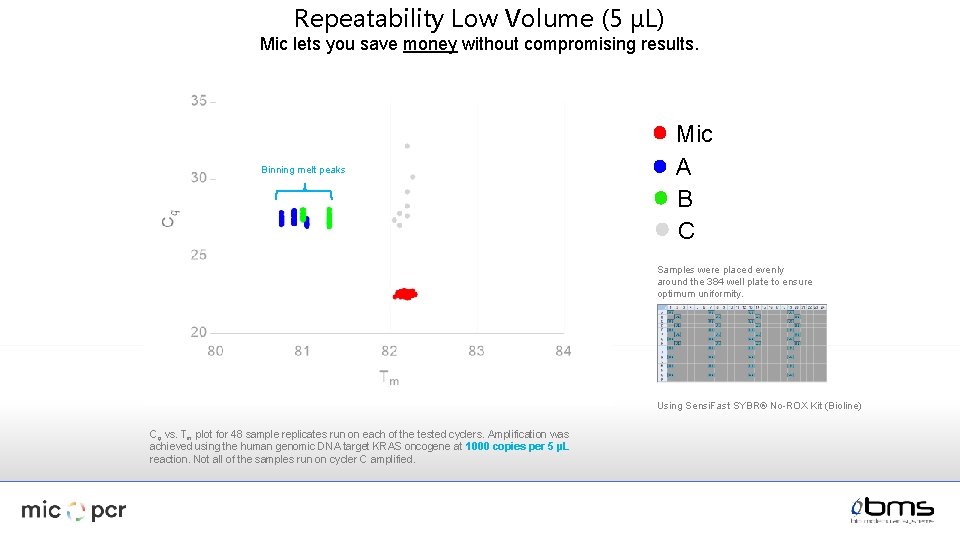
Repeatability Low Volume (5 µL) Mic lets you save money without compromising results. Binning melt peaks Mic A B C Samples were placed evenly around the 384 well plate to ensure optimum uniformity. Using Sensi. Fast SYBR® No-ROX Kit (Bioline) Cq vs. Tm plot for 48 sample replicates run on each of the tested cyclers. Amplification was achieved using the human genomic DNA target KRAS oncogene at 1000 copies per 5 µL reaction. Not all of the samples run on cycler C amplified.
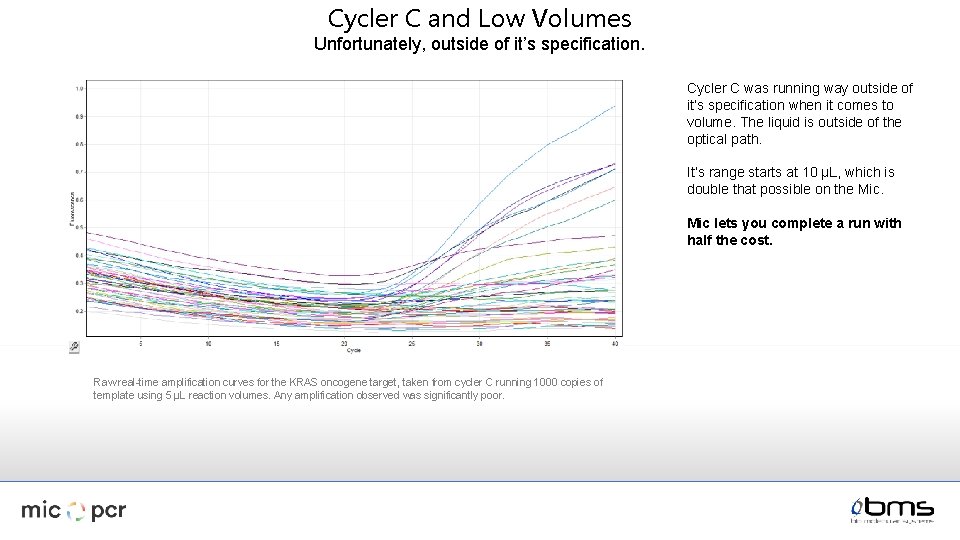
Cycler C and Low Volumes Unfortunately, outside of it’s specification. Cycler C was running way outside of it’s specification when it comes to volume. The liquid is outside of the optical path. It’s range starts at 10 µL, which is double that possible on the Mic lets you complete a run with half the cost. Raw real-time amplification curves for the KRAS oncogene target, taken from cycler C running 1000 copies of template using 5 µL reaction volumes. Any amplification observed was significantly poor.
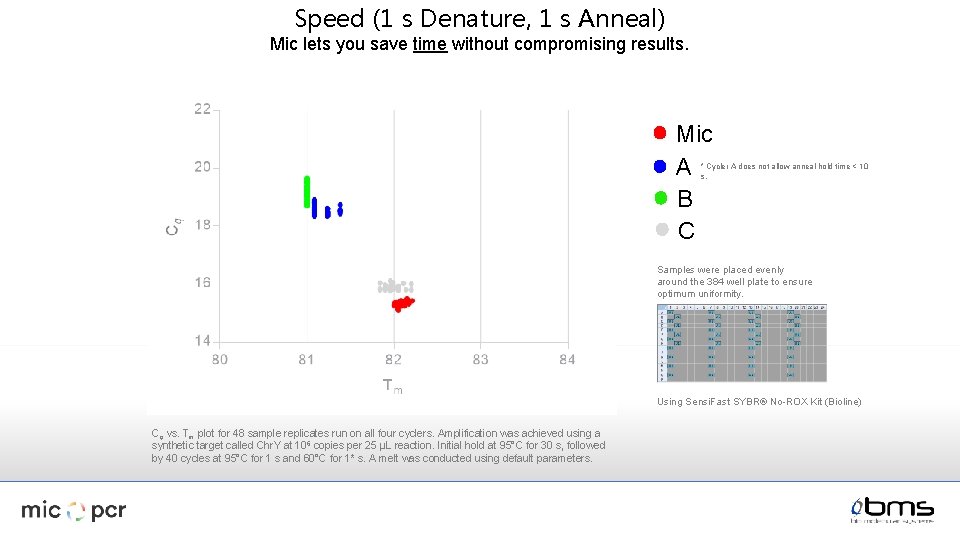
Speed (1 s Denature, 1 s Anneal) Mic lets you save time without compromising results. Mic A B C * Cycler A does not allow anneal hold time < 10 s. Samples were placed evenly around the 384 well plate to ensure optimum uniformity. Using Sensi. Fast SYBR® No-ROX Kit (Bioline) Cq vs. Tm plot for 48 sample replicates run on all four cyclers. Amplification was achieved using a synthetic target called Chr. Y at 106 copies per 25 µL reaction. Initial hold at 95°C for 30 s, followed by 40 cycles at 95°C for 1 s and 60°C for 1* s. A melt was conducted using default parameters.
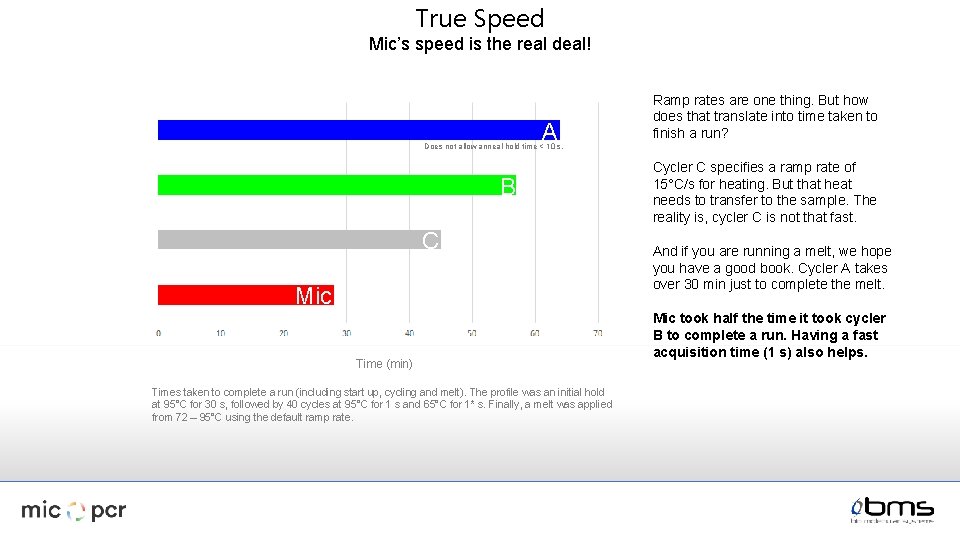
True Speed Mic’s speed is the real deal! A Ramp rates are one thing. But how does that translate into time taken to finish a run? Does not allow anneal hold time < 10 s. B C Mic Time (min) Times taken to complete a run (including start up, cycling and melt). The profile was an initial hold at 95°C for 30 s, followed by 40 cycles at 95°C for 1 s and 65°C for 1* s. Finally, a melt was applied from 72 – 95°C using the default ramp rate. Cycler C specifies a ramp rate of 15°C/s for heating. But that heat needs to transfer to the sample. The reality is, cycler C is not that fast. And if you are running a melt, we hope you have a good book. Cycler A takes over 30 min just to complete the melt. Mic took half the time it took cycler B to complete a run. Having a fast acquisition time (1 s) also helps.
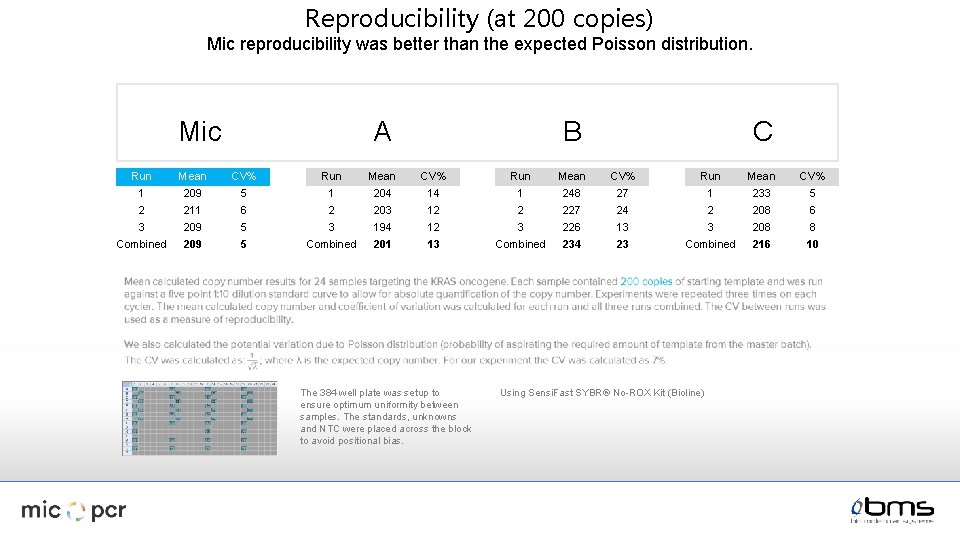
Reproducibility (at 200 copies) Mic reproducibility was better than the expected Poisson distribution. A Mic C B Run Mean CV% 1 209 5 1 204 14 1 248 27 1 233 5 2 211 6 2 203 12 2 227 24 2 208 6 3 209 5 3 194 12 3 226 13 3 208 8 Combined 209 5 Combined 201 13 Combined 234 23 Combined 216 10 The 384 well plate was setup to ensure optimum uniformity between samples. The standards, unknowns and NTC were placed across the block to avoid positional bias. Using Sensi. Fast SYBR® No-ROX Kit (Bioline)
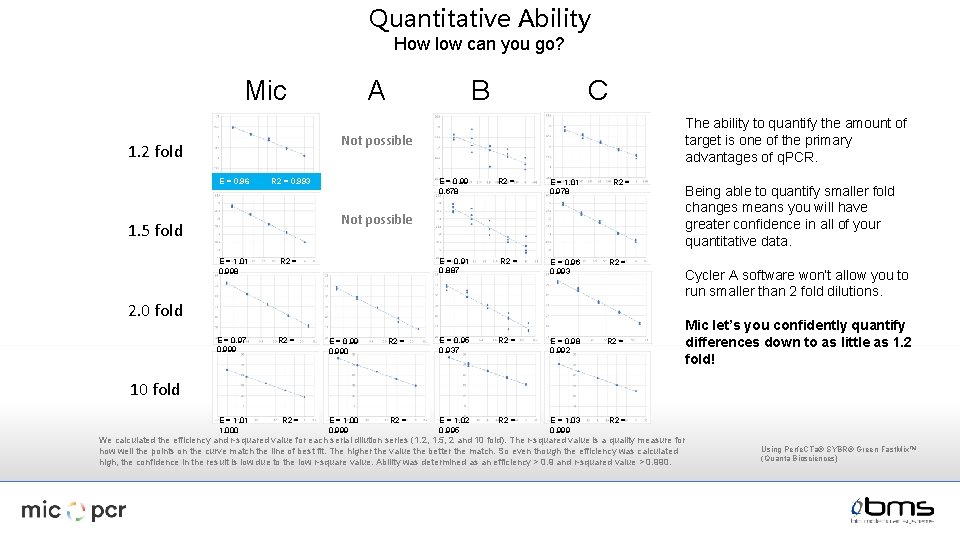
Quantitative Ability How low can you go? A Mic B C The ability to quantify the amount of target is one of the primary advantages of q. PCR. Not possible 1. 2 fold E = 0. 96 E = 0. 99 0. 678 R 2 = 0. 993 R 2 = E = 1. 01 0. 978 R 2 = Not possible 1. 5 fold E = 1. 01 0. 998 R 2 = E = 0. 97 0. 999 R 2 = E = 0. 91 0. 887 R 2 = E = 0. 96 0. 993 R 2 = E = 0. 98 0. 992 R 2 = E = 1. 03 0. 999 R 2 = Cycler A software won’t allow you to run smaller than 2 fold dilutions. 2. 0 fold E = 0. 990 R 2 = E = 0. 95 0. 937 E = 1. 00 0. 999 R 2 = E = 1. 02 0. 995 Being able to quantify smaller fold changes means you will have greater confidence in all of your quantitative data. Mic let’s you confidently quantify differences down to as little as 1. 2 fold! 10 fold E = 1. 01 1. 000 R 2 = We calculated the efficiency and r-squared value for each serial dilution series (1. 2, 1. 5, 2 and 10 fold). The r-squared value is a quality measure for how well the points on the curve match the line of best fit. The higher the value the better the match. So even though the efficiency was calculated high, the confidence in the result is low due to the low r-square value. Ability was determined as an efficiency > 0. 9 and r-squared value > 0. 990. Using Perfe. CTa® SYBR® Green Fast. Mix™ (Quanta Biosciences)
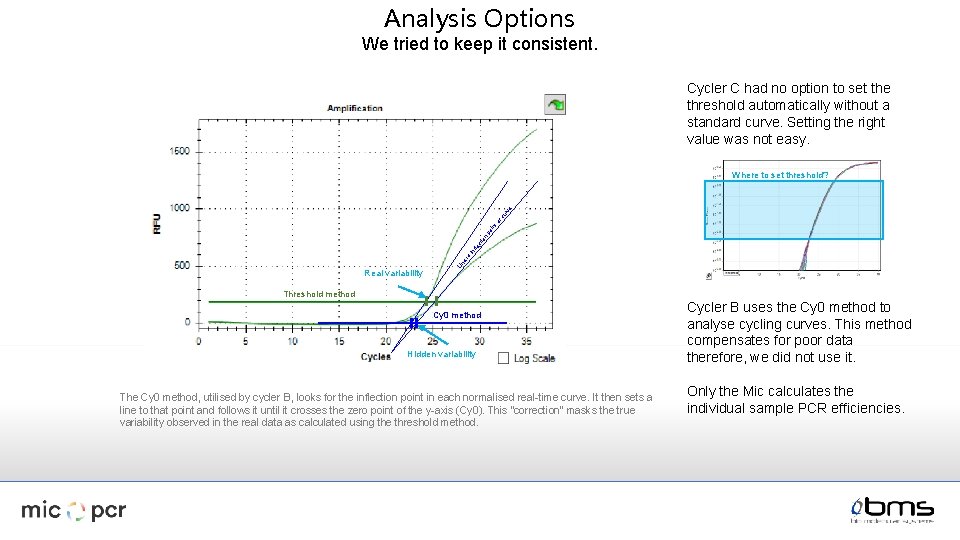
Analysis Options We tried to keep it consistent. Cycler C had no option to set the threshold automatically without a standard curve. Setting the right value was not easy. Real variability Li n e to in fle ct io n po in to fc ur ve Where to set threshold? Threshold method Cy 0 method Hidden variability The Cy 0 method, utilised by cycler B, looks for the inflection point in each normalised real-time curve. It then sets a line to that point and follows it until it crosses the zero point of the y-axis (Cy 0). This “correction” masks the true variability observed in the real data as calculated using the threshold method. Cycler B uses the Cy 0 method to analyse cycling curves. This method compensates for poor data therefore, we did not use it. Only the Mic calculates the individual sample PCR efficiencies.
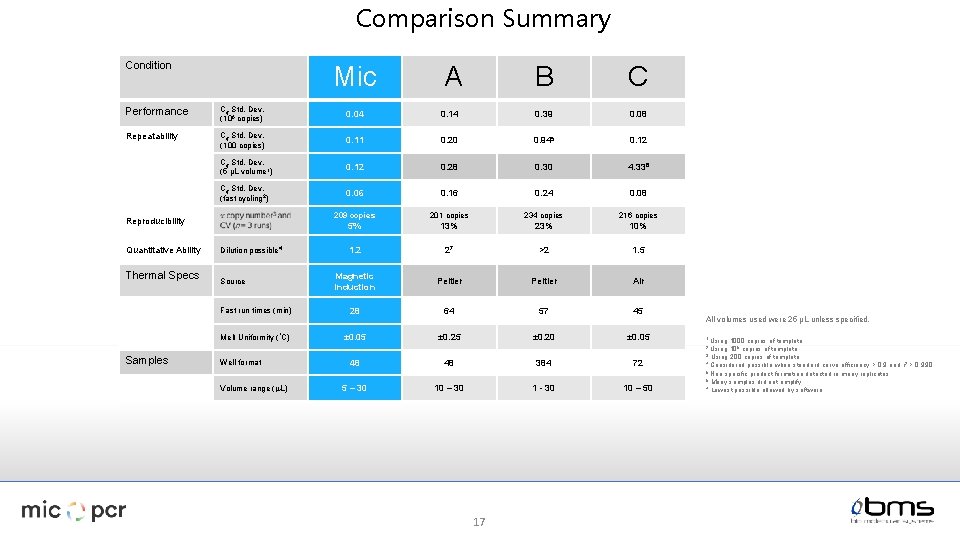
Comparison Summary Condition Mic A B C Performance Cq Std. Dev. (106 copies) 0. 04 0. 14 0. 39 0. 08 Repeatability Cq Std. Dev. (100 copies) 0. 11 0. 20 0. 945 0. 12 Cq Std. Dev. (5 µL volume 1) 0. 12 0. 28 0. 30 4. 336 Cq Std. Dev. (fast cycling 2) 0. 06 0. 16 0. 24 0. 08 209 copies 201 copies 234 copies 216 copies 5% 13% 23% 10% 1. 2 27 >2 1. 5 Magnetic induction Peltier Air Fast run times (min) 28 64 57 45 Melt Uniformity (°C) ± 0. 05 ± 0. 20 ± 0. 05 Reproducibility Quantitative Ability Thermal Specs Dilution possible 4 Source All volumes used were 25 µL unless specified. 1 Using 1000 copies of template 106 copies of template. 3 Using 200 copies of template. 4 Considered possible when standard curve efficiency > 0. 9 and r 2 > 0. 990 5 Non specific product formation detected in many replicates. 6 Many samples did not amplify. 7 Lowest possible allowed by software 2 Using Samples Well format Volume range (m. L) 48 48 384 72 5 – 30 10 – 30 1 - 30 10 – 50 17
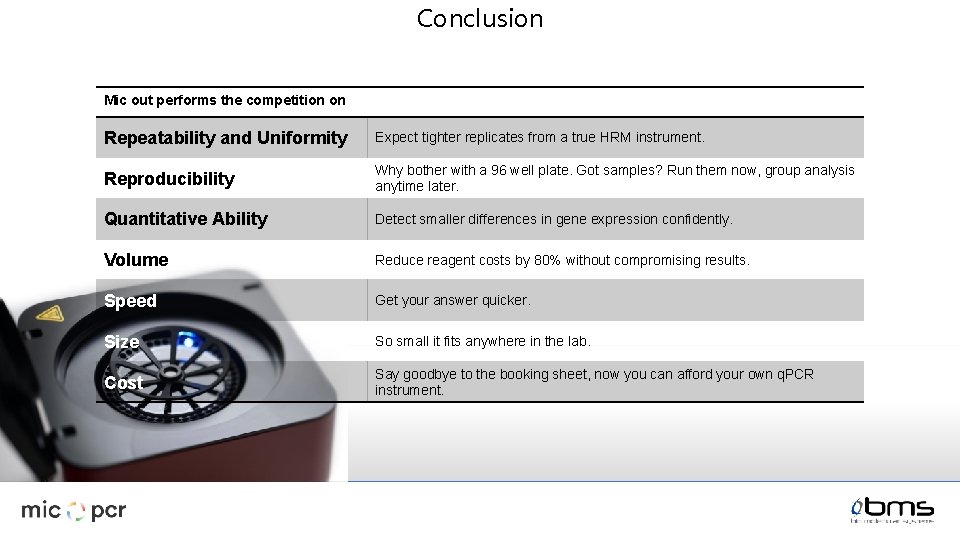
Conclusion Mic out performs the competition on Repeatability and Uniformity Expect tighter replicates from a true HRM instrument. Reproducibility Why bother with a 96 well plate. Got samples? Run them now, group analysis anytime later. Quantitative Ability Detect smaller differences in gene expression confidently. Volume Reduce reagent costs by 80% without compromising results. Speed Get your answer quicker. Size So small it fits anywhere in the lab. Cost Say goodbye to the booking sheet, now you can afford your own q. PCR instrument.
- Slides: 18