
install packages RCurl install RCurl if you have

- Slides: 8
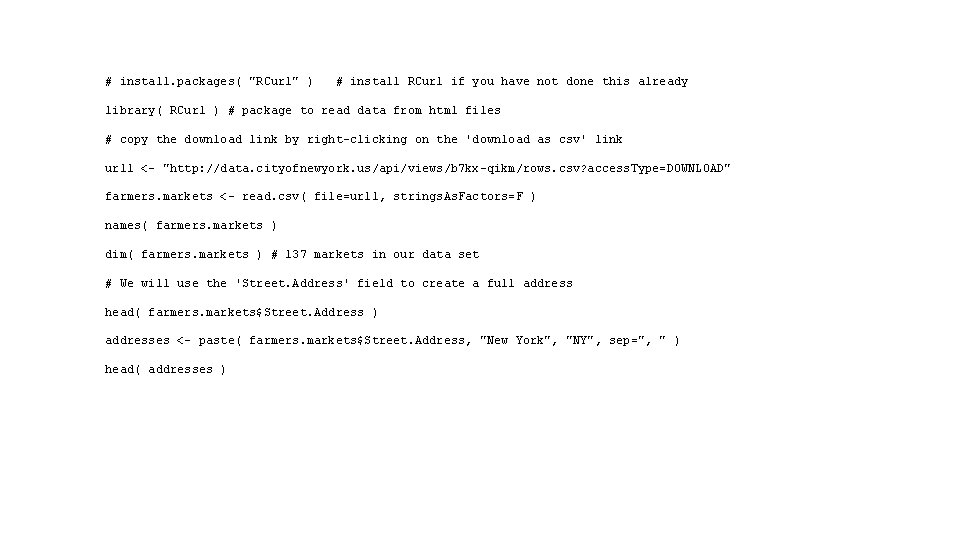
# install. packages( "RCurl" ) # install RCurl if you have not done this already library( RCurl ) # package to read data from html files # copy the download link by right-clicking on the 'download as csv' link url 1 <- "http: //data. cityofnewyork. us/api/views/b 7 kx-qikm/rows. csv? access. Type=DOWNLOAD" farmers. markets <- read. csv( file=url 1, strings. As. Factors=F ) names( farmers. markets ) dim( farmers. markets ) # 137 markets in our data set # We will use the 'Street. Address' field to create a full address head( farmers. markets$Street. Address ) addresses <- paste( farmers. markets$Street. Address, "New York", "NY", sep=", " ) head( addresses )
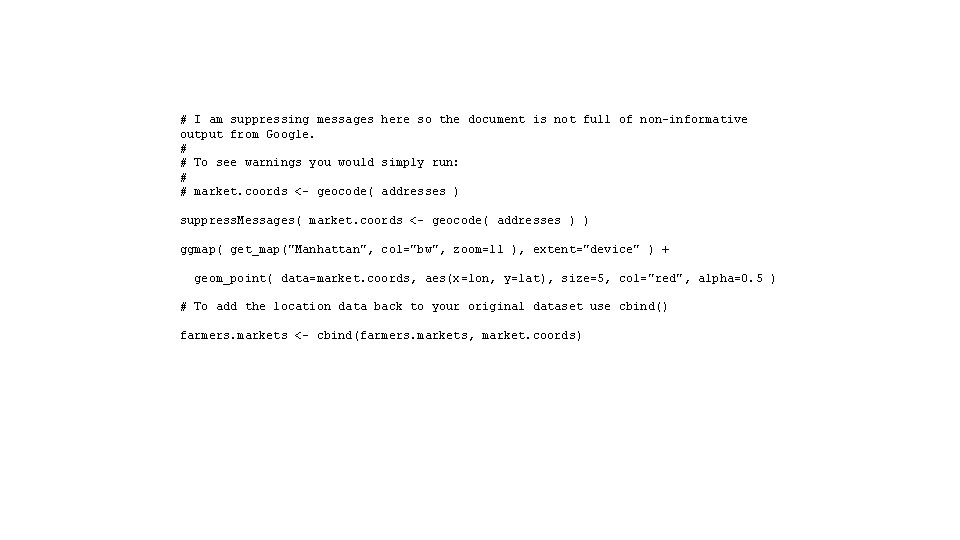
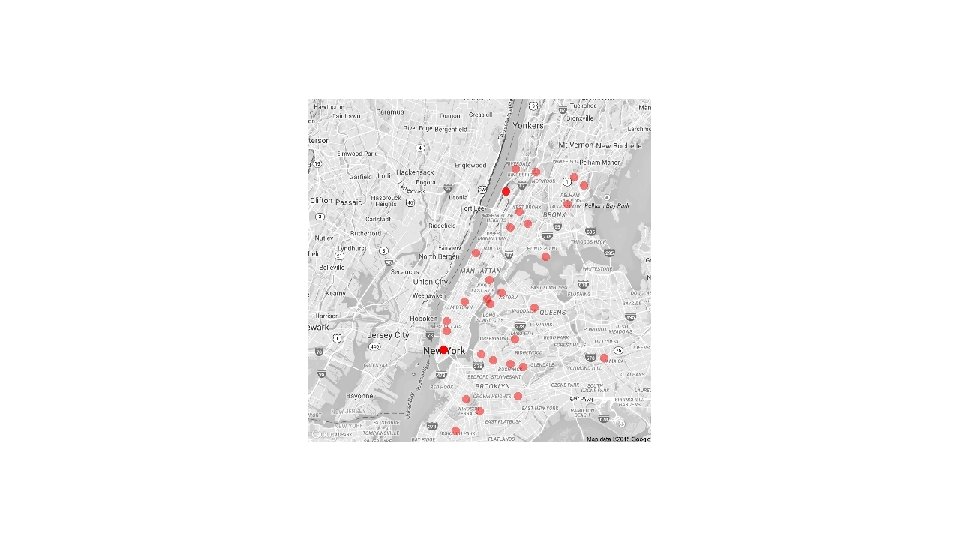
# I am suppressing messages here so the document is not full of non-informative output from Google. # # To see warnings you would simply run: # # market. coords <- geocode( addresses ) suppress. Messages( market. coords <- geocode( addresses ) ) ggmap( get_map("Manhattan", col="bw", zoom=11 ), extent="device" ) + geom_point( data=market. coords, aes(x=lon, y=lat), size=5, col="red", alpha=0. 5 ) # To add the location data back to your original dataset use cbind() farmers. markets <- cbind(farmers. markets, market. coords)
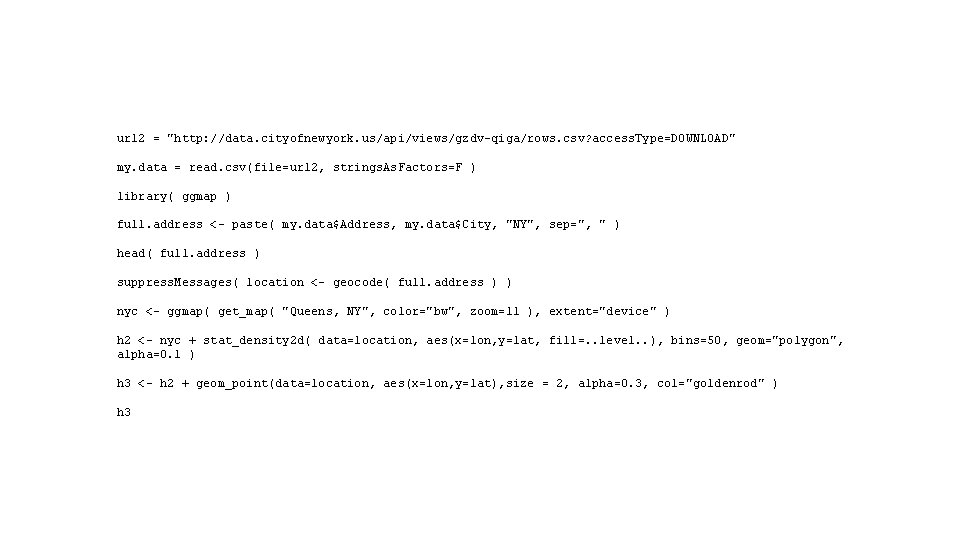
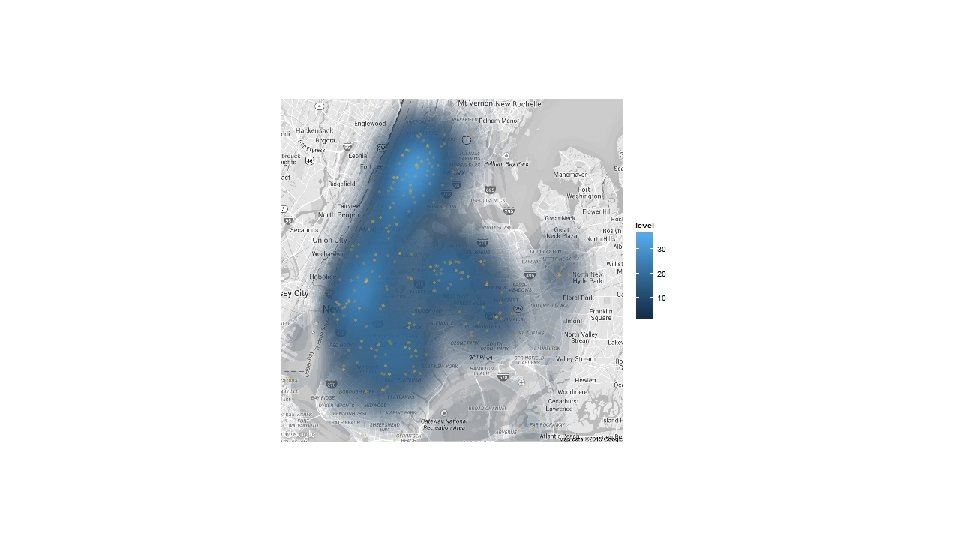
url 2 = "http: //data. cityofnewyork. us/api/views/gzdv-qiga/rows. csv? access. Type=DOWNLOAD" my. data = read. csv(file=url 2, strings. As. Factors=F ) library( ggmap ) full. address <- paste( my. data$Address, my. data$City, "NY", sep=", " ) head( full. address ) suppress. Messages( location <- geocode( full. address ) ) nyc <- ggmap( get_map( "Queens, NY", color="bw", zoom=11 ), extent="device" ) h 2 <- nyc + stat_density 2 d( data=location, aes(x=lon, y=lat, fill=. . level. . ), bins=50, geom="polygon", alpha=0. 1 ) h 3 <- h 2 + geom_point(data=location, aes(x=lon, y=lat), size = 2, alpha=0. 3, col="goldenrod" ) h 3
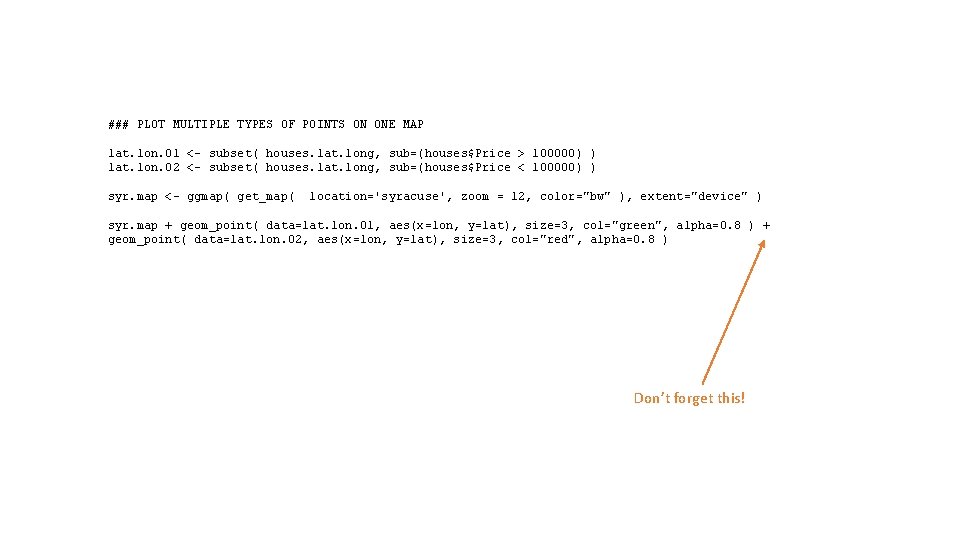
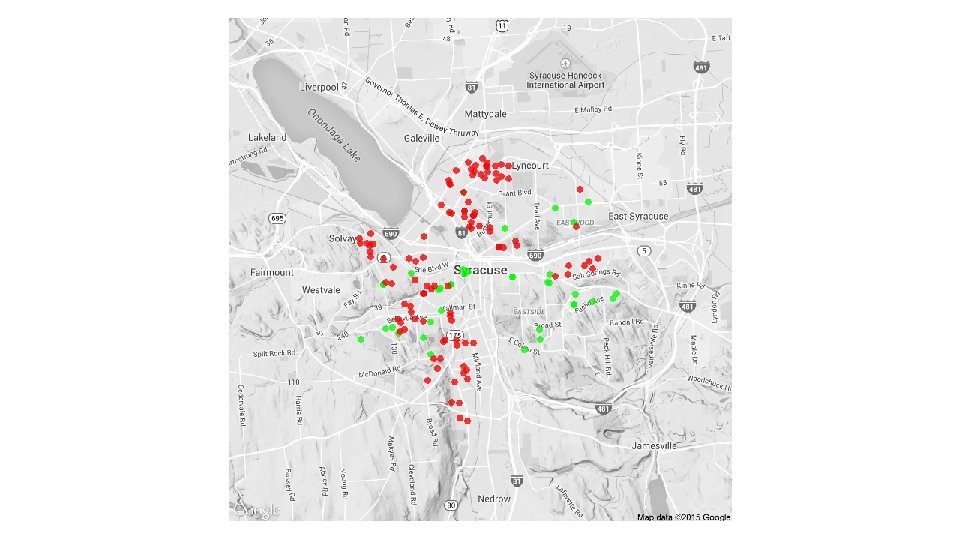
### PLOT MULTIPLE TYPES OF POINTS ON ONE MAP lat. lon. 01 <- subset( houses. lat. long, sub=(houses$Price > 100000) ) lat. lon. 02 <- subset( houses. lat. long, sub=(houses$Price < 100000) ) syr. map <- ggmap( get_map( location='syracuse', zoom = 12, color="bw" ), extent="device" ) syr. map + geom_point( data=lat. lon. 01, aes(x=lon, y=lat), size=3, col="green", alpha=0. 8 ) + geom_point( data=lat. lon. 02, aes(x=lon, y=lat), size=3, col="red", alpha=0. 8 ) Don’t forget this!