
Inspecting and Curating MPOG Data before the statistical
Inspecting and Curating MPOG Data before the statistical analysis Nicholas J. Douville, MD, Ph. D Clinical Lecturer University of Michigan
Outline • Data Visualization – MPOG Data Explorer • Data Cleaning – Case-by-Case Audit Tool – MPOG Data Cleaning Tool
You finally have your data now what? • Generate Descriptive Statistics – This is a good way to spot “extreme” outliers that are likely to be a source of data error
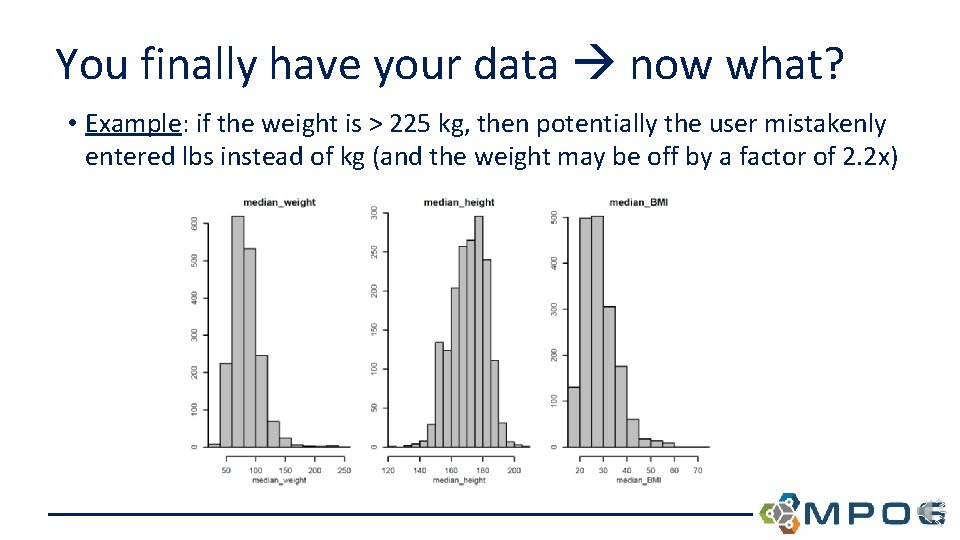
You finally have your data now what? • Example: if the weight is > 225 kg, then potentially the user mistakenly entered lbs instead of kg (and the weight may be off by a factor of 2. 2 x)
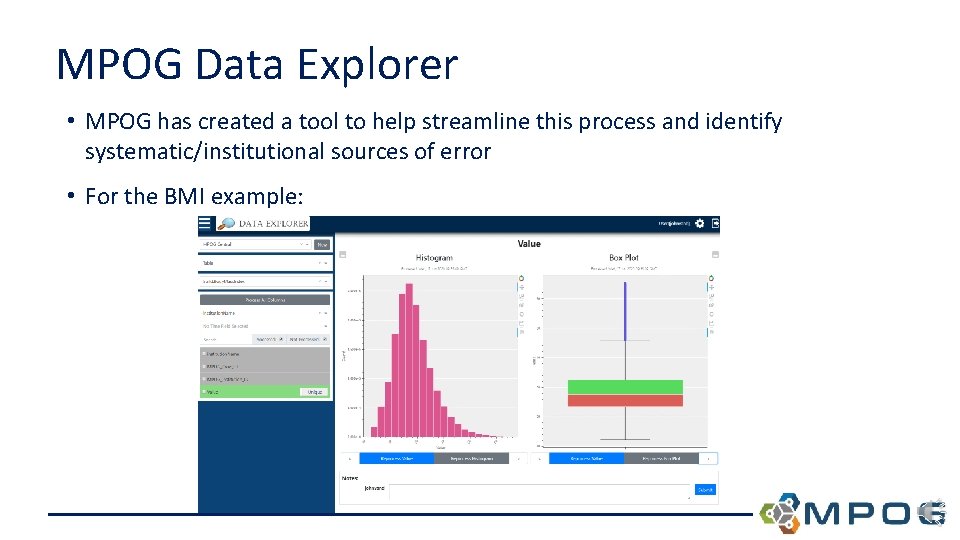
MPOG Data Explorer • MPOG has created a tool to help streamline this process and identify systematic/institutional sources of error • For the BMI example:
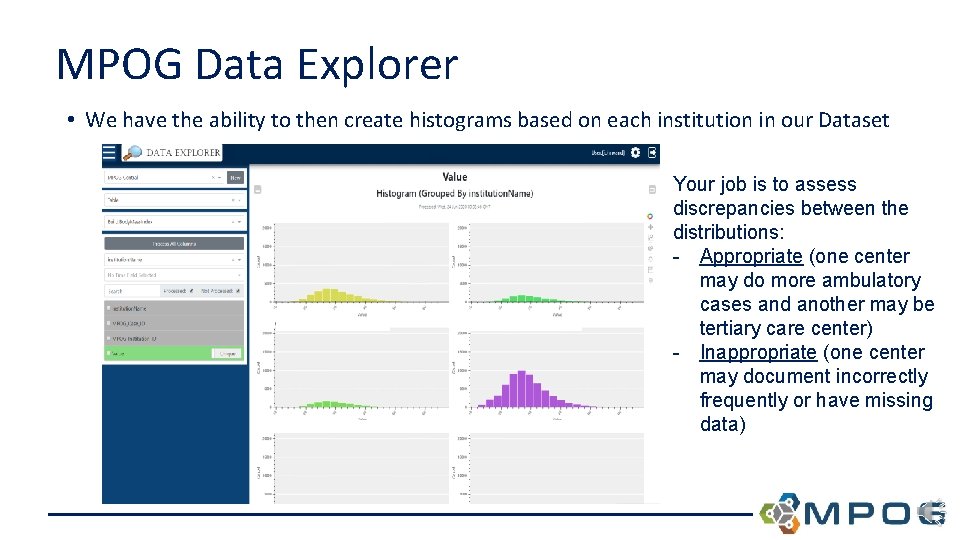
MPOG Data Explorer • We have the ability to then create histograms based on each institution in our Dataset Your job is to assess discrepancies between the distributions: - Appropriate (one center may do more ambulatory cases and another may be tertiary care center) - Inappropriate (one center may document incorrectly frequently or have missing data)
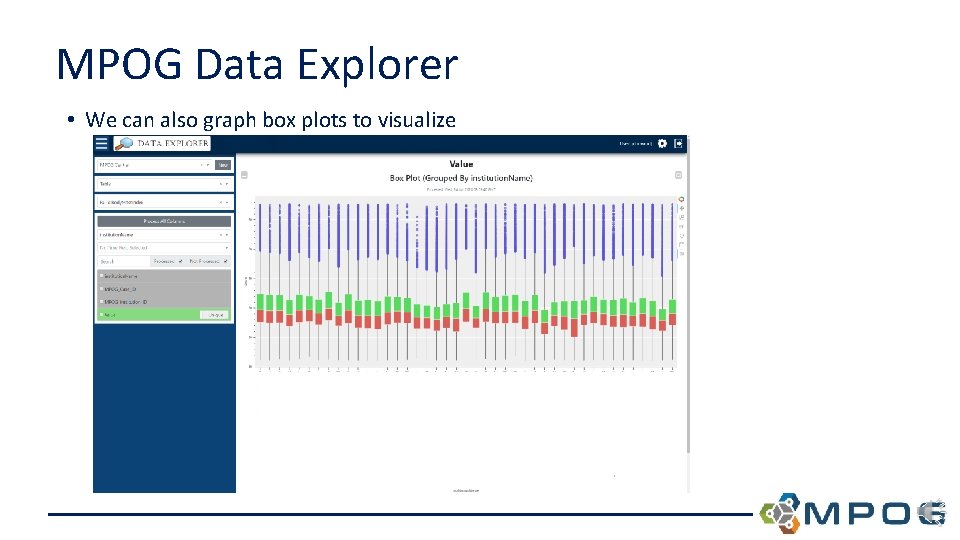
MPOG Data Explorer • We can also graph box plots to visualize
Data “Cleaning” – Case by Case Audit – You need to consider all sources of error for your data. – Examples: – Blood Transfusion: 250 units of packed red blood products at a single moment of time, they almost certainly meant to chart 250 m. L of p. RBC – Vasopressors/Inotropes: phenylephrine is charted at our institution in mcg/min. – If the provider accidently enters mcg/kg/min … then the factor could be off by a factor of 100. – This does not always reveal itself in histograms, but if you see a second “peak” within the distribution, it is worth investigating if there is a common “error” that a few different providers have made.
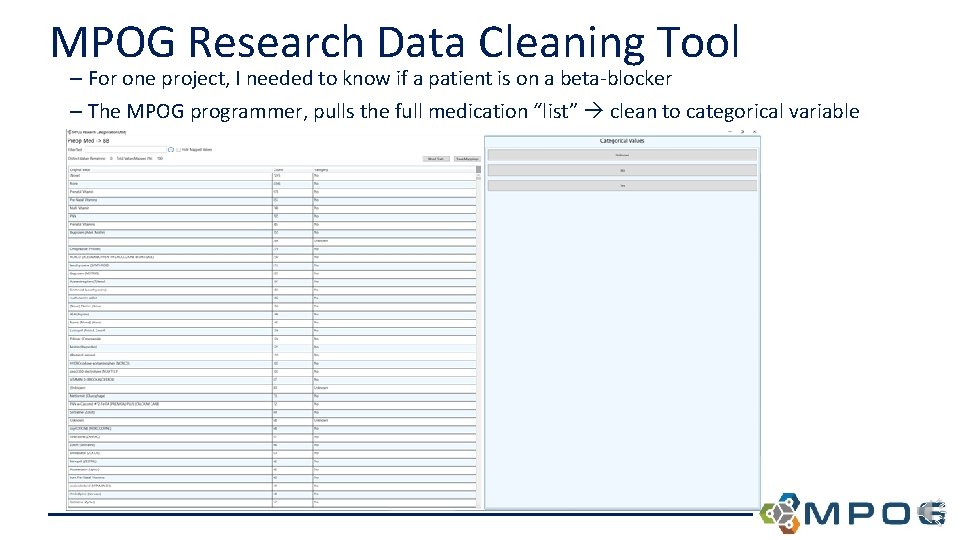
MPOG Research Data Cleaning Tool – For one project, I needed to know if a patient is on a beta-blocker – The MPOG programmer, pulls the full medication “list” clean to categorical variable
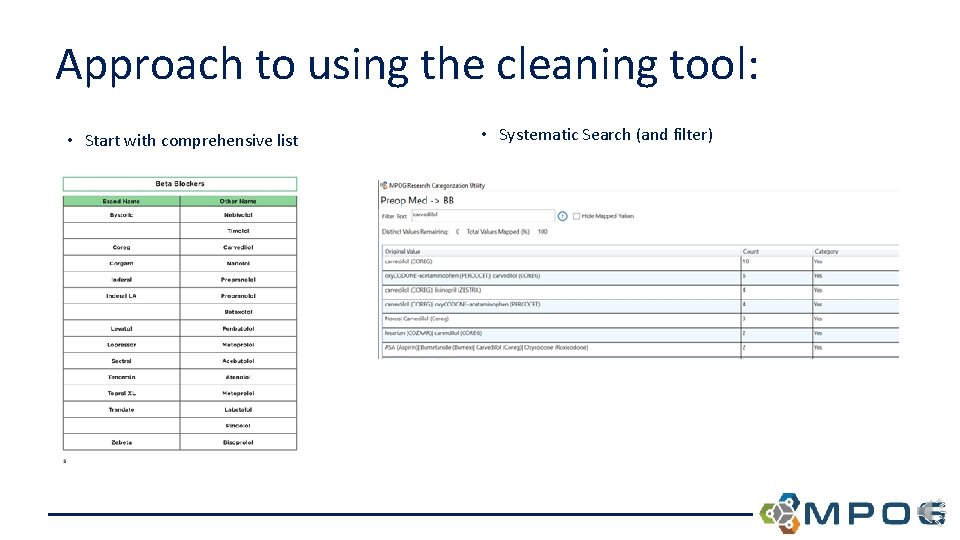
Approach to using the cleaning tool: • Start with comprehensive list • Systematic Search (and filter)
Next Steps • Then Trade Names: Coreg • Consider misspellings: Labetolol …. Inderol…. etc • Consider negations: “patient not on a beta blocker” • Consider “Hide Mapped Values” to remove ones you have already viewed and sorted • Remember: pristine data quality isn't a priority for busy, multi-tasking clinicians
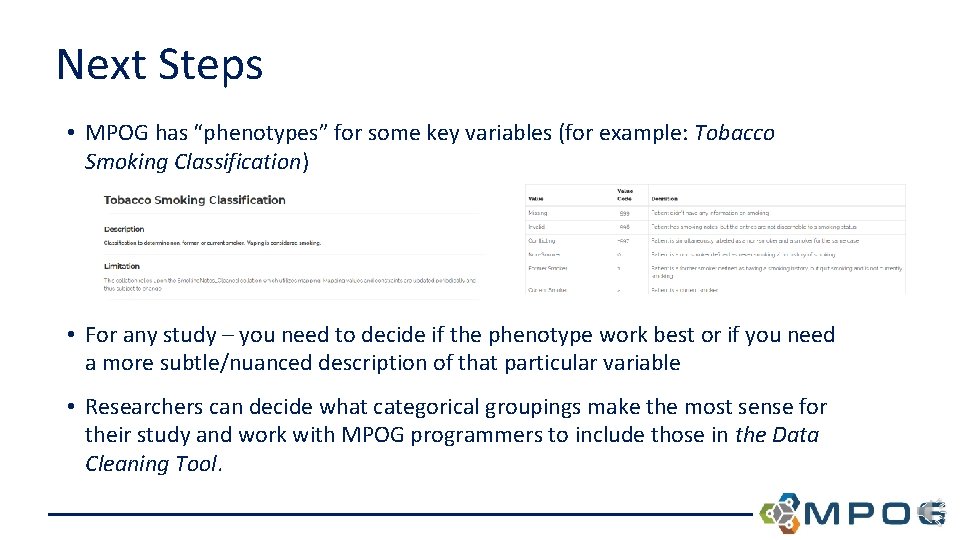
Next Steps • MPOG has “phenotypes” for some key variables (for example: Tobacco Smoking Classification) • For any study – you need to decide if the phenotype work best or if you need a more subtle/nuanced description of that particular variable • Researchers can decide what categorical groupings make the most sense for their study and work with MPOG programmers to include those in the Data Cleaning Tool.
Summary • Data Visualization – MPOG Data Explorer • Data Cleaning – Case-by-Case Audit tool – MPOG Data Cleaning Tool
- Slides: 13