
INSOL International Global Insolvency Practice Course Module A
INSOL International Global Insolvency Practice Course Module A Virginia Woolf Room Hotel Russell Monday 7 th September Wednesday 9 th September 2015

Day Three

Welcome G. Ray Warner, Course Leader St. John’s University School of Law Of Counsel, Greenberg Traurig LLP, USA
Session Eight Accounting & Finance Dolf Bruins Slot, EY, Germany
Agenda – The restructuring market – Financial information – Financial restructuring introduction – Financial restructuring roadmap – Data analysis – Financial restructuring roadmap Negotiating a solution

6 novemb
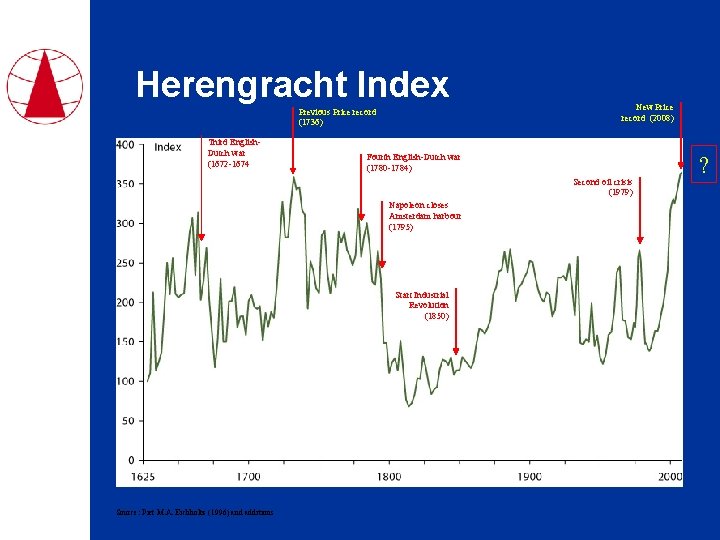
Herengracht Index Previous Price record (1736) Third English. Dutch war (1672 -1674 New Price record (2008) Fourth English-Dutch war (1780 -1784) Second oil crisis (1979) Napoleon closes Amsterdam harbour (1795) Start Industrial Revolution (1850) Source: Piet M. A. Eichholtz (1996) and additions ?
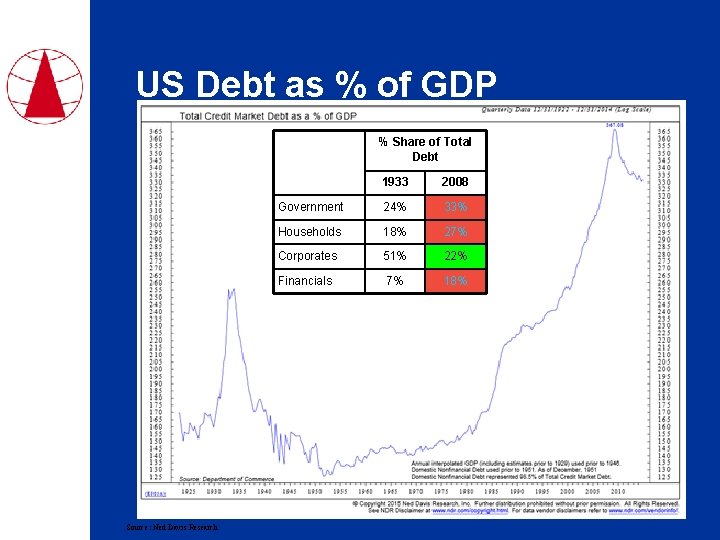
US Debt as % of GDP % Share of Total Debt Source: Ned Davis Research 1933 2008 Government 24% 33% Households 18% 27% Corporates 51% 22% Financials 7% 18%
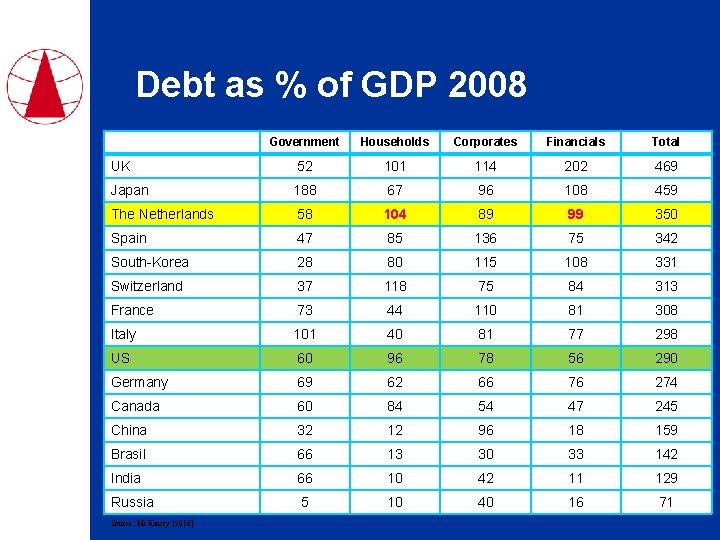
Debt as % of GDP 2008 Government Households Corporates Financials Total UK 52 101 114 202 469 Japan 188 67 96 108 459 The Netherlands 58 104 89 99 350 Spain 47 85 136 75 342 South-Korea 28 80 115 108 331 Switzerland 37 118 75 84 313 France 73 44 110 81 308 Italy 101 40 81 77 298 US 60 96 78 56 290 Germany 69 62 66 76 274 Canada 60 84 54 47 245 China 32 12 96 18 159 Brasil 66 13 30 33 142 India 66 10 42 11 129 Russia 5 10 40 16 71 Source: Mc. Kinsey [2010]
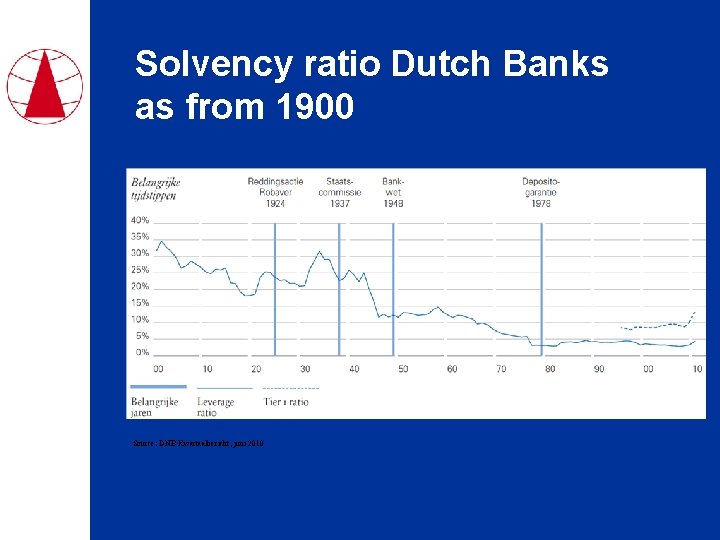
Solvency ratio Dutch Banks as from 1900 Source: DNB Kwartaalbericht, juni 2010
Agenda – The restructuring market – Financial information – Financial restructuring introduction – Financial restructuring roadmap – Data analysis – Financial restructuring roadmap Negotiating a solution
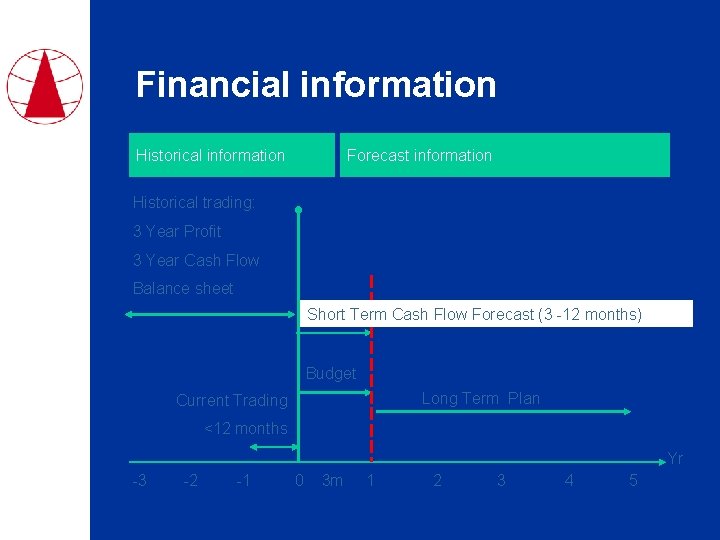
Financial information Historical information Forecast information Historical trading: 3 Year Profit 3 Year Cash Flow Balance sheet Short Term Cash Flow Forecast (3 -12 months) Budget Long Term Plan Current Trading <12 months Yr -3 -2 -1 0 3 m 1 2 3 4 5
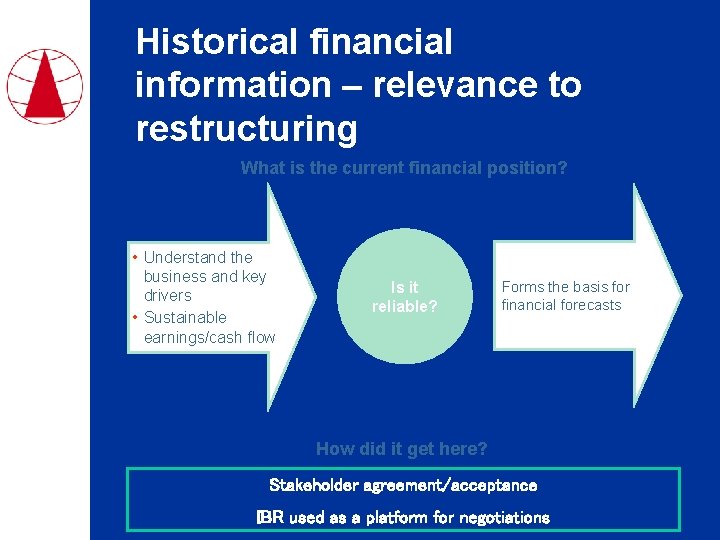
Historical financial information – relevance to restructuring What is the current financial position? • Understand the business and key drivers • Sustainable earnings/cash flow Is it reliable? Forms the basis for financial forecasts How did it get here? Stakeholder agreement/acceptance IBR used as a platform for negotiations
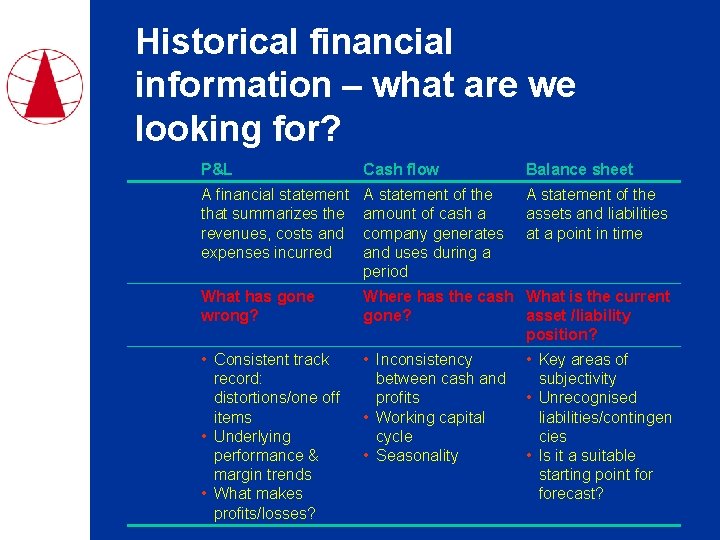
Historical financial information – what are we looking for? P&L Cash flow Balance sheet What? A financial statement that summarizes the revenues, costs and expenses incurred A statement of the amount of cash a company generates and uses during a period A statement of the assets and liabilities at a point in time Why? What has gone wrong? Where has the cash What is the current gone? asset /liability position? Typical • Consistent track issues? record: distortions/one off items • Underlying performance & margin trends • What makes profits/losses? • Inconsistency between cash and profits • Working capital cycle • Seasonality • Key areas of subjectivity • Unrecognised liabilities/contingen cies • Is it a suitable starting point forecast?
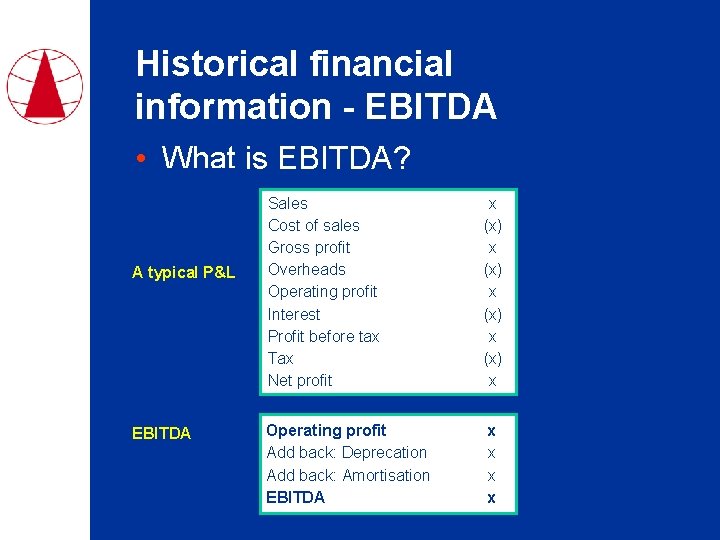
Historical financial information - EBITDA • What is EBITDA? A typical P&L EBITDA Sales Cost of sales Gross profit Overheads Operating profit Interest Profit before tax Tax Net profit x (x) x Operating profit Add back: Deprecation Add back: Amortisation EBITDA x x
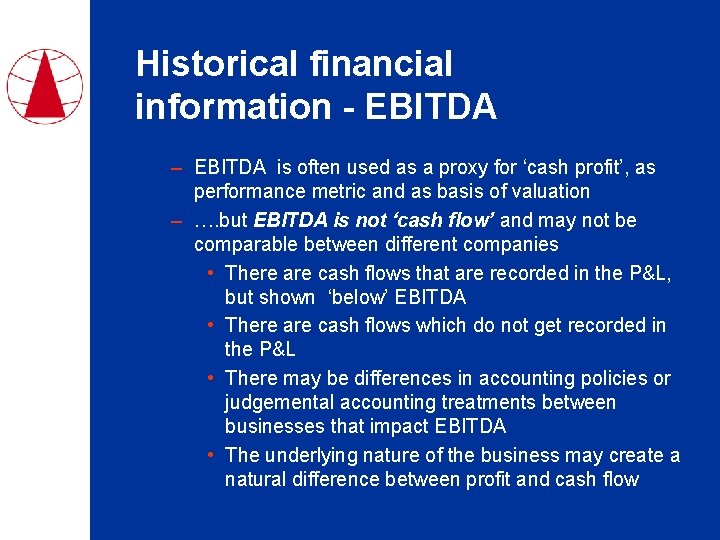
Historical financial information - EBITDA – EBITDA is often used as a proxy for ‘cash profit’, as performance metric and as basis of valuation – …. but EBITDA is not ‘cash flow’ and may not be comparable between different companies • There are cash flows that are recorded in the P&L, but shown ‘below’ EBITDA • There are cash flows which do not get recorded in the P&L • There may be differences in accounting policies or judgemental accounting treatments between businesses that impact EBITDA • The underlying nature of the business may create a natural difference between profit and cash flow
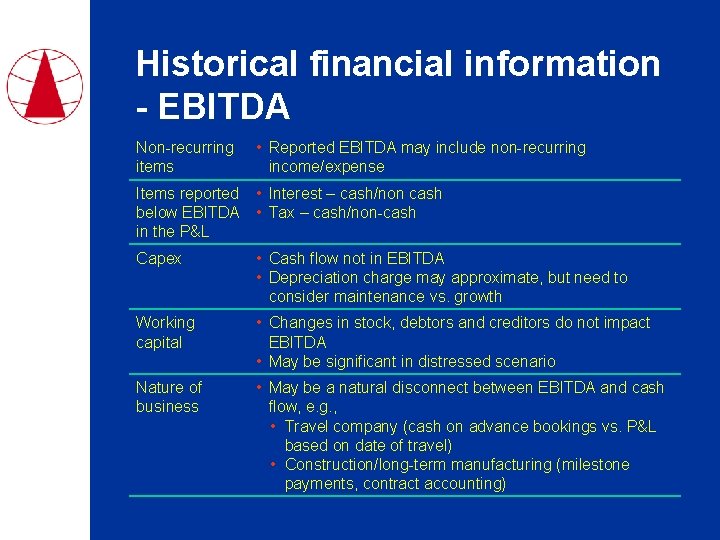
Historical financial information - EBITDA Non-recurring items • Reported EBITDA may include non-recurring income/expense Items reported • Interest – cash/non cash below EBITDA • Tax – cash/non-cash in the P&L Capex • Cash flow not in EBITDA • Depreciation charge may approximate, but need to consider maintenance vs. growth Working capital • Changes in stock, debtors and creditors do not impact EBITDA • May be significant in distressed scenario Nature of business • May be a natural disconnect between EBITDA and cash flow, e. g. , • Travel company (cash on advance bookings vs. P&L based on date of travel) • Construction/long-term manufacturing (milestone payments, contract accounting)
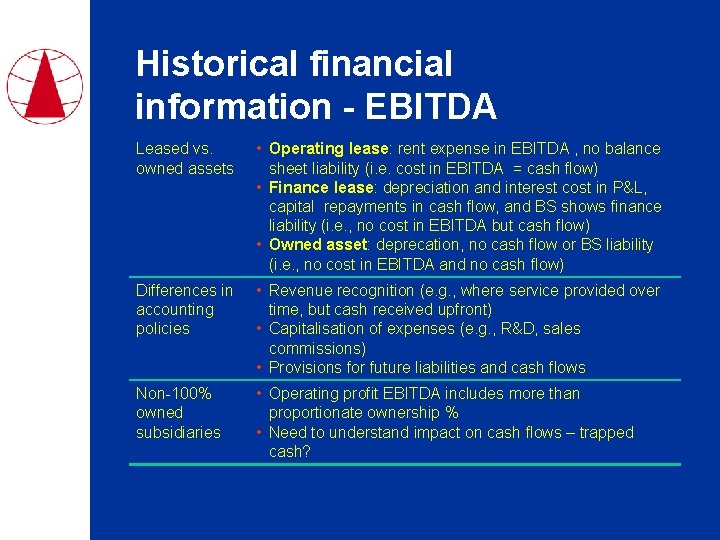
Historical financial information - EBITDA Leased vs. owned assets • Operating lease: rent expense in EBITDA , no balance sheet liability (i. e. cost in EBITDA = cash flow) • Finance lease: depreciation and interest cost in P&L, capital repayments in cash flow, and BS shows finance liability (i. e. , no cost in EBITDA but cash flow) • Owned asset: deprecation, no cash flow or BS liability (i. e. , no cost in EBITDA and no cash flow) Differences in accounting policies • Revenue recognition (e. g. , where service provided over time, but cash received upfront) • Capitalisation of expenses (e. g. , R&D, sales commissions) • Provisions for future liabilities and cash flows Non-100% owned subsidiaries • Operating profit EBITDA includes more than proportionate ownership % • Need to understand impact on cash flows – trapped cash?
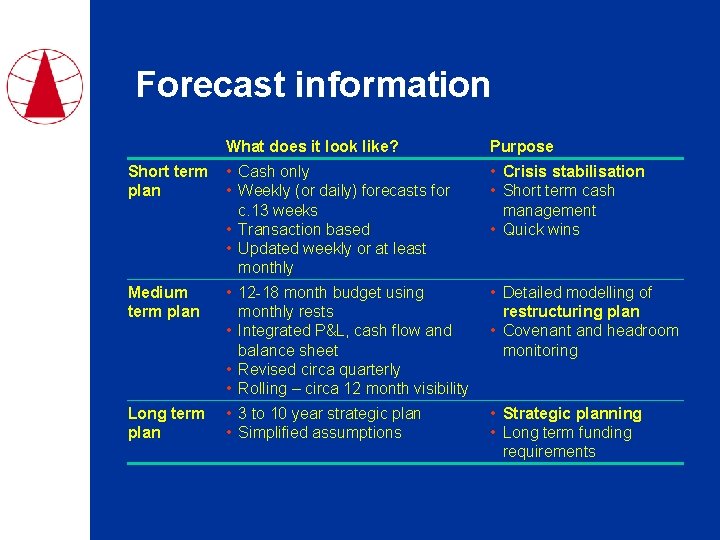
Forecast information What does it look like? Purpose Short term plan • Cash only • Weekly (or daily) forecasts for c. 13 weeks • Transaction based • Updated weekly or at least monthly • Crisis stabilisation • Short term cash management • Quick wins Medium term plan • 12 -18 month budget using monthly rests • Integrated P&L, cash flow and balance sheet • Revised circa quarterly • Rolling – circa 12 month visibility • Detailed modelling of restructuring plan • Covenant and headroom monitoring Long term plan • 3 to 10 year strategic plan • Simplified assumptions • Strategic planning • Long term funding requirements
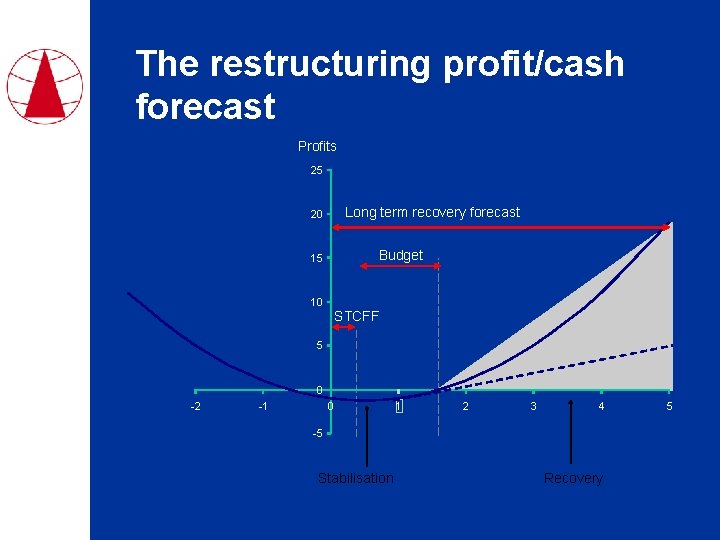
The restructuring profit/cash forecast Profits 25 Long term recovery forecast 20 Budget 15 10 STCFF 5 0 -2 -1 0 1 2 3 4 -5 Stabilisation 5 Yr Recovery

Forecasts - Medium & long term • Integrated P&L, Balance Sheet and Cash Flow • – Focus on cash 1. Base case ('As is') 2. Restructuring case ('Management/Equity case') • Disposals • Cost reduction • Cost and benefits 3. Sensitised case ('Bank Case') • Realistic downside • Covenant setting
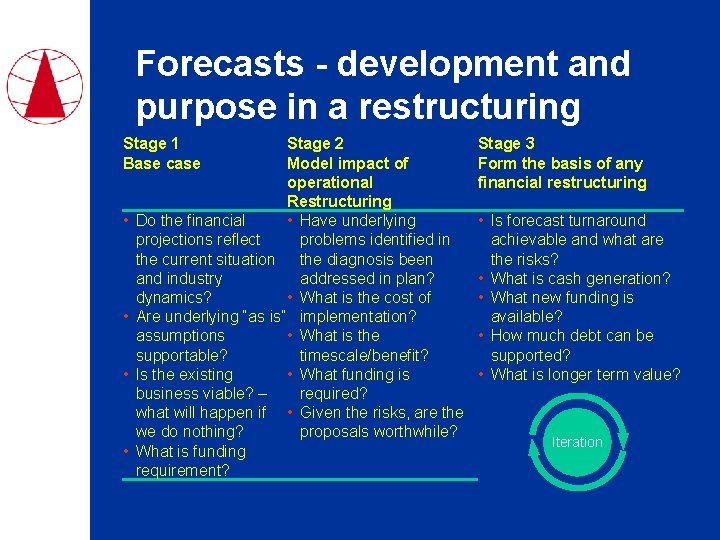
Forecasts - development and purpose in a restructuring Stage 1 Base case Stage 3 Form the basis of any financial restructuring • • Is forecast turnaround achievable and what are the risks? • What is cash generation? • What new funding is available? • How much debt can be supported? • What is longer term value? • • • Stage 2 Model impact of operational Restructuring Do the financial • Have underlying projections reflect problems identified in the current situation the diagnosis been and industry addressed in plan? dynamics? • What is the cost of Are underlying “as is” implementation? assumptions • What is the supportable? timescale/benefit? Is the existing • What funding is business viable? – required? what will happen if • Given the risks, are the we do nothing? proposals worthwhile? What is funding requirement? Iteration
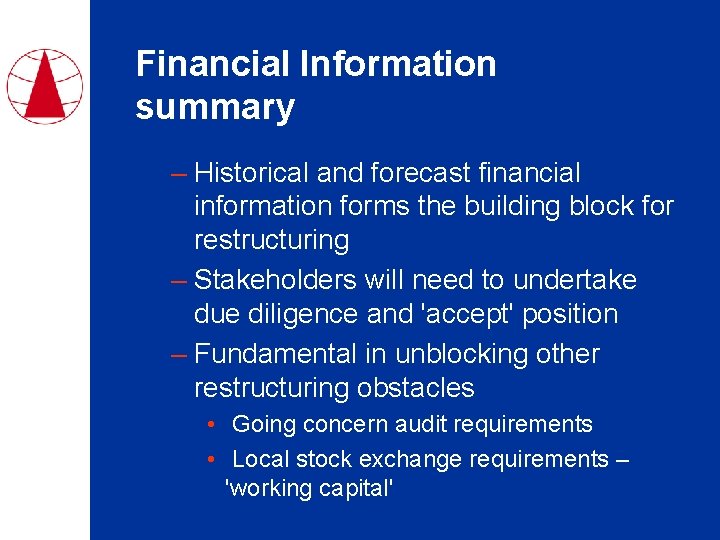
Financial Information summary – Historical and forecast financial information forms the building block for restructuring – Stakeholders will need to undertake due diligence and 'accept' position – Fundamental in unblocking other restructuring obstacles • Going concern audit requirements • Local stock exchange requirements – 'working capital'
Agenda – The restructuring market – Financial information – Financial restructuring introduction – Financial restructuring roadmap - Data analysis – Financial restructuring roadmap Negotiating a solution
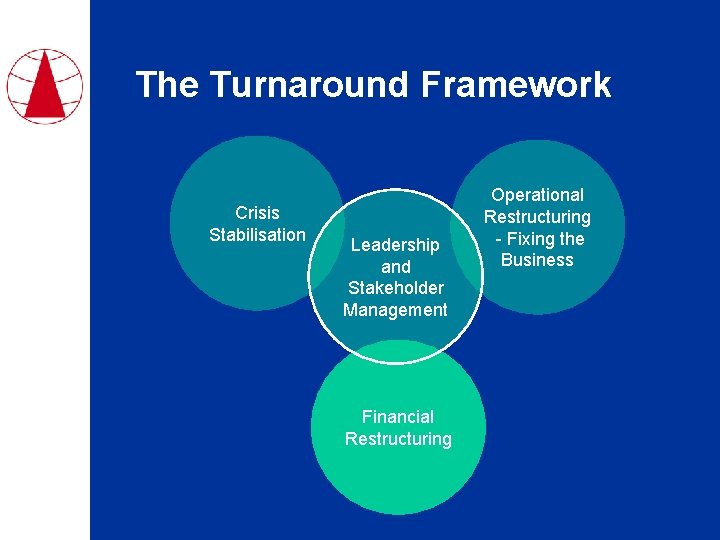
The Turnaround Framework Financial restructuring cannot be viewed in isolation Crisis Stabilisation Leadership and Stakeholder Management Financial Restructuring Operational Restructuring - Fixing the Business
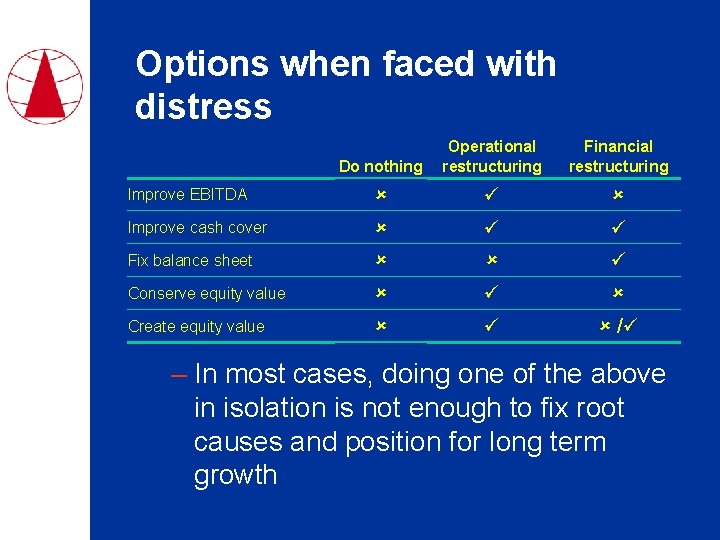
Options when faced with distress Do nothing Operational restructuring Financial restructuring Improve EBITDA Improve cash cover Fix balance sheet Conserve equity value Create equity value / – In most cases, doing one of the above in isolation is not enough to fix root causes and position for long term growth
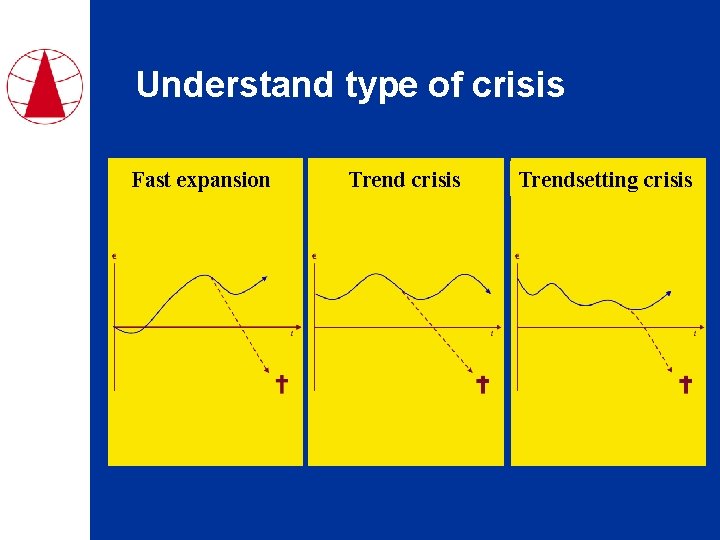
Understand type of crisis Fast expansion Trend crisis Trendsetting crisis
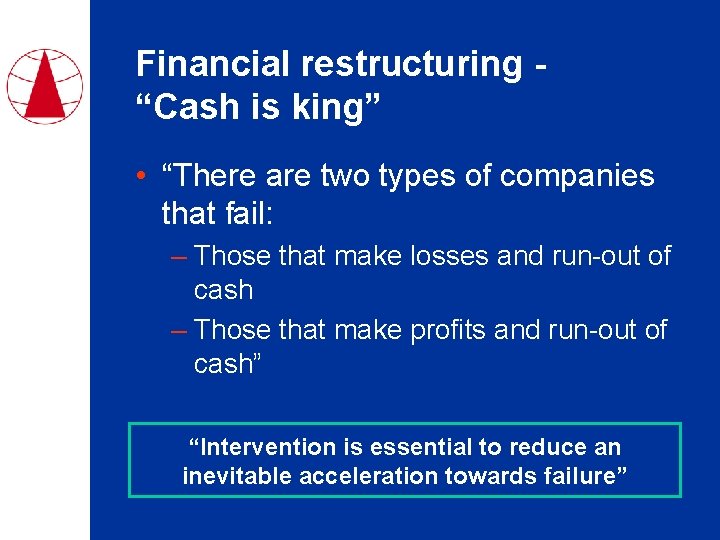
Financial restructuring “Cash is king” • “There are two types of companies that fail: – Those that make losses and run-out of cash – Those that make profits and run-out of cash” “Intervention is essential to reduce an inevitable acceleration towards failure”
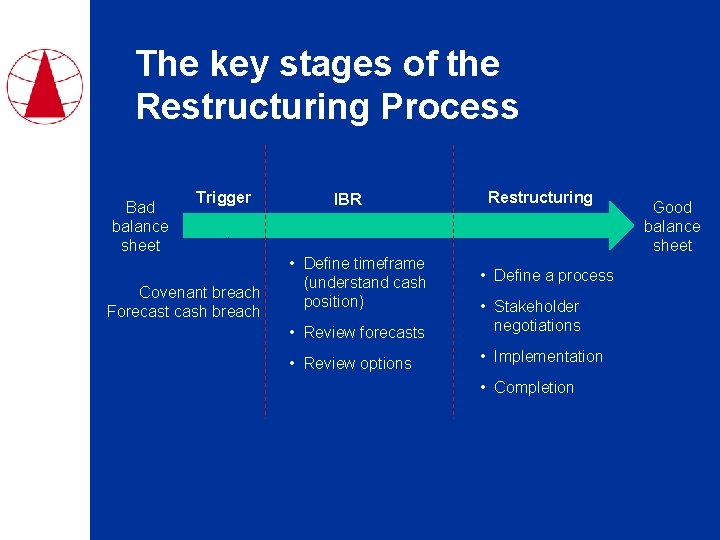
The key stages of the Restructuring Process Bad balance sheet Trigger Covenant breach Forecast cash breach IBR • Define timeframe (understand cash position) Restructuring • Define a process • Review forecasts • Stakeholder negotiations • Review options • Implementation • Completion Good balance sheet
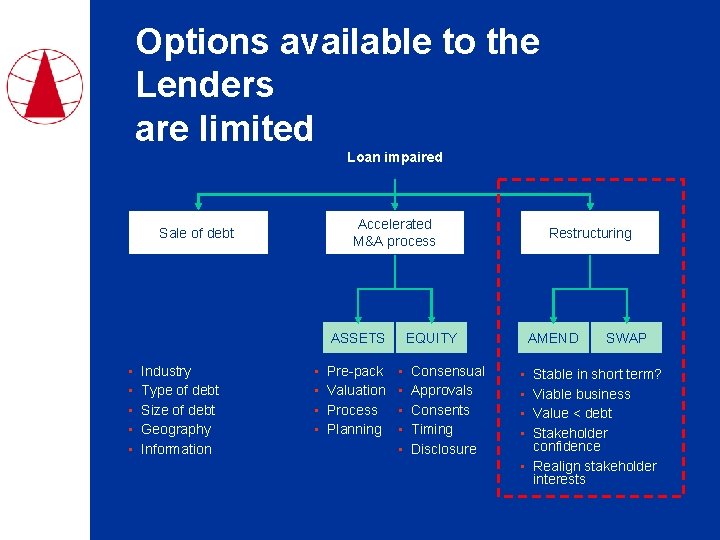
Options available to the Lenders are limited Loan impaired Accelerated M&A process Sale of debt ASSETS • • • Industry Type of debt Size of debt Geography Information • • Pre-pack Valuation Process Planning Restructuring EQUITY • • • Consensual Approvals Consents Timing Disclosure AMEND • • SWAP Stable in short term? Viable business Value < debt Stakeholder confidence • Realign stakeholder interests
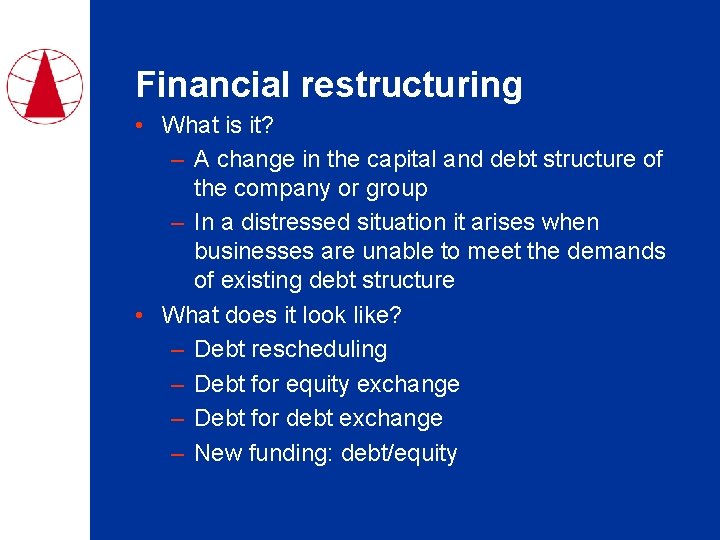
Financial restructuring • What is it? – A change in the capital and debt structure of the company or group – In a distressed situation it arises when businesses are unable to meet the demands of existing debt structure • What does it look like? – Debt rescheduling – Debt for equity exchange – Debt for debt exchange – New funding: debt/equity
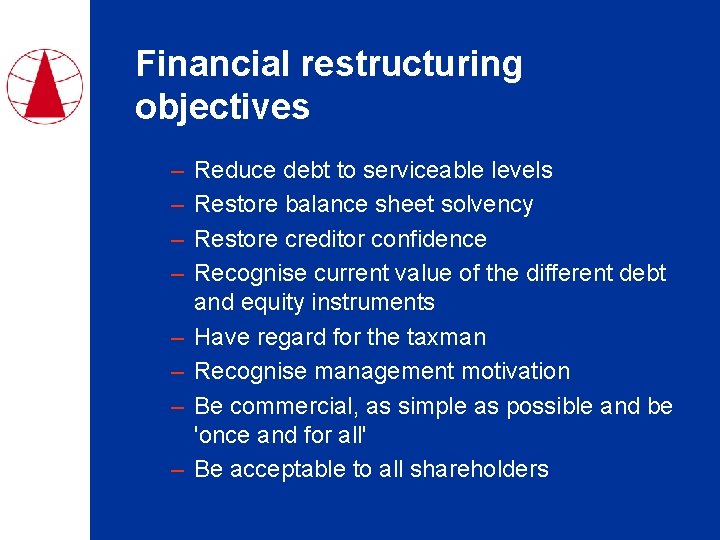
Financial restructuring objectives – – – – Reduce debt to serviceable levels Restore balance sheet solvency Restore creditor confidence Recognise current value of the different debt and equity instruments Have regard for the taxman Recognise management motivation Be commercial, as simple as possible and be 'once and for all' Be acceptable to all shareholders
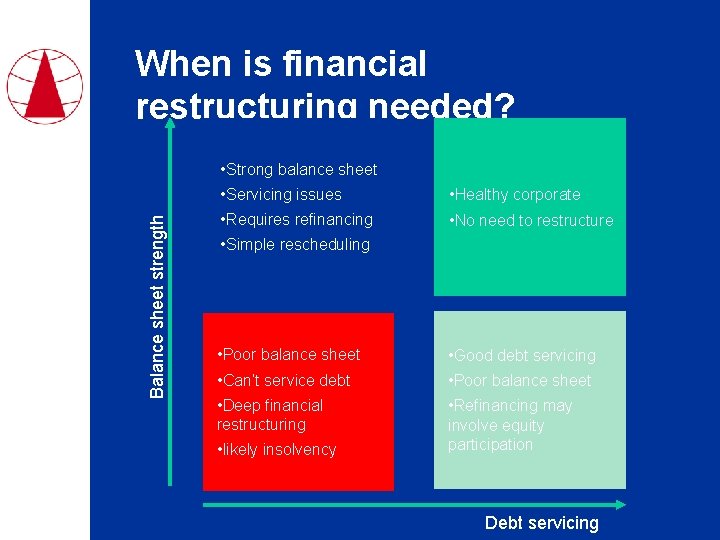
When is financial restructuring needed? Balance sheet strength • Strong balance sheet • Servicing issues • Healthy corporate • Requires refinancing • No need to restructure • Simple rescheduling • Poor balance sheet • Good debt servicing • Can’t service debt • Poor balance sheet • Deep financial restructuring • Refinancing may involve equity participation • likely insolvency Debt servicing
Agenda – The restructuring market – Financial information – Financial restructuring introduction – Financial restructuring roadmap – Data analysis – Financial restructuring roadmap Negotiating a solution
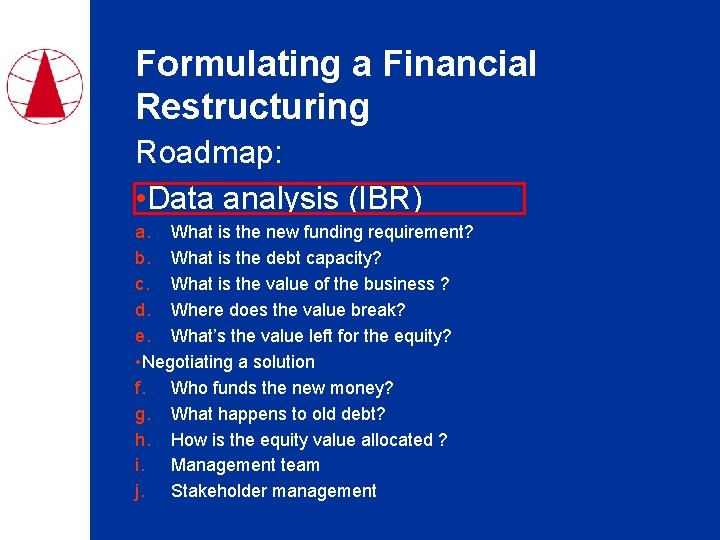
Formulating a Financial Restructuring Roadmap: • Data analysis (IBR) a. What is the new funding requirement? b. What is the debt capacity? c. What is the value of the business ? d. Where does the value break? e. What’s the value left for the equity? • Negotiating a solution f. Who funds the new money? g. What happens to old debt? h. How is the equity value allocated ? i. Management team j. Stakeholder management
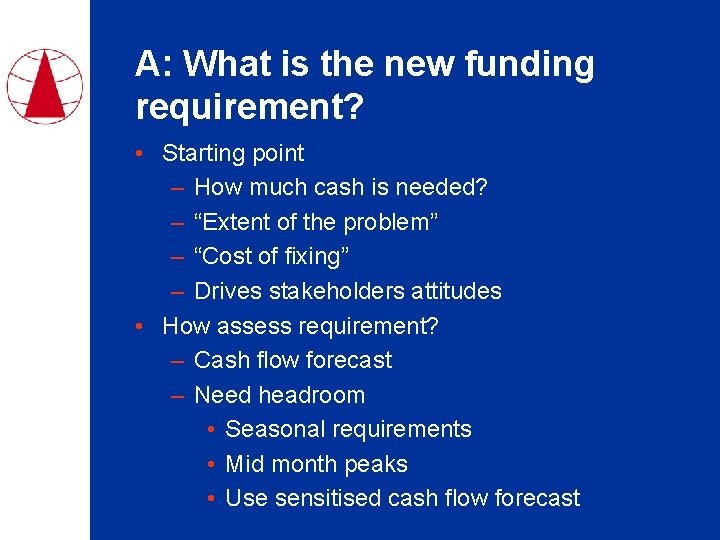
A: What is the new funding requirement? • Starting point – How much cash is needed? – “Extent of the problem” – “Cost of fixing” – Drives stakeholders attitudes • How assess requirement? – Cash flow forecast – Need headroom • Seasonal requirements • Mid month peaks • Use sensitised cash flow forecast
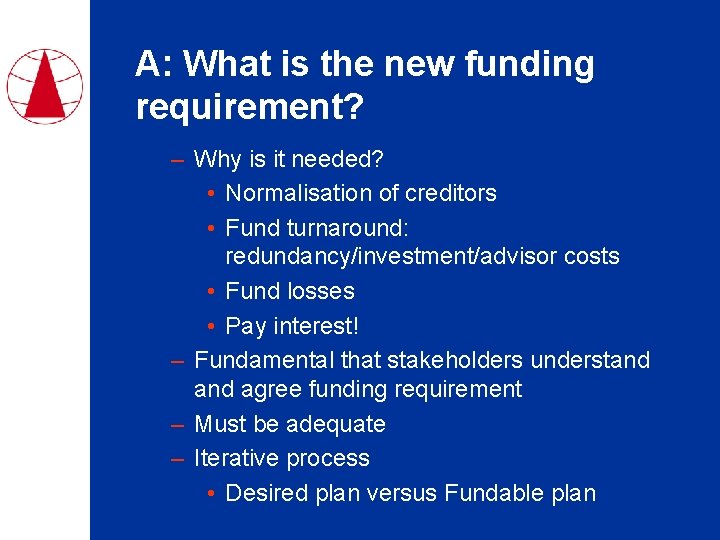
A: What is the new funding requirement? – Why is it needed? • Normalisation of creditors • Fund turnaround: redundancy/investment/advisor costs • Fund losses • Pay interest! – Fundamental that stakeholders understand agree funding requirement – Must be adequate – Iterative process • Desired plan versus Fundable plan
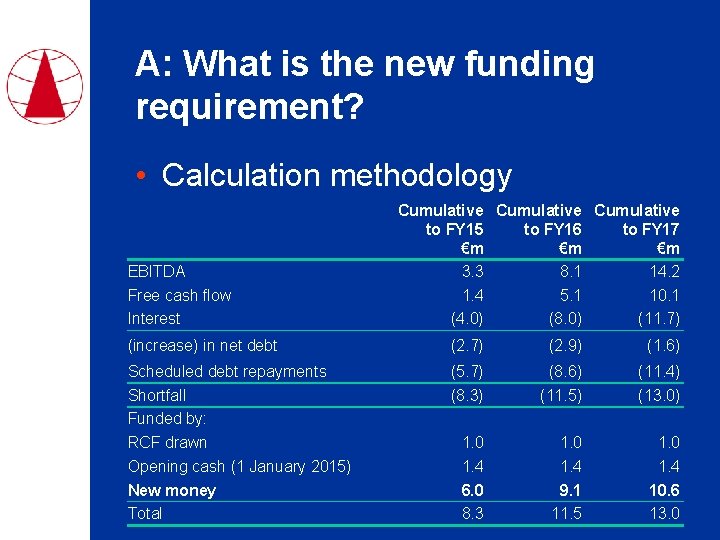
A: What is the new funding requirement? • Calculation methodology EBITDA Free cash flow Interest Cumulative to FY 15 to FY 16 to FY 17 €m €m €m 3. 3 8. 1 14. 2 1. 4 5. 1 10. 1 (4. 0) (8. 0) (11. 7) (increase) in net debt (2. 7) (2. 9) (1. 6) Scheduled debt repayments Shortfall Funded by: RCF drawn Opening cash (1 January 2015) New money Total (5. 7) (8. 3) (8. 6) (11. 5) (11. 4) (13. 0) 1. 0 1. 4 6. 0 8. 3 1. 0 1. 4 9. 1 11. 5 1. 0 1. 4 10. 6 13. 0
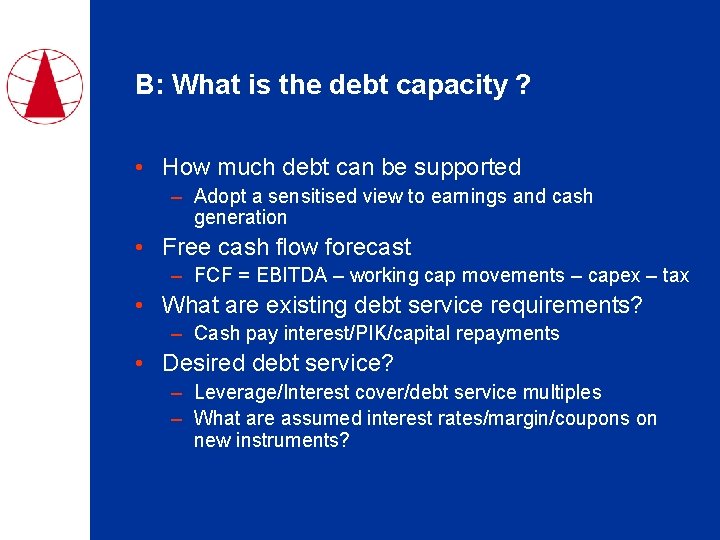
B: What is the debt capacity ? • How much debt can be supported – Adopt a sensitised view to earnings and cash generation • Free cash flow forecast – FCF = EBITDA – working cap movements – capex – tax • What are existing debt service requirements? – Cash pay interest/PIK/capital repayments • Desired debt service? – Leverage/Interest cover/debt service multiples – What are assumed interest rates/margin/coupons on new instruments?
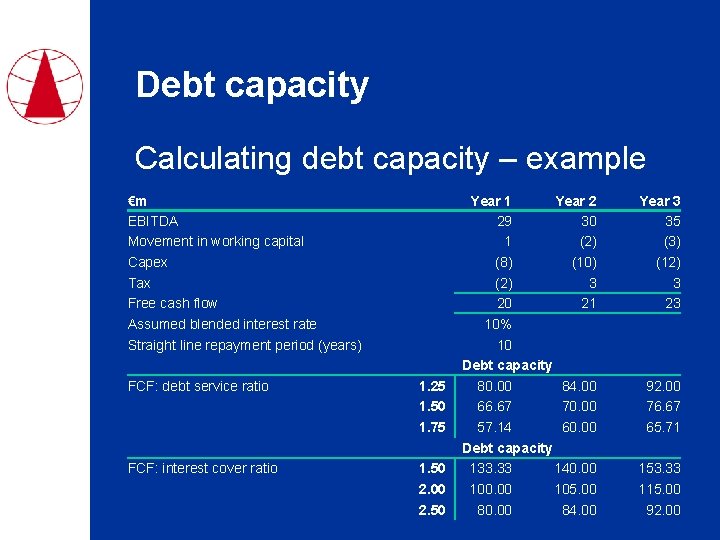
Debt capacity Calculating debt capacity – example €m EBITDA Movement in working capital Capex Tax Free cash flow Assumed blended interest rate Straight line repayment period (years) FCF: debt service ratio 1. 25 1. 50 1. 75 FCF: interest cover ratio 1. 50 2. 00 2. 50 Year 1 Year 2 29 30 1 (2) (8) (10) (2) 3 20 21 10% 10 Debt capacity 80. 00 84. 00 66. 67 70. 00 57. 14 60. 00 Debt capacity 133. 33 140. 00 105. 00 80. 00 84. 00 Year 3 35 (3) (12) 3 23 92. 00 76. 67 65. 71 153. 33 115. 00 92. 00
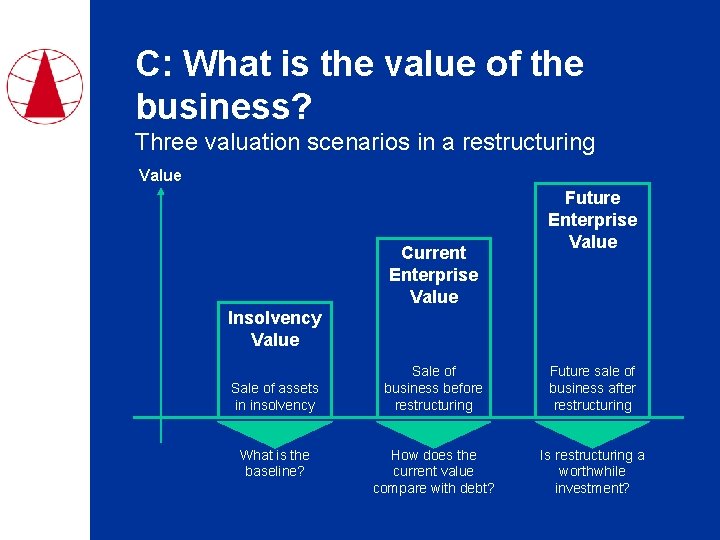
C: What is the value of the business? Three valuation scenarios in a restructuring Value Current Enterprise Value Future Enterprise Value Insolvency Value Sale of assets in insolvency What is the baseline? Sale of business before restructuring Future sale of business after restructuring How does the current value compare with debt? Is restructuring a worthwhile investment?
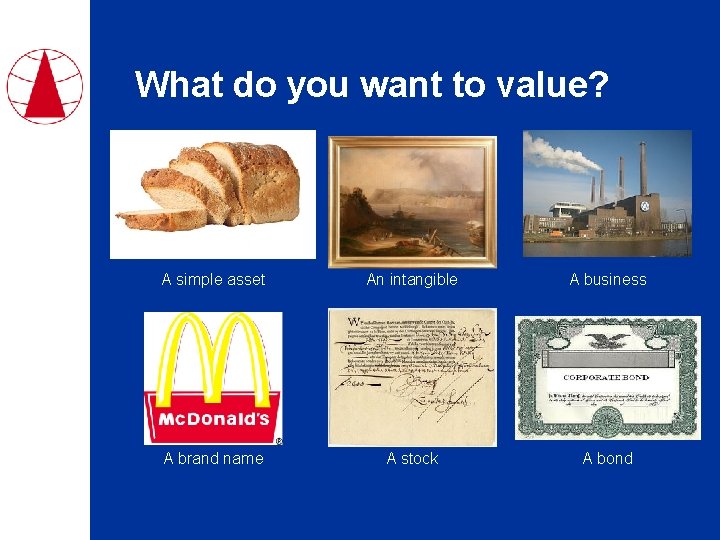
What do you want to value? A simple asset An intangible A business A brand name A stock A bond
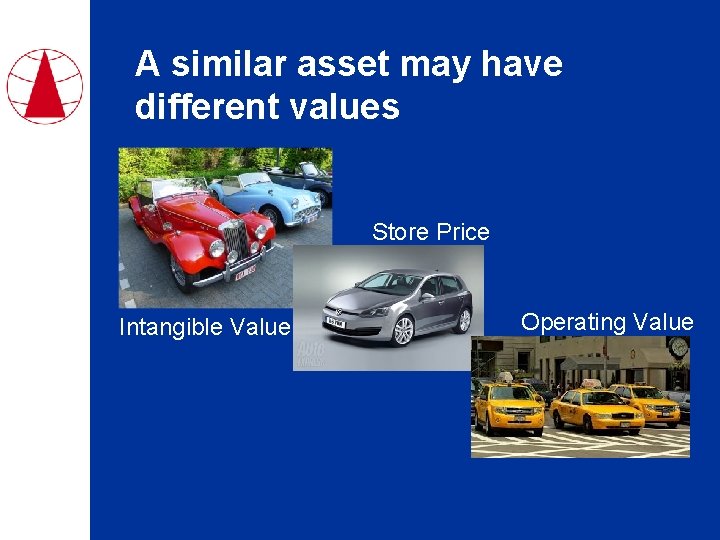
A similar asset may have different values Store Price Intangible Value Operating Value
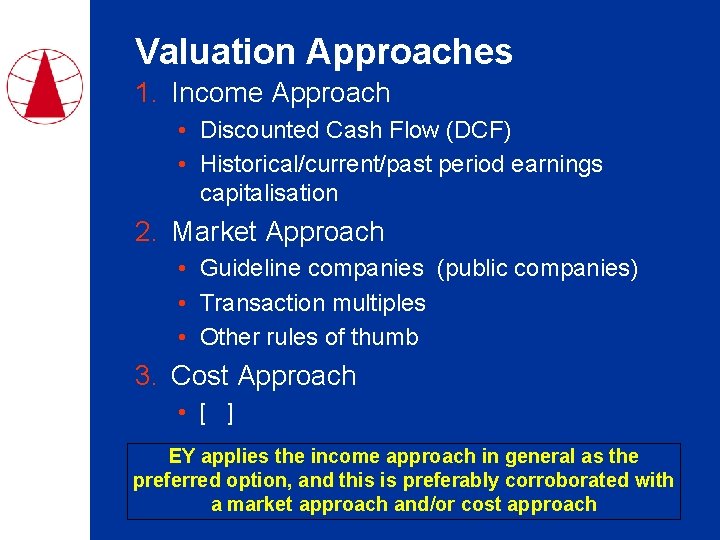
Valuation Approaches 1. Income Approach • Discounted Cash Flow (DCF) • Historical/current/past period earnings capitalisation 2. Market Approach • Guideline companies (public companies) • Transaction multiples • Other rules of thumb 3. Cost Approach • [ ] EY applies the income approach in general as the preferred option, and this is preferably corroborated with a market approach and/or cost approach
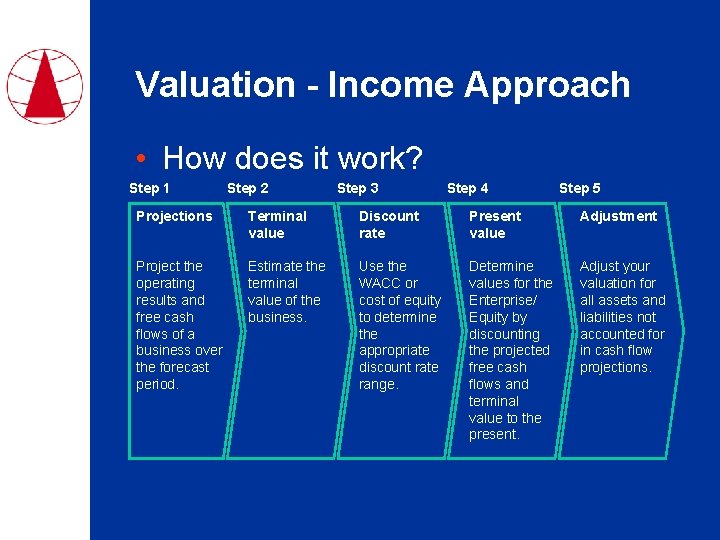
Valuation - Income Approach • How does it work? Step 1 Step 2 Step 3 Step 4 Step 5 Projections Terminal value Discount rate Present value Adjustment Project the operating results and free cash flows of a business over the forecast period. Estimate the terminal value of the business. Use the WACC or cost of equity to determine the appropriate discount rate range. Determine values for the Enterprise/ Equity by discounting the projected free cash flows and terminal value to the present. Adjust your valuation for all assets and liabilities not accounted for in cash flow projections.
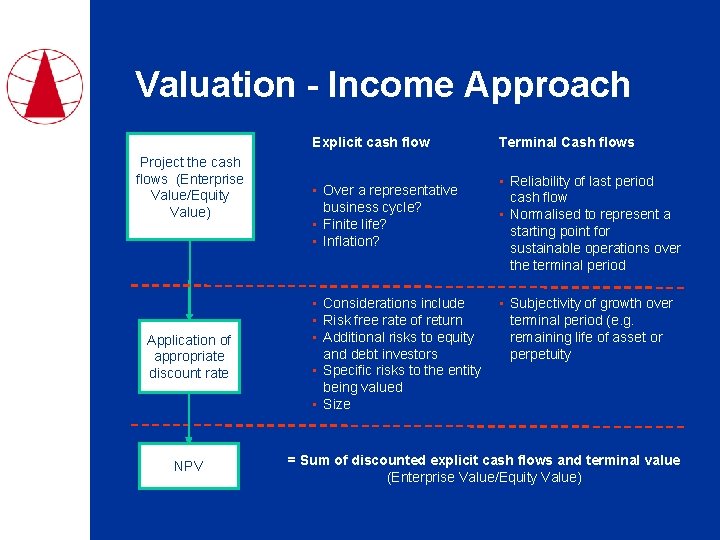
Valuation - Income Approach = Project the cash flows (Enterprise Value/Equity Value) Application of appropriate discount rate NPV Explicit cash flow + • Over a representative business cycle? • Finite life? • Inflation? • Considerations include • Risk free rate of return • Additional risks to equity and debt investors • Specific risks to the entity being valued • Size Terminal Cash flows • Reliability of last period cash flow • Normalised to represent a starting point for sustainable operations over the terminal period • Subjectivity of growth over terminal period (e. g. remaining life of asset or perpetuity = Sum of discounted explicit cash flows and terminal value (Enterprise Value/Equity Value)
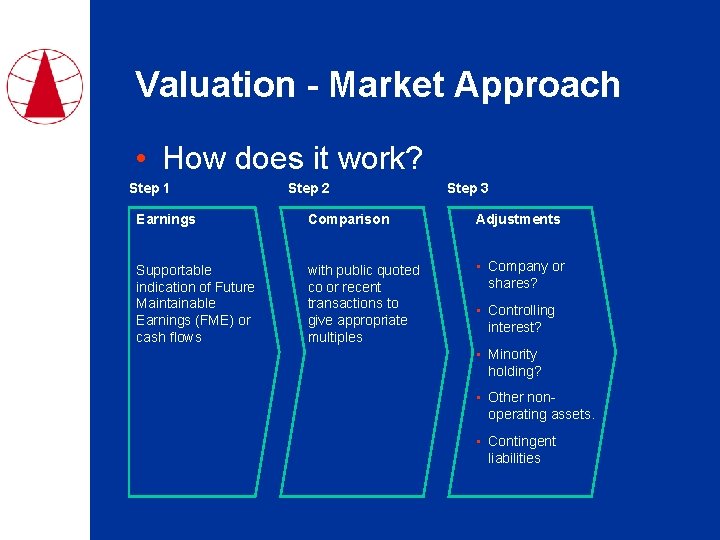
Valuation - Market Approach • How does it work? Step 1 Step 2 Step 3 Earnings Comparison Adjustments Supportable indication of Future Maintainable Earnings (FME) or cash flows with public quoted co or recent transactions to give appropriate multiples • Company or shares? • Controlling interest? • Minority holding? • Other nonoperating assets. • Contingent liabilities
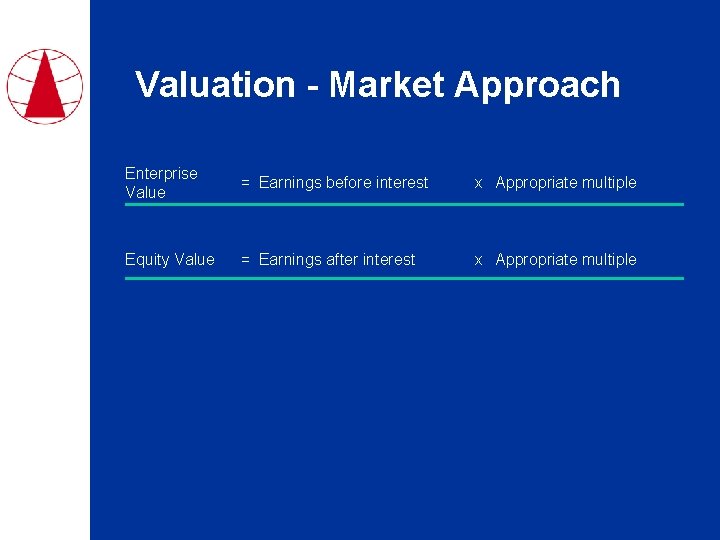
Valuation - Market Approach Enterprise Value = Earnings before interest x Appropriate multiple Equity Value = Earnings after interest x Appropriate multiple
Valuation - Market approach • Considerations – Determination of Future Maintainable Earnings is a matter of professional judgement, having regard to the following: • Activities and value drivers of the business • Position and potential of the business in comparison to listed comparable companies or transactions • Company track record in achieving its forecasts • Reasonableness of the forecasts and consistency with your understanding of the business and market • Is management capable of delivering the expected profits? • Consideration of business life cycle

Valuation - Asset based approach – Generally assets are worth no more than the earnings/cash flow they are capable of generating. – Asset based approach used when earnings are insufficient to justify a value more than net tangible assets – Always a factor in valuation – provides a frame of reference for main valuations • Going concern: – Assumes a company will continue to trade – Requires determination of market value of assets and liabilities – May require elimination of intangible assets if earnings not justifiable
Valuation - What is the position on an insolvent basis? – What are the assets worth on an insolvency? – Range of asset based valuations • Sale of business as an insolvency • Liquidation value – Requires valuation/insolvency skills and experience – Lower than enterprise value since assets are written down, liabilities crystallised and costs incurred
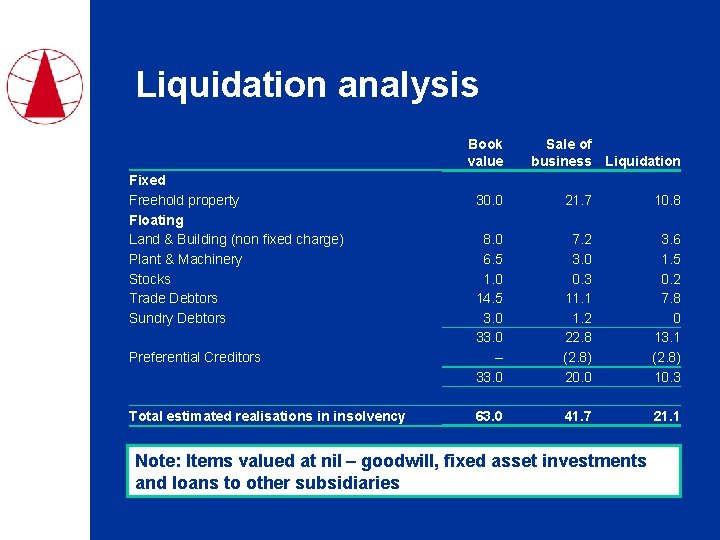
Liquidation analysis Book value Fixed Freehold property Floating Land & Building (non fixed charge) Plant & Machinery Stocks Trade Debtors Sundry Debtors Preferential Creditors Total estimated realisations in insolvency Sale of business Liquidation 30. 0 21. 7 10. 8 8. 0 6. 5 1. 0 14. 5 3. 0 33. 0 – 33. 0 7. 2 3. 0 0. 3 11. 1 1. 2 22. 8 (2. 8) 20. 0 3. 6 1. 5 0. 2 7. 8 0 13. 1 (2. 8) 10. 3 63. 0 41. 7 21. 1 Note: Items valued at nil – goodwill, fixed asset investments and loans to other subsidiaries
Where does money go on insolvency? – Based on: • Legal structure • Legislation • Security position • Intercompany debt structure – Must be undertaken on a legal entity basis – In a large group structure with multistakeholders, this can be a very complex exercise requiring sophisticated modelling. • Arguably the single most powerful tool in complex restructuring
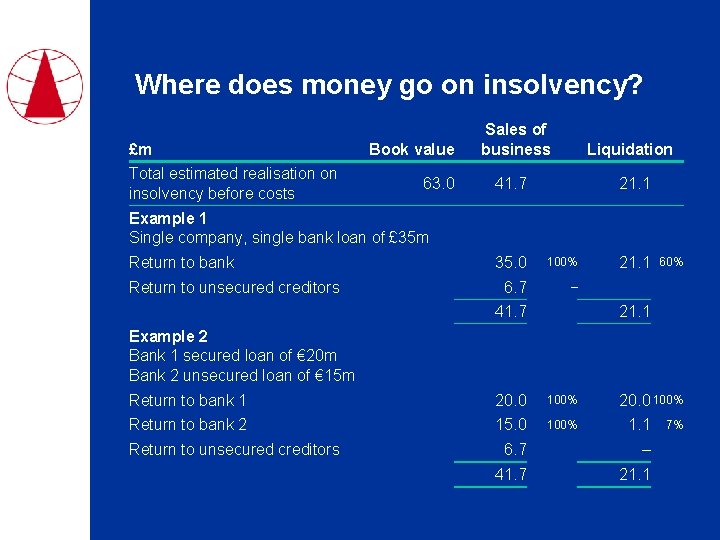
Where does money go on insolvency? £m Total estimated realisation on insolvency before costs Book value 63. 0 Sales of business Liquidation 41. 7 21. 1 Example 1 Single company, single bank loan of £ 35 m Return to bank Return to unsecured creditors 35. 0 100% 6. 7 – 41. 7 21. 1 60% 21. 1 Example 2 Bank 1 secured loan of € 20 m Bank 2 unsecured loan of € 15 m Return to bank 1 20. 0 100% Return to bank 2 15. 0 100% Return to unsecured creditors 20. 0 100% 1. 1 6. 7 – 41. 7 21. 1 7%
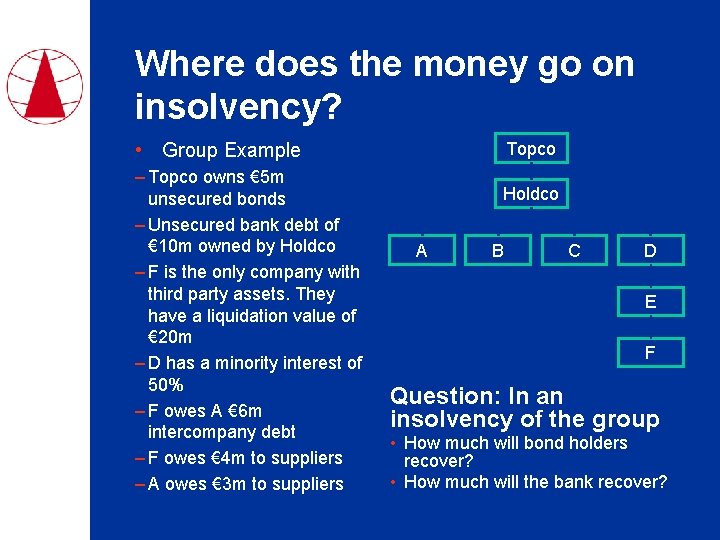
Where does the money go on insolvency? • Group Example – Topco owns € 5 m unsecured bonds – Unsecured bank debt of € 10 m owned by Holdco – F is the only company with third party assets. They have a liquidation value of € 20 m – D has a minority interest of 50% – F owes A € 6 m intercompany debt – F owes € 4 m to suppliers – A owes € 3 m to suppliers Topco Holdco A B C D E F Question: In an insolvency of the group • How much will bond holders recover? • How much will the bank recover?
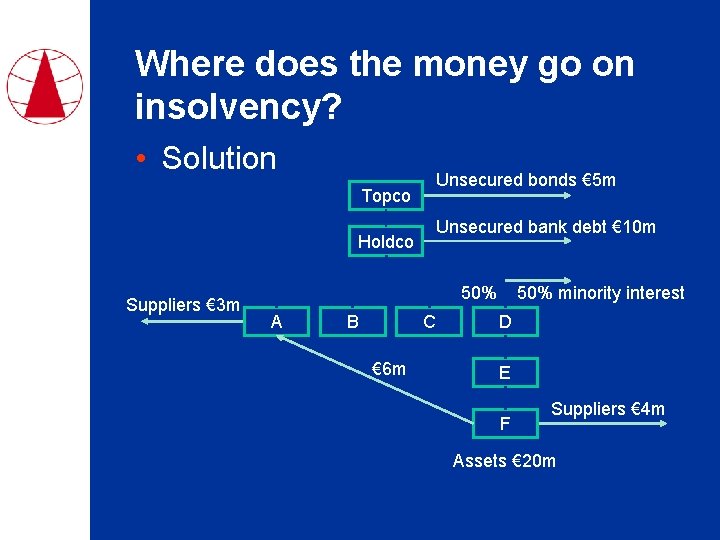
Where does the money go on insolvency? • Solution Unsecured bonds € 5 m Topco Unsecured bank debt € 10 m Holdco Suppliers € 3 m 50% A B C € 6 m 50% minority interest D E F Suppliers € 4 m Assets € 20 m
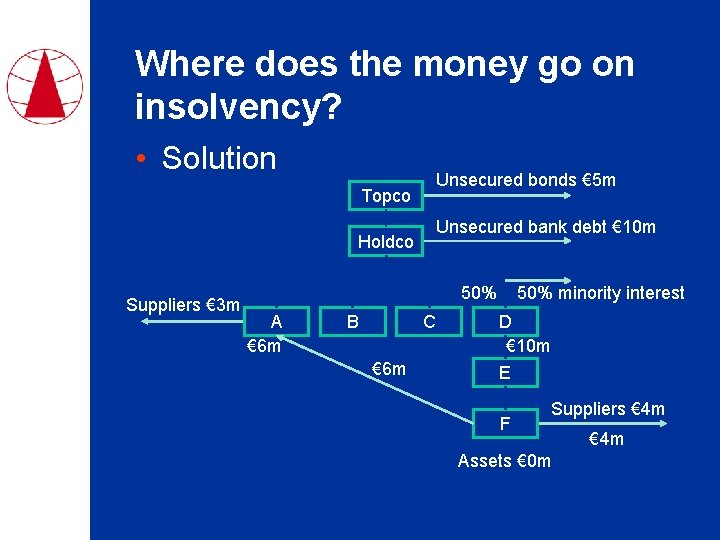
Where does the money go on insolvency? • Solution Unsecured bonds € 5 m Topco Unsecured bank debt € 10 m Holdco Suppliers € 3 m 50% A € 6 m B C € 6 m 50% minority interest D € 10 m E F Suppliers € 4 m Assets € 0 m € 4 m
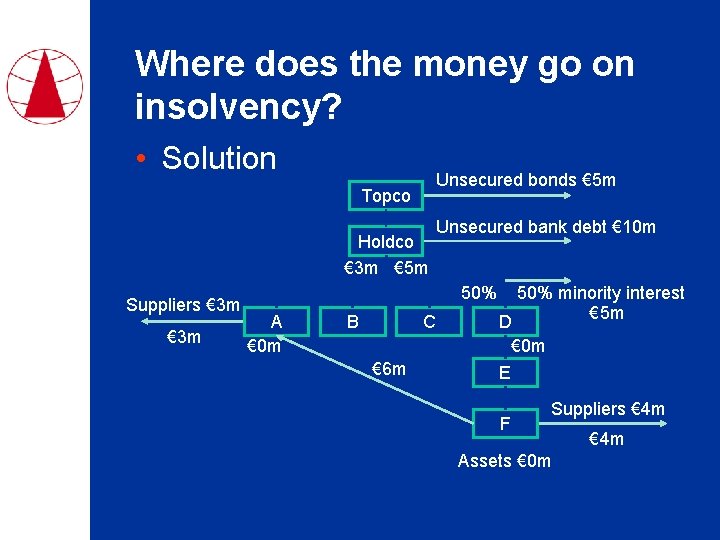
Where does the money go on insolvency? • Solution Unsecured bonds € 5 m Topco Holdco € 3 m € 5 m Suppliers € 3 m Unsecured bank debt € 10 m 50% A € 0 m B C € 6 m 50% minority interest € 5 m D € 0 m E F Suppliers € 4 m Assets € 0 m € 4 m
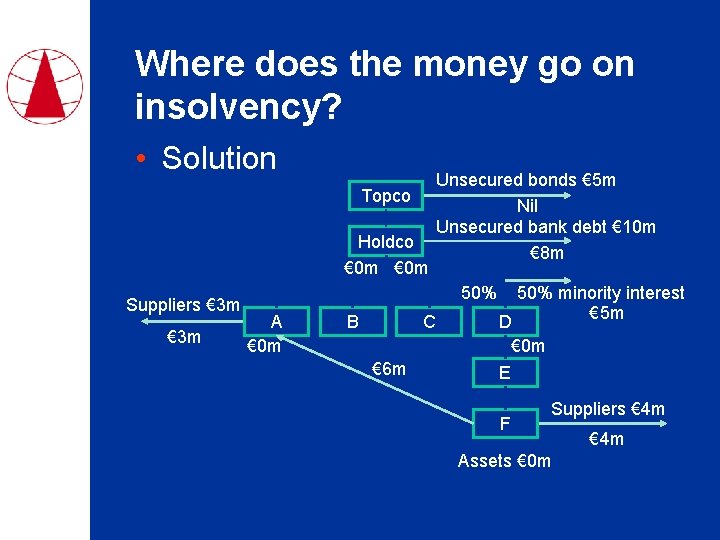
Where does the money go on insolvency? • Solution Topco Holdco € 0 m Suppliers € 3 m Unsecured bonds € 5 m Nil Unsecured bank debt € 10 m € 8 m 50% A € 0 m B C € 6 m 50% minority interest € 5 m D € 0 m E F Suppliers € 4 m Assets € 0 m € 4 m
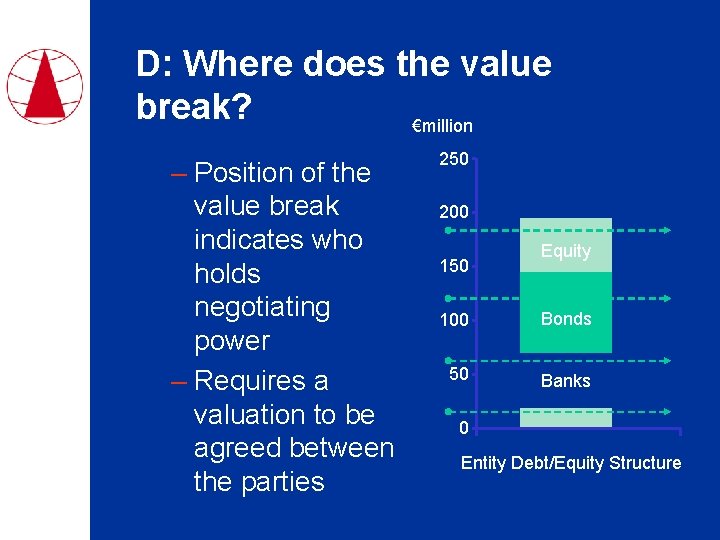
D: Where does the value break? €million – Position of the value break indicates who holds negotiating power – Requires a valuation to be agreed between the parties 250 200 150 Equity 100 Bonds 50 Banks 0 Entity Debt/Equity Structure
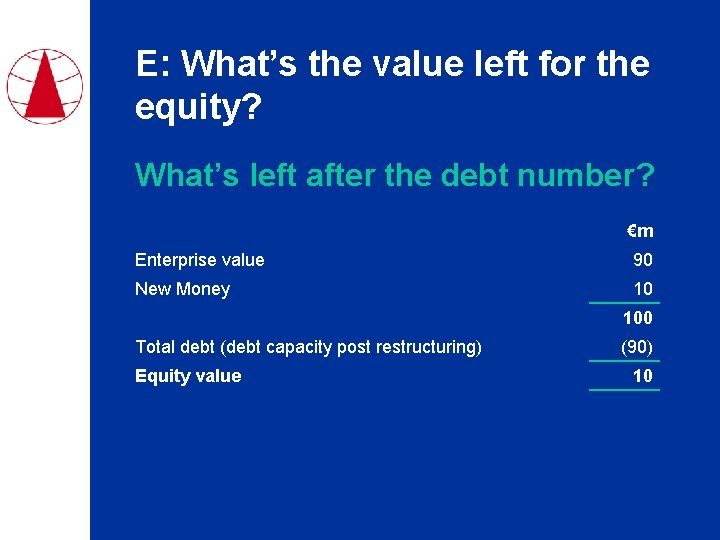
E: What’s the value left for the equity? What’s left after the debt number? €m Enterprise value 90 New Money 10 100 Total debt (debt capacity post restructuring) Equity value (90) 10
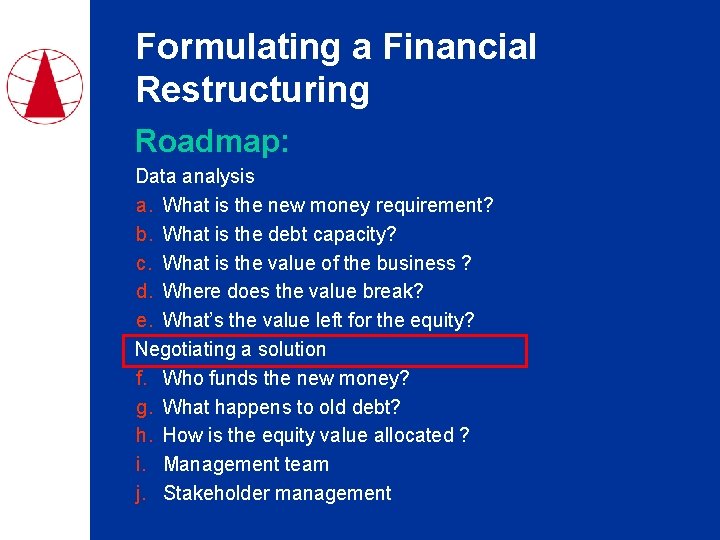
Formulating a Financial Restructuring Roadmap: Data analysis a. What is the new money requirement? b. What is the debt capacity? c. What is the value of the business ? d. Where does the value break? e. What’s the value left for the equity? Negotiating a solution f. Who funds the new money? g. What happens to old debt? h. How is the equity value allocated ? i. Management team j. Stakeholder management
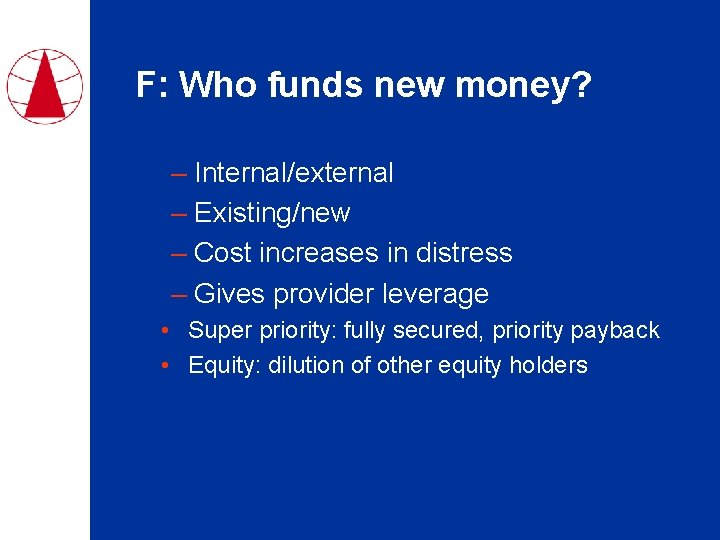
F: Who funds new money? – Internal/external – Existing/new – Cost increases in distress – Gives provider leverage • Super priority: fully secured, priority payback • Equity: dilution of other equity holders
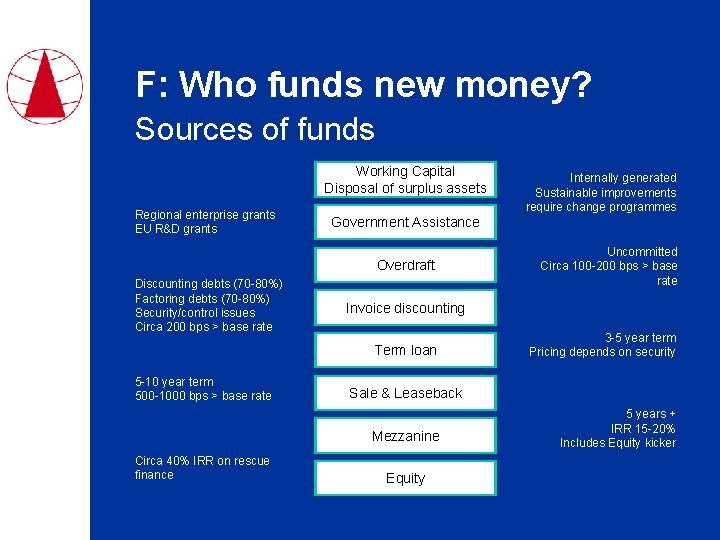
F: Who funds new money? Sources of funds Working Capital Disposal of surplus assets Regional enterprise grants EU R&D grants Government Assistance Overdraft Discounting debts (70 -80%) Factoring debts (70 -80%) Security/control issues Circa 200 bps > base rate 3 -5 year term Pricing depends on security Sale & Leaseback Mezzanine Circa 40% IRR on rescue finance Uncommitted Circa 100 -200 bps > base rate Invoice discounting Term loan 5 -10 year term 500 -1000 bps > base rate Internally generated Sustainable improvements require change programmes Equity 5 years + IRR 15 -20% Includes Equity kicker
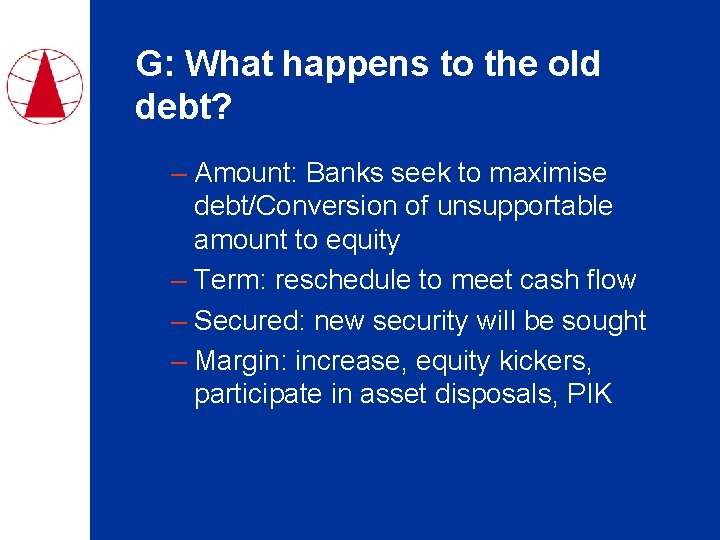
G: What happens to the old debt? – Amount: Banks seek to maximise debt/Conversion of unsupportable amount to equity – Term: reschedule to meet cash flow – Secured: new security will be sought – Margin: increase, equity kickers, participate in asset disposals, PIK
G: What happens to old debt Other considerations may include: – What other debt exists and how is it being treated – is subordinated debt also being converted or written off – Might some of future interest be PIKed to support higher debt – What are the industry norms – Belief in business and management – Negotiating starting point – Entity priority model – evaluates returns for stakeholders usually based on insolvency distribution assumptions. Can determine relative stakeholder positions Ultimately, there is no ‘right’ answer….
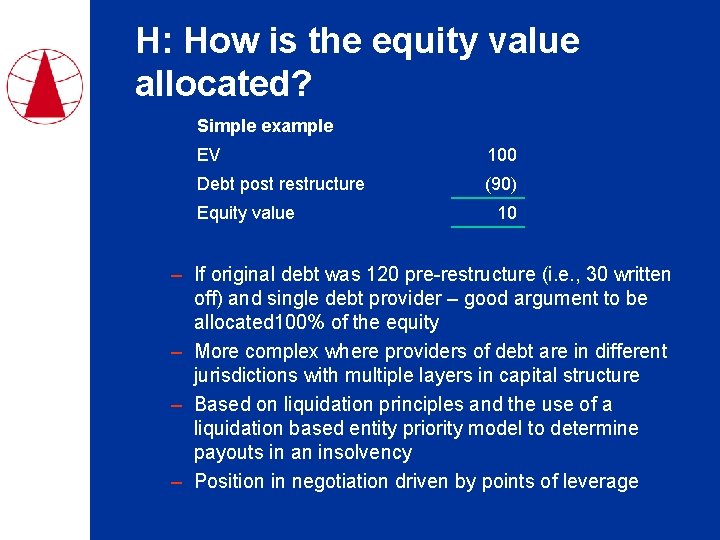
H: How is the equity value allocated? Simple example EV 100 Debt post restructure (90) Equity value 10 – If original debt was 120 pre-restructure (i. e. , 30 written off) and single debt provider – good argument to be allocated 100% of the equity – More complex where providers of debt are in different jurisdictions with multiple layers in capital structure – Based on liquidation principles and the use of a liquidation based entity priority model to determine payouts in an insolvency – Position in negotiation driven by points of leverage
H: How is equity value allocated • Other considerations: – Implications of shareholding %: • Risk of consolidation • Ability to pass resolutions/control – Need to incentivise management – Debt for equity may be accompanied by new equity from new or existing shareholders – Reputational impact as owner
H: How is equity value allocated Tax considerations – Release of debt covered by specific statutory exemption. Formal release of debt by Bank not taxable in debtor if release is in exchange for issue of ordinary shares • Care is required to ensure requirements for exemption are met and taxable waiver does not arise – wording of legal documents is important – Does this result in a change of ownership? • Impact on utilisation of tax losses going forward • Does this create/break connection with other companies in group? May have impact on group relief • Degrouping charges
H: How is the equity value allocated? – Traditional players seek to maintain the same economic result they would have had – Banks in syndicate may not have same economic position: purchased at a discount, insurance – Opportunity funds may be seeking more… e. g. , via “loan to own” – Usually simplifies to all ‘trying to get as much of the value as possible’
I: Management team – Does the current Management team have experience of a Turnaround? – Do we have confidence that they can deliver the EBITDA forecast? – Strength of Management team a key factor for the achievability of the restructuring plan
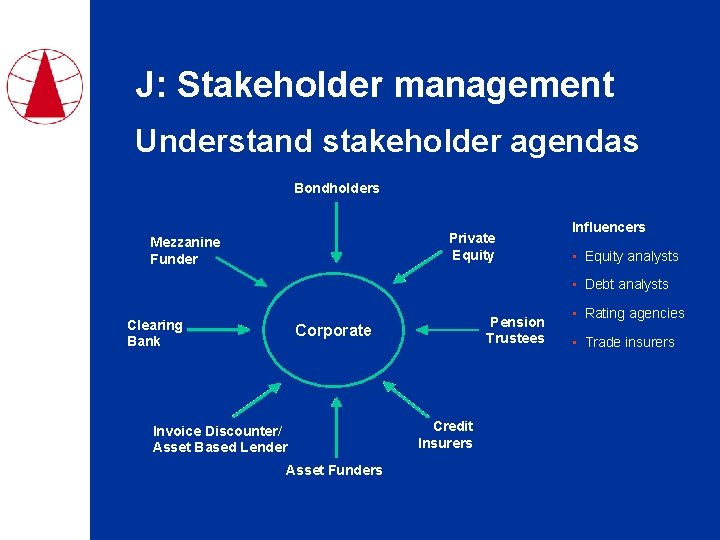
J: Stakeholder management Understand stakeholder agendas Bondholders Private Equity Mezzanine Funder Influencers • Equity analysts • Debt analysts Clearing Bank Pension Trustees Corporate Invoice Discounter/ Asset Based Lender Asset Funders Credit Insurers • Rating agencies • Trade insurers
J: Stakeholder management – Stakeholders may have hidden agendas – may hold out – A purely technical approach may allocate >100% of the equity – Need shareholder consent to the plan – Need to maintain plc status – May have additional equity provided – Management may need an incentive to see the plan through …reaching a solution may require protracted and delicate negotiations…
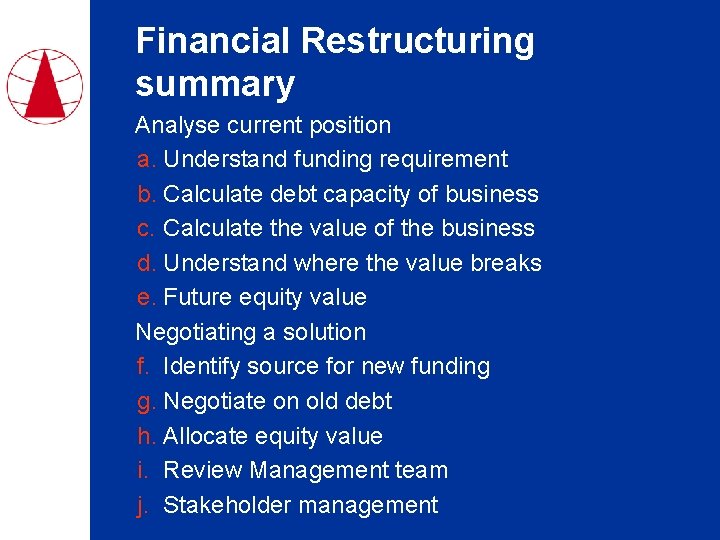
Financial Restructuring summary Analyse current position a. Understand funding requirement b. Calculate debt capacity of business c. Calculate the value of the business d. Understand where the value breaks e. Future equity value Negotiating a solution f. Identify source for new funding g. Negotiate on old debt h. Allocate equity value i. Review Management team j. Stakeholder management
Lunch Hotel Russell Restaurant
Session Nine Management and Business Failure Bob Rajan, Alvarez & Marsal, Germany Russell Downs, Pw. C, UK Prepared in consultation with Stuart Slatter
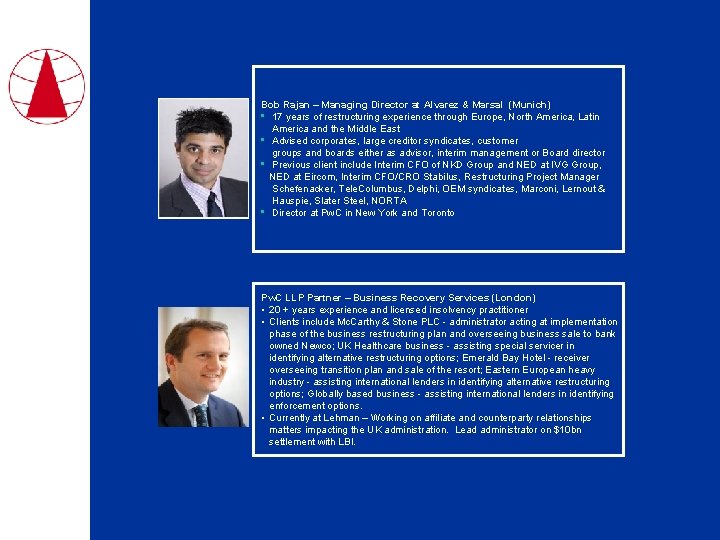
Bob Rajan – Managing Director at Alvarez & Marsal (Munich) • 17 years of restructuring experience through Europe, North America, Latin America and the Middle East • Advised corporates, large creditor syndicates, customer groups and boards either as advisor, interim management or Board director • Previous client include Interim CFO of NKD Group and NED at IVG Group, NED at Eircom, Interim CFO/CRO Stabilus, Restructuring Project Manager Schefenacker, Tele. Columbus, Delphi, OEM syndicates, Marconi, Lernout & Hauspie, Slater Steel, NORTA • Director at Pw. C in New York and Toronto Pw. C LLP Partner – Business Recovery Services (London) • 20 + years experience and licensed insolvency practitioner • Clients include Mc. Carthy & Stone PLC - administrator acting at implementation phase of the business restructuring plan and overseeing business sale to bank owned Newco; UK Healthcare business - assisting special servicer in identifying alternative restructuring options; Emerald Bay Hotel - receiver overseeing transition plan and sale of the resort; Eastern European heavy industry - assisting international lenders in identifying alternative restructuring options; Globally based business - assisting international lenders in identifying enforcement options. • Currently at Lehman – Working on affiliate and counterparty relationships matters impacting the UK administration. Lead administrator on $10 bn settlement with LBI.
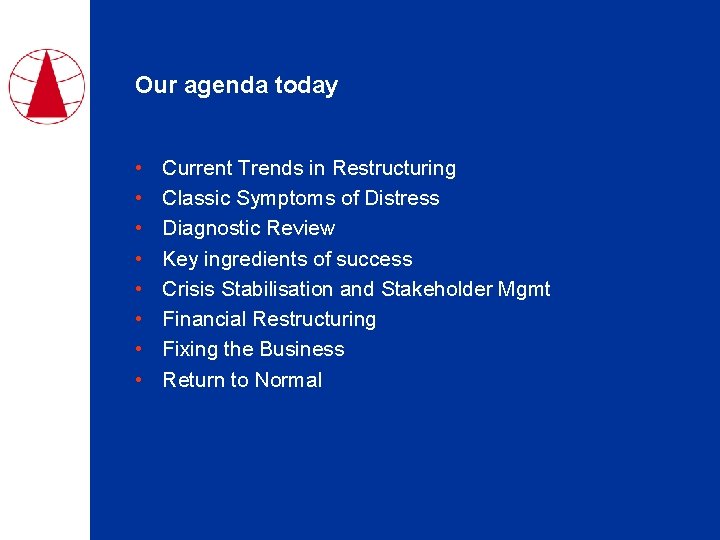
Our agenda today • • Current Trends in Restructuring Classic Symptoms of Distress Diagnostic Review Key ingredients of success Crisis Stabilisation and Stakeholder Mgmt Financial Restructuring Fixing the Business Return to Normal
Current Trends in Restructuring
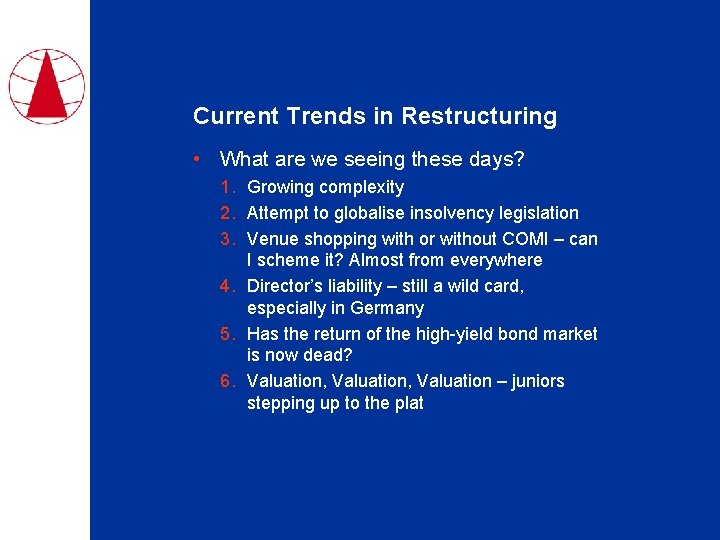
Current Trends in Restructuring • What are we seeing these days? 1. Growing complexity 2. Attempt to globalise insolvency legislation 3. Venue shopping with or without COMI – can I scheme it? Almost from everywhere 4. Director’s liability – still a wild card, especially in Germany 5. Has the return of the high-yield bond market is now dead? 6. Valuation, Valuation – juniors stepping up to the plat

Growing complexity • Restructurings today are characterised by • • • Increasing complexity Larger number of stakeholders Quickening pace in new developments Europe not so afraid now of the word ‘insolvency’ or to use as a tool What to do with the pension liabilities? • Result is more challenges to agreeing a consensual deal
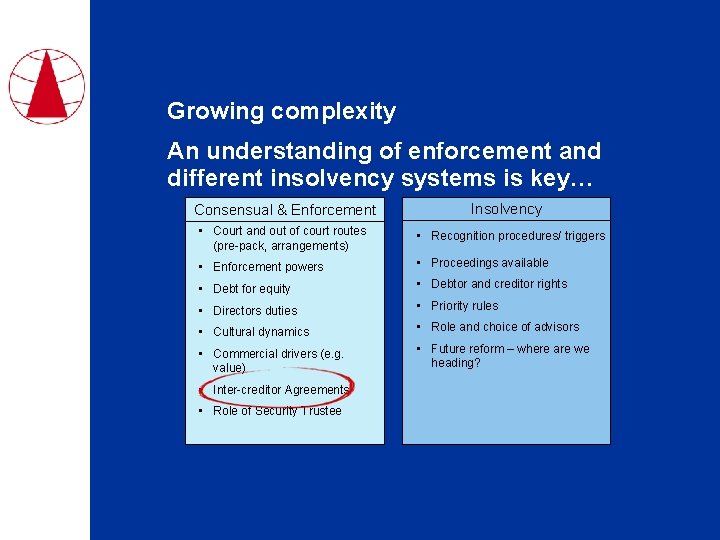
Growing complexity An understanding of enforcement and different insolvency systems is key… Consensual & Enforcement Insolvency • Court and out of court routes (pre-pack, arrangements) • Recognition procedures/ triggers • Enforcement powers • Proceedings available • Debt for equity • Debtor and creditor rights • Directors duties • Priority rules • Cultural dynamics • Role and choice of advisors • Commercial drivers (e. g. value) • Future reform – where are we heading? • Inter-creditor Agreements • Role of Security Trustee
Growing complexity …as is an understanding of a credible contingency plan • Insolvency framework and non-consensual options need to be properly understood: Ø What happens if the restructuring fails? Ø Credible Plan B – contingency planning Ø Mix and match approach Ø Salvaging value from the wreckage Ø "Best worst" outcome
Attempt to globalise legislation • Ongoing upgrading of legislation and best practice. • Is this leading to convergence? 1. 2. 3. 4. 5. US still debtor friendly but are creditors more prevalent New legislation in France, Spain and Italy Scheme anything you want through the U. K. Eastern Europe China, Middle East, others
Venue shopping • In the US (or maybe not even in the U. S. – Arcapita Bank in Bahrain) Ø Move to Delaware or Southern District of NY? • In Europe Ø By not moving COMI • • Tele. Columbus Rhodenstock Ø Move COMI (effectively company’s head office functions) • • Schefenacker Wind Hellas – moved COMI twice Ø Changing law of instruments • • Apcoa DTEK
Pre-packs not only in the U. S. • Historically used in Chapter 11 for sale of a distressed enterprise in conjunction with s. 363 sale and/or cram down • Senior-lender friendly process • Often used in conjunction with So. A in U. K. (see next slide) • Ireland – Examinership process with Eircom plc
Scheme anything you want… • Germany – Rodenstock, Tele. Columbus • Spain – La Seda de Barceloan SA and Cortefiel SA • Bulgaria – Bulgarian Telecommunications Company AD • Netherlands - (Nef Telecom Company) • Germany/Ireland - (Grand) • Italy - (Seat) • Kuwait - (Global Investment House K. S. C. (c)

UK – the new norm? • When all else fails, SCHEME it! • ATU – Germany deal delivered through the UK without a COMI shift • New World Resources – Netherlands based but COMI shift followed by a twin track scheme • Afren plc – Scheme • DTEK - Scheme
High yield market • U. S. professionals moving to Europe to attack high-yield market • Not really junk bonds anymore • Real viable refinancing solution • Mostly governed by NY law • Will moving COMI shifting come back? • How to restructure?
Innovative Financial Instruments • In recent economic crisis, some senior banks are unwilling or unable to perform debt-for-equity swaps Ø Ø Ø Use of Trust Structure Risk of equitable subordination Inability of senior banks to write-off debt • Use of hybrid financial instruments 1. 2. Stabilus Gmb. H – external de-leveraging Tele. Columbus Gmb. H – for tax purposes
Valuation, Valuation • In the U. S. , valuation typically drives a restructuring • Until recently, there was not much of a ‘turnaround culture’ in other jurisdictions • Due to LBO bubble bursting, several junior creditors are now out-of-the-money • Introduction of distressed investors – is this good for restructuring or adding fuel to the fire? • Where does the value break? 1. 2. IMO Car Wash Stabilus Gmb. H
Classic Symptoms of Distress
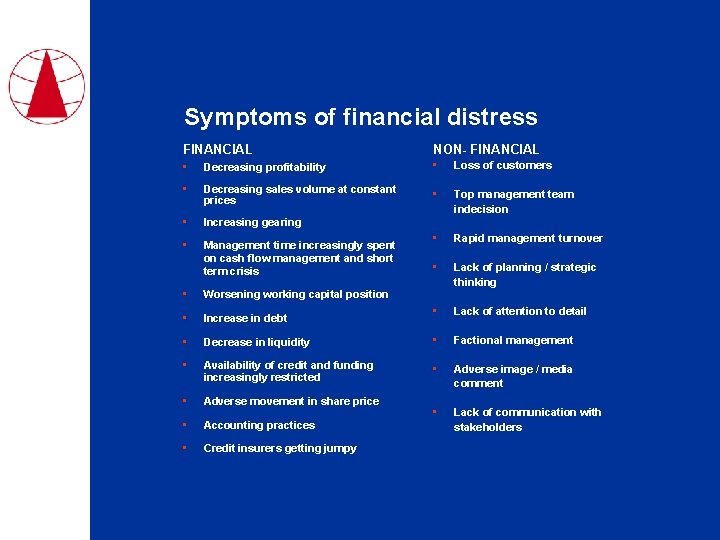
Symptoms of financial distress FINANCIAL NON- FINANCIAL • Decreasing profitability • Loss of customers • Decreasing sales volume at constant prices • Top management team indecision • Increasing gearing • Management time increasingly spent on cash flow management and short term crisis • Rapid management turnover • Lack of planning / strategic thinking • Lack of attention to detail • Worsening working capital position • Increase in debt • Decrease in liquidity • Factional management • Availability of credit and funding increasingly restricted • Adverse image / media comment • Adverse movement in share price • Accounting practices • Lack of communication with stakeholders • Credit insurers getting jumpy
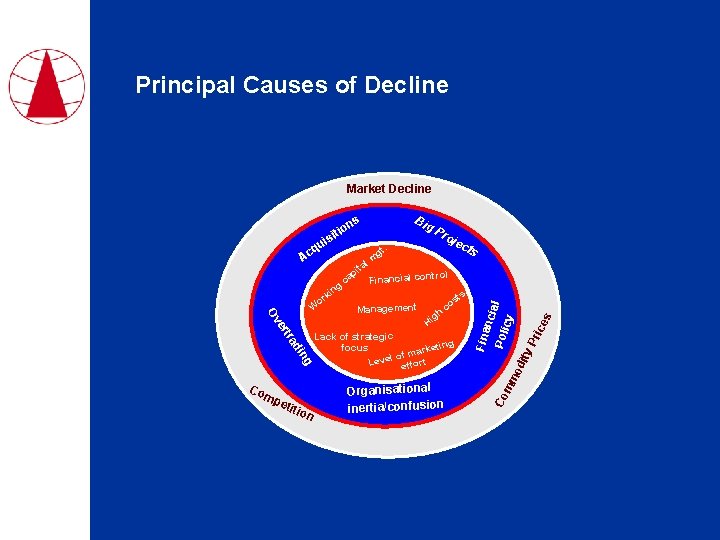
Principal Causes of Decline Market Decline Big ns o iti s ui etit ion rol Financial cont Organisational inertia/confusion es ric y. P Lack of strategic ing focus arket m f o l Leve effort od it Hi s st mm gh co ncia l Poli cy Management Co g in ad rtr e Ov mp ca Fina ng ki or Co cts lm ta pi W oje . gt cq A Pr
Diagnostic review
Objectives of diagnostic review • Assess whether the business can survive in the short term and the need for emergency funding • Assess long term viability • Assess options • Diagnose key problems and mix of strategies and actions needed • Assess position of key stakeholders • Preliminary assessment of management
Exercise on diagnostic review – Case Study Exercise Question #1 • What are the key issues faced by Abaco and what is the order of priority?
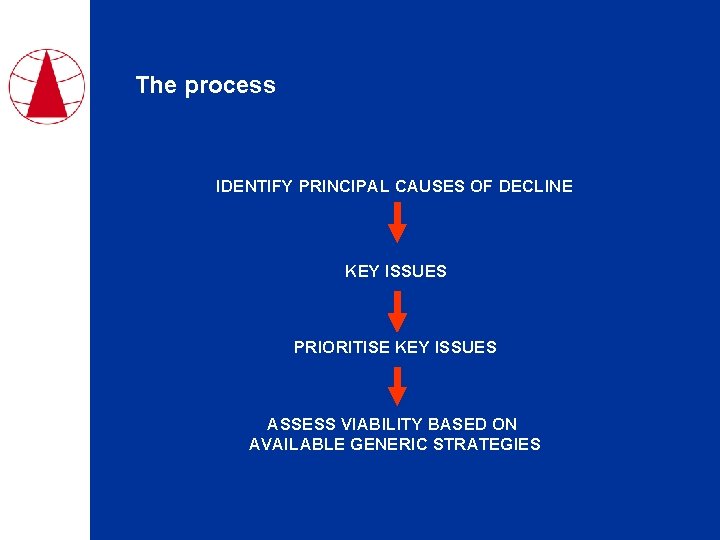
The process IDENTIFY PRINCIPAL CAUSES OF DECLINE KEY ISSUES PRIORITISE KEY ISSUES ASSESS VIABILITY BASED ON AVAILABLE GENERIC STRATEGIES
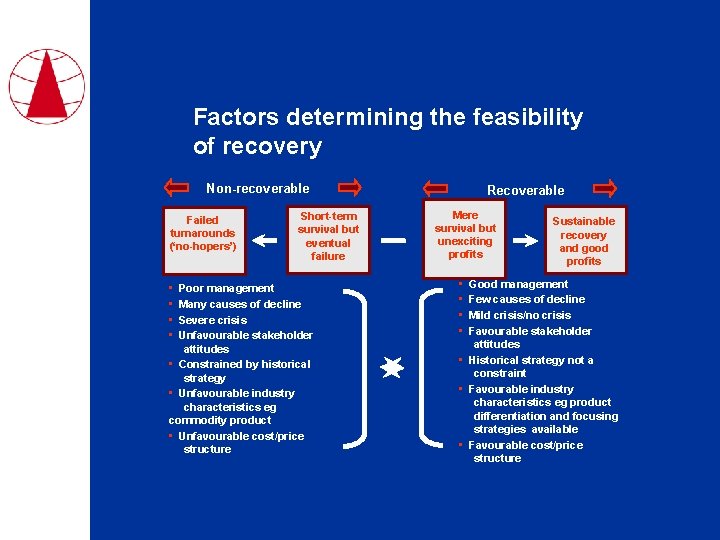
Factors determining the feasibility of recovery Non-recoverable Failed turnarounds (‘no-hopers’) • • Short-term survival but eventual failure Poor management Many causes of decline Severe crisis Unfavourable stakeholder attitudes • Constrained by historical strategy • Unfavourable industry characteristics eg commodity product • Unfavourable cost/price structure Recoverable Mere survival but unexciting profits • • Sustainable recovery and good profits Good management Few causes of decline Mild crisis/no crisis Favourable stakeholder attitudes • Historical strategy not a constraint • Favourable industry characteristics eg product differentiation and focusing strategies available • Favourable cost/price structure
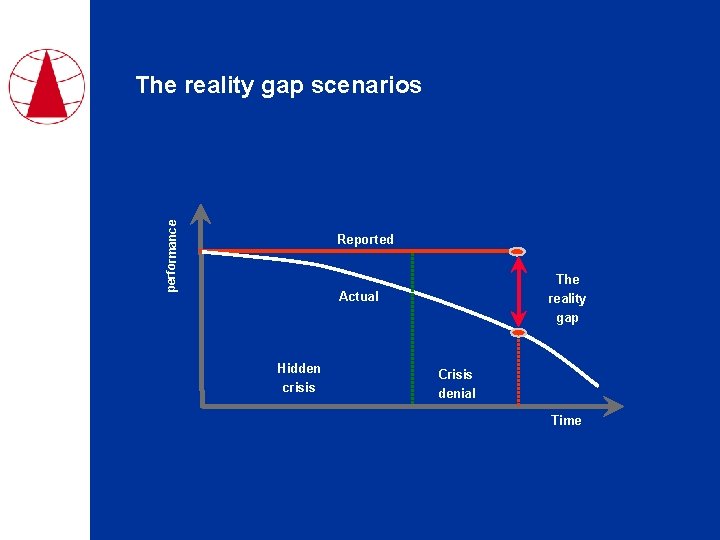
performance The reality gap scenarios Reported The reality gap Actual Hidden crisis Crisis denial Time
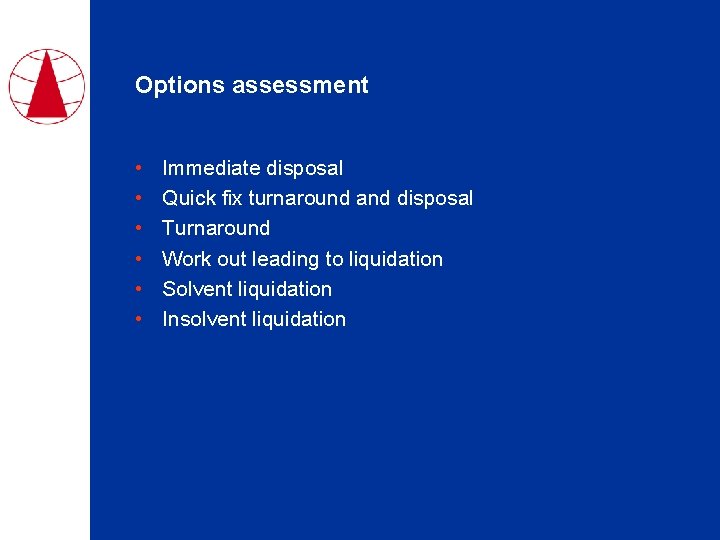
Options assessment • • • Immediate disposal Quick fix turnaround and disposal Turnaround Work out leading to liquidation Solvent liquidation Insolvent liquidation
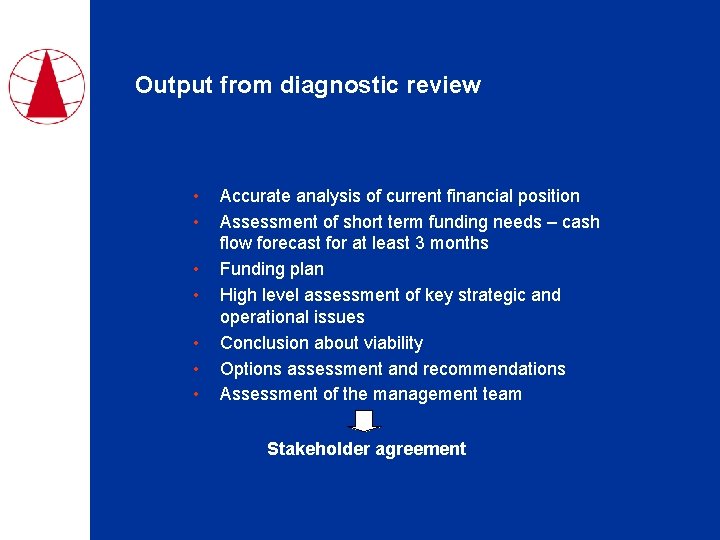
Output from diagnostic review • • Accurate analysis of current financial position Assessment of short term funding needs – cash flow forecast for at least 3 months Funding plan High level assessment of key strategic and operational issues Conclusion about viability Options assessment and recommendations Assessment of the management team Stakeholder agreement
Key ingredients of a successful turnaround

The turnaround framework CRISIS STABILISATION AND STAKEHOLDER MANAGEMENT FIXING THE BUSINESS LEADERSHIP FINANCIAL RESTRUCTURING
New leadership • • Change at the top usually required but how much? Increasing financial complexity in larger turnarounds leading to splitting of roles – CRO responsible for crisis stabilisation, stakeholder management and financial restructuring (may be also CFO) – CEO responsible for the operational turnaround
Rebuild stakeholder confidence Leadership team to turnaround the business What are you looking to achieve? Re-establish a sense of direction Achieve some early wins
Flexible Visible and hands on Good communicator Focused “Hard-nosed” What leader are you looking for? Motivational Common sense Evaluate management Evaluate Operations Clear thinker Leads by example
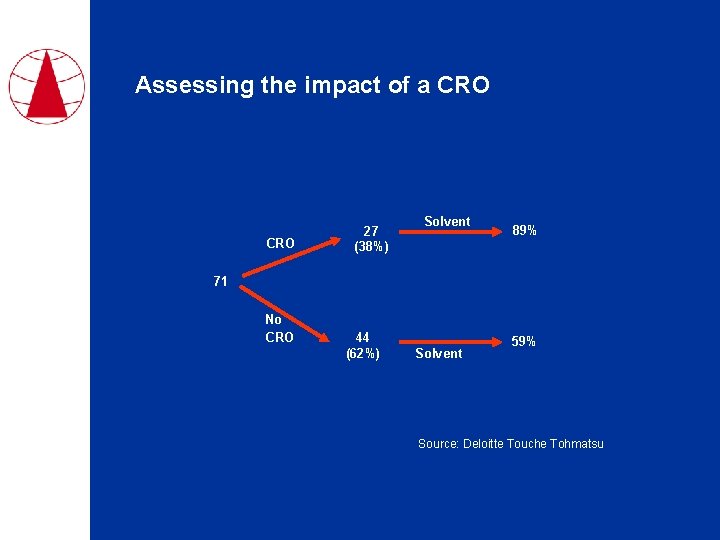
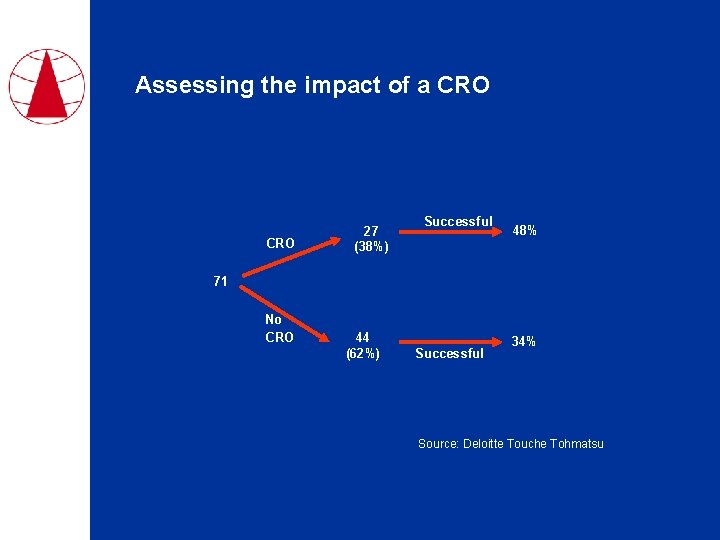
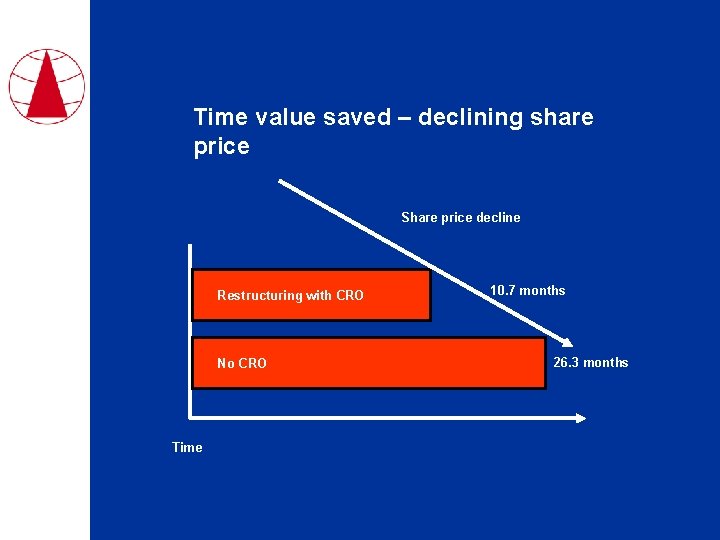
Assessing the impact of a CRO • 71 distressed entities across Europe • Analysis of the relationship between: – Companies with/without CRO; and – Share price and time
Assessing the impact of a CRO 27 (38%) Solvent 89% 71 No CRO 44 (62%) Solvent 59% Source: Deloitte Touche Tohmatsu
Assessing the impact of a CRO 27 (38%) Successful 48% 71 No CRO 44 (62%) Successful 34% Source: Deloitte Touche Tohmatsu
Time value saved – declining share price Share price decline Restructuring with CRO No CRO Time 10. 7 months 26. 3 months
Crisis Stabilisation and stakeholder management
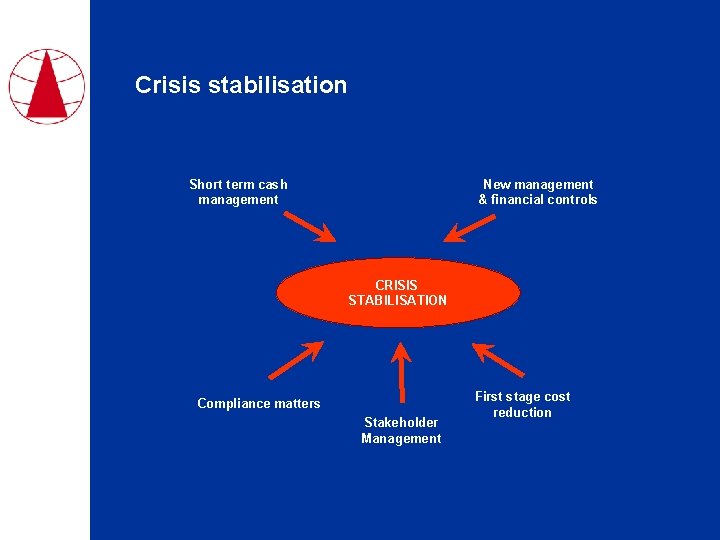
Crisis stabilisation Short term cash management New management & financial controls CRISIS STABILISATION Compliance matters Stakeholder Management First stage cost reduction
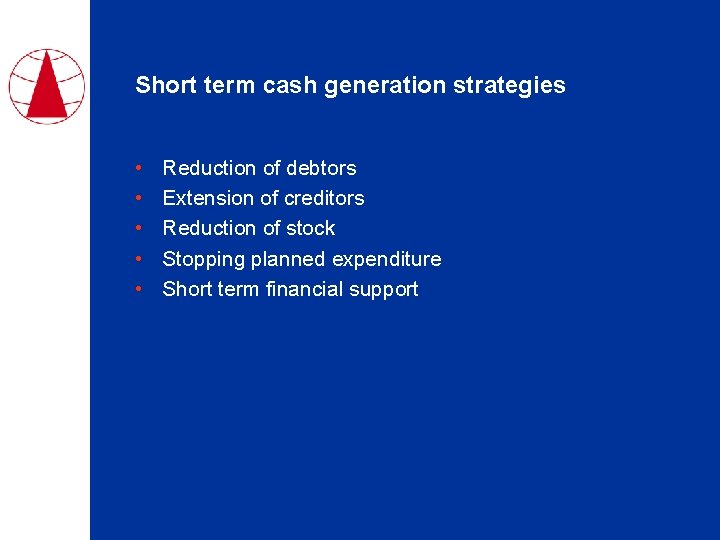
Short term cash generation strategies • • • Reduction of debtors Extension of creditors Reduction of stock Stopping planned expenditure Short term financial support
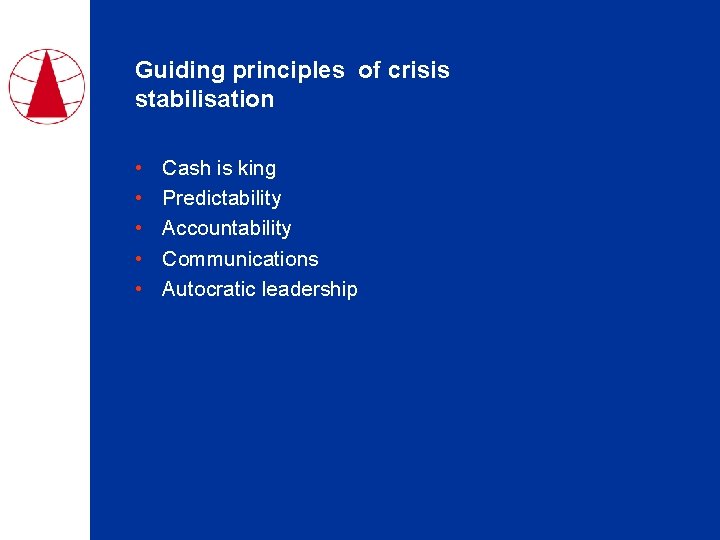
Guiding principles of crisis stabilisation • • • Cash is king Predictability Accountability Communications Autocratic leadership
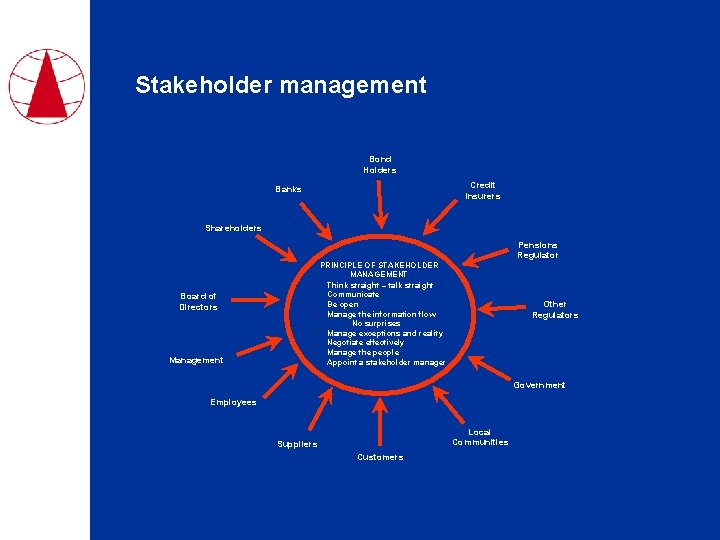
Stakeholder management Bond Holders Credit Insurers Banks Shareholders Pensions Regulator Board of Directors Management • • PRINCIPLE OF STAKEHOLDER MANAGEMENT Think straight – talk straight Communicate Be open Manage the information flow • No surprises Manage exceptions and reality Negotiate effectively Manage the people Appoint a stakeholder manager Other Regulators Government Employees Local Communities Suppliers Customers
Exercise on stakeholder management Case Study Exercise Question #2 • What is the stakeholder landscape? • Amongst this, who are the key players and what are their respective motivations?
Financial restructuring
Refinancing outside of insolvency • Refinancing is very often a two stage process – Short term survival needs – Longer term financial reorganisation • Longer term workout has to be seen as a better option than formal insolvency before financial restructuring becomes a feasible option
Fixing the business
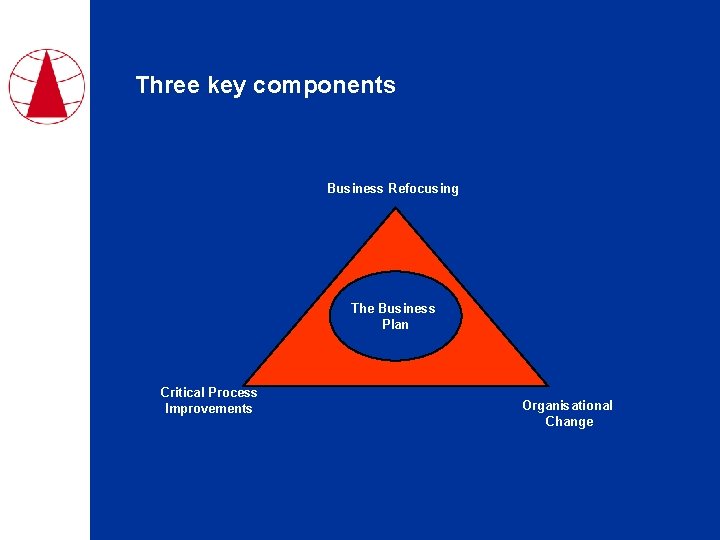
Three key components Business Refocusing The Business Plan Critical Process Improvements Organisational Change
Business refocusing • At the corporate level – exit whole businesses (divisions or operating companies) via – – divestment spin off closure insolvency • At the operating company / business unit level, it is about changing product-market focus and reducing the number of SKUs
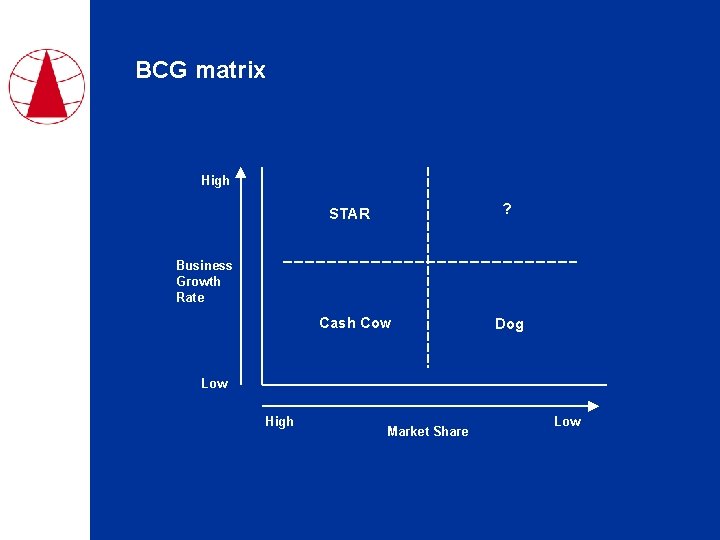
BCG matrix High ? STAR Business Growth Rate Cash Cow Dog Low High Market Share Low
Product market refocusing • Refocusing in turnaround involves – eliminating unprofitable product lines, customers and geographical territories – refocusing existing resources into product or customer segments where most short term cash can be generated • Identifying key segments involves – analysing market segment attractiveness – identifying competitive advantage / disadvantage
Most common critical process improvements • Revenue generating improvements – sales and marketing mix – key account management processes – sales force improvements – incentive schemes – pricing (raise not lower) – margin vs. revenue maximization
Most common critical process improvements • Cost cutting / performance improvements – overhead cost reduction – capacity reduction – reduction of labour cost – improvement of core production processes – machine utilization, scrap rates, workflow – reduction in number of locations – plants, offices, distribution centres, retail outlets etc. – IT effectiveness - resources, licenses, hardware
Organisational change • Key levers that can impact short term results – change key people – communication, communication ………… – introduce simple and regular performance management systems to ensure accountability (and act on underperformance) – appropriate pay / incentives – simplify organisation structure
Exercise on fixing the business Case Study Exercise Question #3 • Consider the strategic positioning of Abaco and draw up an outline o the main elements of a suitable strategy to take the company forward. • Make a proposal for an implementation mechanism which would result in the company being (majority) owned by the senior lenders and the existing debt restructured down to the level assessed in (i) above. Provide a rationale for the mechanism chosen and any other payments you might make to get the restructuring agreed.

Return to normal
Return to Normal – the Dangers • • Loosen tight controls too quickly Wrong people Over optimism about future potential Invest too much too soon Cost creep Do not build new capabilities Become complacent

Close
- Slides: 131