
Insecure and Vulnerable Work Anna Pollert University of
Insecure and Vulnerable Work Anna Pollert University of the West of England Centre for Employment Studies Research Manchester Industrial Relations Society February 18 th 2010 1
‘Success at Work: Protecting vulnerable workers, supporting good employers’ (DTI 2006). • ‘Someone working in an environment where the risk of being denied employment rights is high and who does not have the capacity or means to protect themselves from that abuse. Both factors need to be present. A worker may be susceptible to vulnerability, but that is only significant if an employer exploits that vulnerability. ’ 2
Vulnerability as Non-unionism and Low Pay • TUC (2006): non coverage by collective bargaining, bottom ⅓ income distribution = 20% UK employees or 5. 3 million • Non-union membership, earning below median* = 40% (definition for URWS) • Non-coverage by collective bargaining, earning below median = 33 ⅓% employees • *results using the ‘hourpay’ variable from the 3 rd quarter of the 2004 Labour Force Survey. • 3
TUC Commission on Vulnerable Employment • ‘Precarious work that places people at risk of continuing poverty and injustice resulting from an imbalance in the employer-worker relationship’ (2008) • Uses LFS data (2007): no qualifications, temporary workers, + working from home and earning below £ 6. 50/hour + migrant = 2 million vulnerable workers. 4
Individualised IR • Union members 55% 1979, 28% 2008. • Collective bargaining coverage: 85% mid 1970 s to 30% 2007 (20% private sector) • Free riders: 26% non-unionised 1998, 17% 2004 (WERS). • Collective conflict from 13% to 2% to 3% workplaces (WERS 1990, 1998, 2004) • ET claims 40, 000 1990 to 130, 000 2000/01. 5
Use of ET system by those with grievances • Genn (1997/98 Paths to Justice) 21% (n=287) • Pleasence et al (2006 Causes of Action: Civil Law and Social Justice ) 8% (n=165) • Casebourne et al (DTI 2006) 3% (n=435) • Pollert (2004 unorganised, low-paid survey) 2. 4% (n=501) • WERS 98 (& 2004) 10% (n is dismissals) • . 6
Who has problems at Work? • 49% problems in previous 3 years (Unrepresented Worker Survey [2004]) • 42% problems in previous 5 years (DTI 2006 survey knowledge employment rights) • Knowledge poor and/or incorrect among workers • Among employers (especially small) a ‘need to know’ basis. 7
ESRC research ‘The unorganised worker: routes to support, views on representation’. • Unrepresented Worker Survey • Telephone survey of 501 lower-paid, nonunionised workers with problems at work (2004) • Regionally representative sample. • Qualitative Research – in-depth telephone interviews with CABx clients with problems at work. • 50 workers in 3 areas: North, Midlands, London/South East 8
Insights from URWS 1. Who are low paid unorganised with problems at work? 2. Insights into non-unionism 3. What are their problems? 4. Are some workers more likely to have certain problems? 5. Are workplace procedures associated with some problems? 6. What did they do? 7. What were the outcomes? 8. Prospects for collective organisation? 9
URWS Sample (compared LFS & sub-sample low-paid, nonunionised) • 61% female (similar to sub-sample) • Young < 25 under-represented (sampling error? ) • Non-white over-represented • < 6 months service when had problem over-represented 10
Are vulnerable workers with problems more likely to work in some sectors? • Private sector more likely (same as LFS subsample). • Hotels and restaurants (same as LFS subsample) • Health and social services (higher than LFS sub-sample) • Small (< 50) workplaces (same as LFS subsample) • Medium (50 -249) (higher than sub-sample) 11
Pay • Median pay was £ 5. 77 per hour – NMW 1 Oct 2004 £ 4. 85; Development rate £ 4. 10 • Pay band quartiles of URWS sample: – 1: £ 1. 97 -£ 4. 92. – 2: £ 4. 93 -£ 5. 76. – 3: £ 5. 77 -£ 7. 20. – 4: £ 7. 21 -£ 12. 00. 12
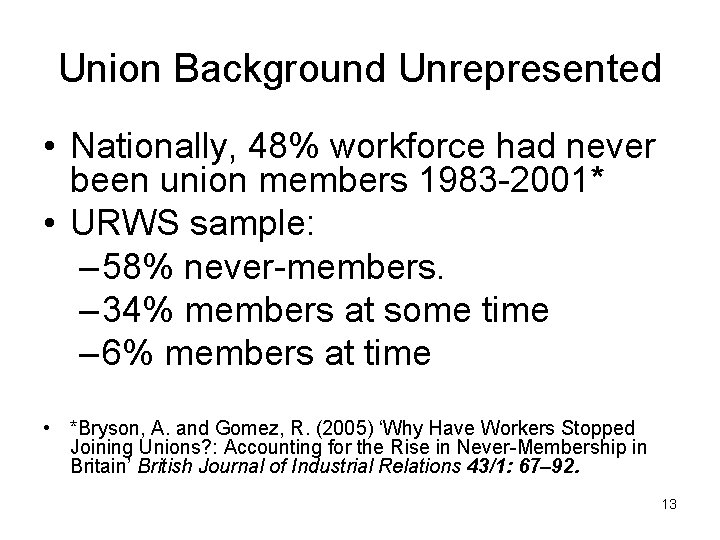
Union Background Unrepresented • Nationally, 48% workforce had never been union members 1983 -2001* • URWS sample: – 58% never-members. – 34% members at some time – 6% members at time • *Bryson, A. and Gomez, R. (2005) ‘Why Have Workers Stopped Joining Unions? : Accounting for the Rise in Never-Membership in Britain’ British Journal of Industrial Relations 43/1: 67– 92. 13
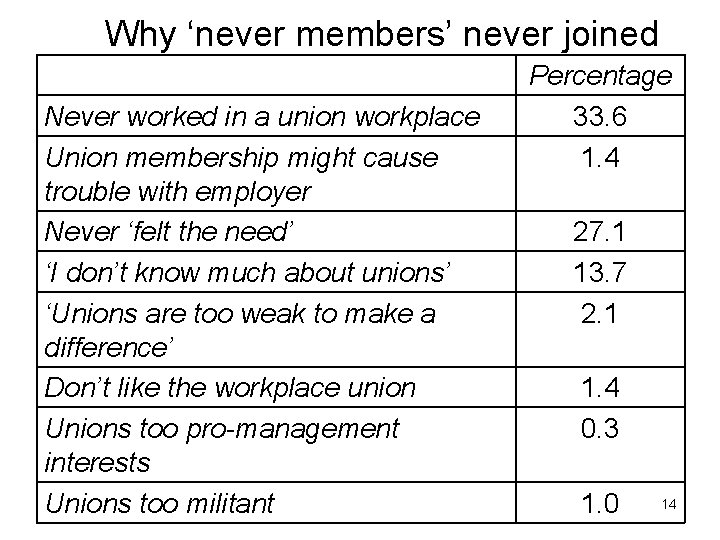
Why ‘never members’ never joined Never worked in a union workplace Union membership might cause trouble with employer Never ‘felt the need’ ‘I don’t know much about unions’ ‘Unions are too weak to make a difference’ Don’t like the workplace union Unions too pro-management interests Unions too militant Percentage 33. 6 1. 4 27. 1 13. 7 2. 1 1. 4 0. 3 1. 0 14
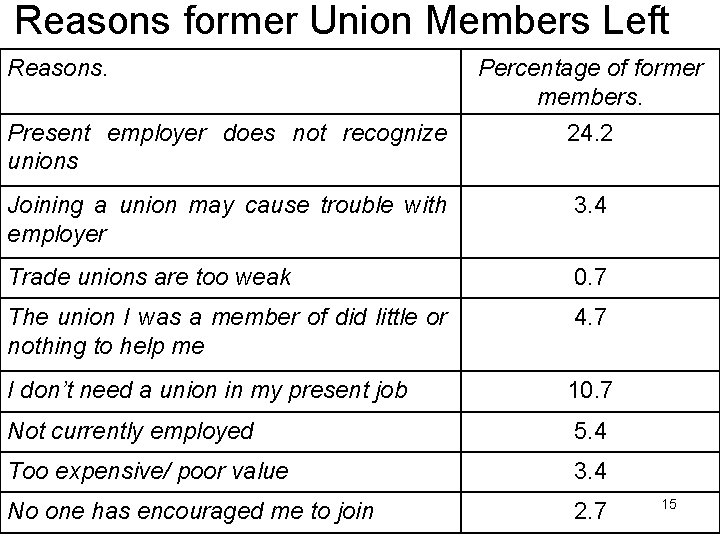
Reasons former Union Members Left Reasons. Present employer does not recognize unions Percentage of former members. 24. 2 Joining a union may cause trouble with employer 3. 4 Trade unions are too weak 0. 7 The union I was a member of did little or nothing to help me 4. 7 I don’t need a union in my present job 10. 7 Not currently employed 5. 4 Too expensive/ poor value 3. 4 No one has encouraged me to join 2. 7 15
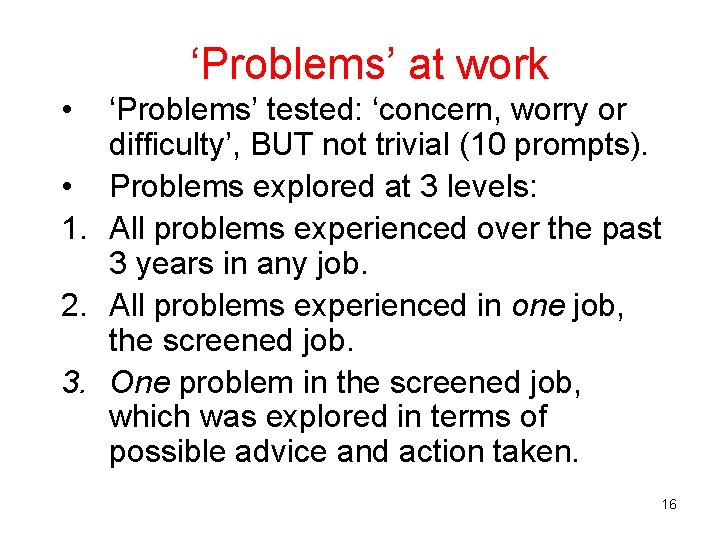
‘Problems’ at work • ‘Problems’ tested: ‘concern, worry or difficulty’, BUT not trivial (10 prompts). • Problems explored at 3 levels: 1. All problems experienced over the past 3 years in any job. 2. All problems experienced in one job, the screened job. 3. One problem in the screened job, which was explored in terms of possible advice and action taken. 16
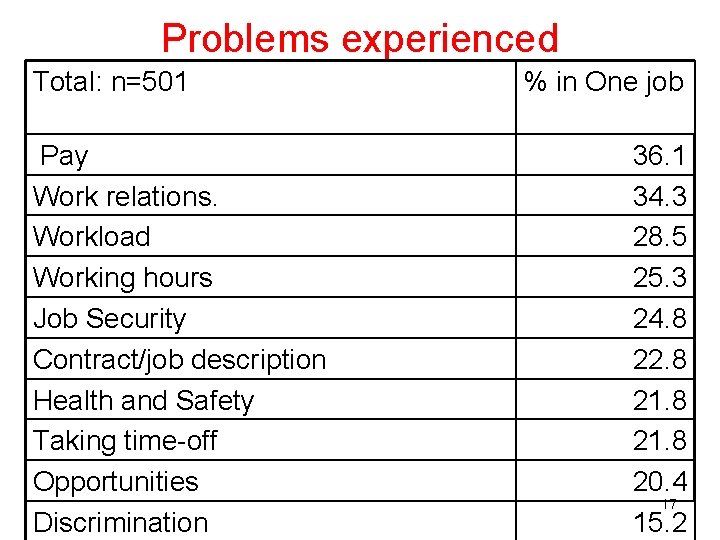
Problems experienced Total: n=501 Pay Work relations. Workload Working hours Job Security Contract/job description Health and Safety Taking time-off Opportunities Discrimination % in One job 36. 1 34. 3 28. 5 25. 3 24. 8 22. 8 21. 8 20. 4 17 15. 2
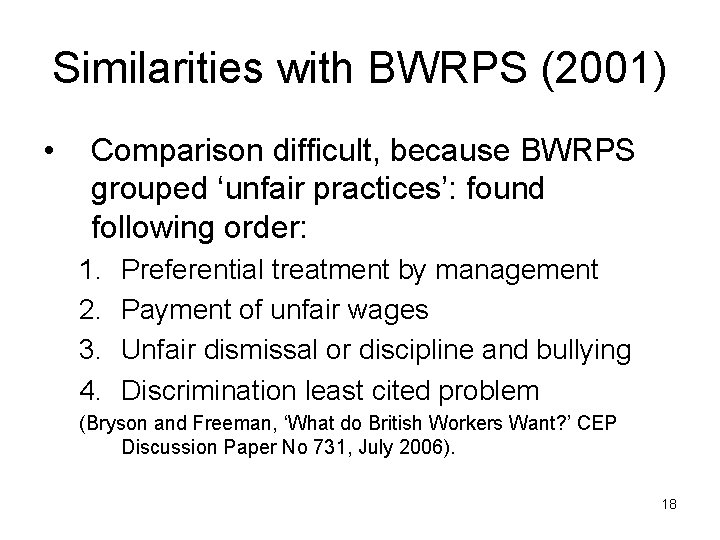
Similarities with BWRPS (2001) • Comparison difficult, because BWRPS grouped ‘unfair practices’: found following order: 1. 2. 3. 4. Preferential treatment by management Payment of unfair wages Unfair dismissal or discipline and bullying Discrimination least cited problem (Bryson and Freeman, ‘What do British Workers Want? ’ CEP Discussion Paper No 731, July 2006). 18
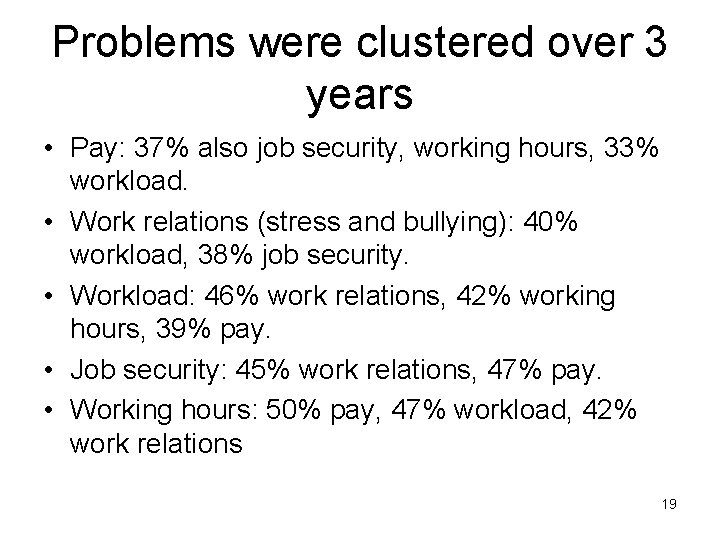
Problems were clustered over 3 years • Pay: 37% also job security, working hours, 33% workload. • Work relations (stress and bullying): 40% workload, 38% job security. • Workload: 46% work relations, 42% working hours, 39% pay. • Job security: 45% work relations, 47% pay. • Working hours: 50% pay, 47% workload, 42% work relations 19
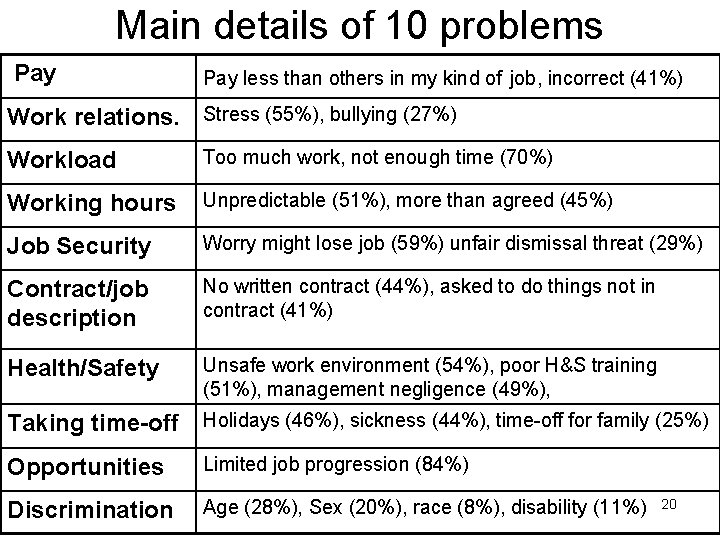
Main details of 10 problems Pay less than others in my kind of job, incorrect (41%) Work relations. Stress (55%), bullying (27%) Workload Too much work, not enough time (70%) Working hours Unpredictable (51%), more than agreed (45%) Job Security Worry might lose job (59%) unfair dismissal threat (29%) Contract/job description No written contract (44%), asked to do things not in contract (41%) Health/Safety Unsafe work environment (54%), poor H&S training (51%), management negligence (49%), Taking time-off Holidays (46%), sickness (44%), time-off for family (25%) Opportunities Limited job progression (84%) Discrimination Age (28%), Sex (20%), race (8%), disability (11%) 20
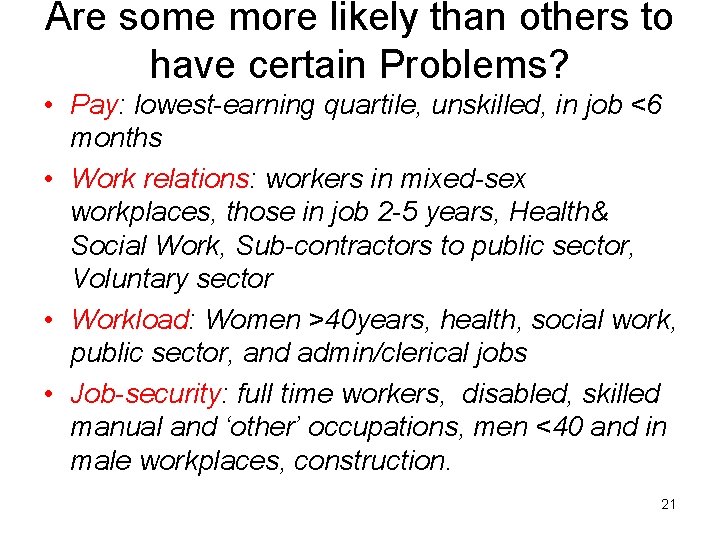
Are some more likely than others to have certain Problems? • Pay: lowest-earning quartile, unskilled, in job <6 months • Work relations: workers in mixed-sex workplaces, those in job 2 -5 years, Health& Social Work, Sub-contractors to public sector, Voluntary sector • Workload: Women >40 years, health, social work, public sector, and admin/clerical jobs • Job-security: full time workers, disabled, skilled manual and ‘other’ occupations, men <40 and in male workplaces, construction. 21
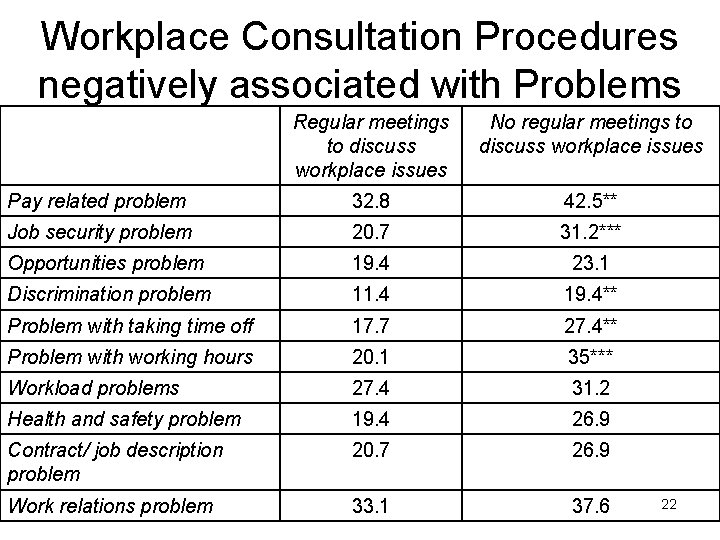
Workplace Consultation Procedures negatively associated with Problems Regular meetings to discuss workplace issues No regular meetings to discuss workplace issues Pay related problem 32. 8 42. 5** Job security problem 20. 7 31. 2*** Opportunities problem 19. 4 23. 1 Discrimination problem 11. 4 19. 4** Problem with taking time off 17. 7 27. 4** Problem with working hours 20. 1 35*** Workload problems 27. 4 31. 2 Health and safety problem 19. 4 26. 9 Contract/ job description problem 20. 7 26. 9 Work relations problem 33. 1 37. 6 22
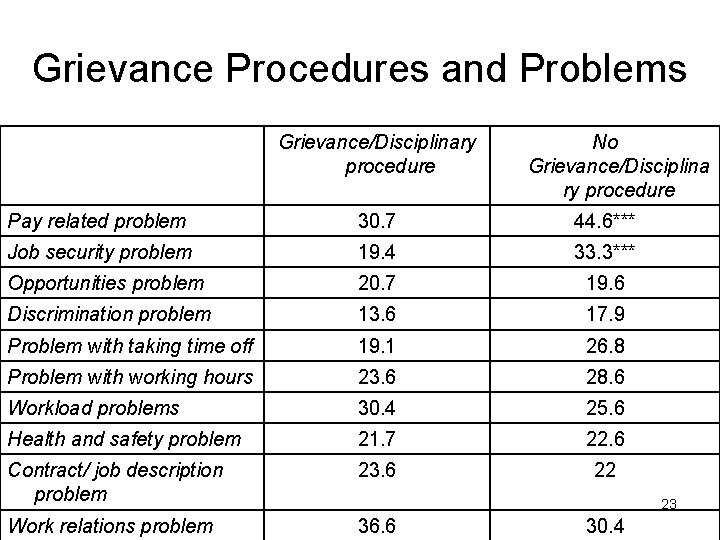
Grievance Procedures and Problems Grievance/Disciplinary procedure No Grievance/Disciplina ry procedure Pay related problem 30. 7 44. 6*** Job security problem 19. 4 33. 3*** Opportunities problem 20. 7 19. 6 Discrimination problem 13. 6 17. 9 Problem with taking time off 19. 1 26. 8 Problem with working hours 23. 6 28. 6 Workload problems 30. 4 25. 6 Health and safety problem 21. 7 22. 6 Contract/ job description problem 23. 6 22 Work relations problem 36. 6 23 30. 4
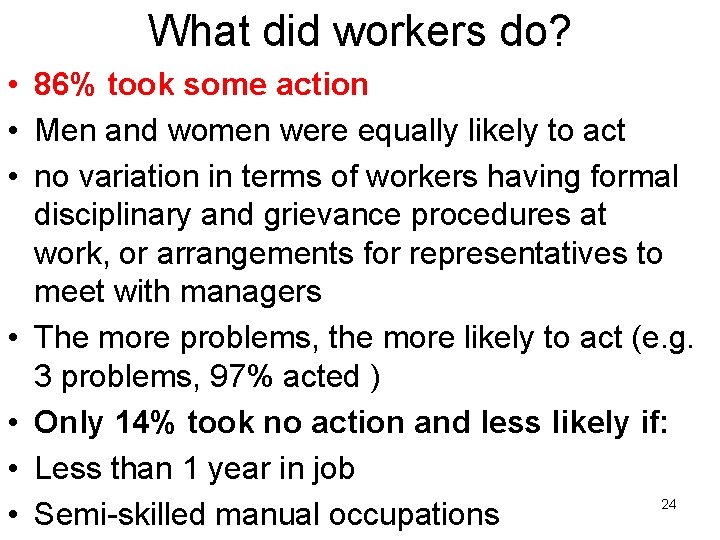
What did workers do? • 86% took some action • Men and women were equally likely to act • no variation in terms of workers having formal disciplinary and grievance procedures at work, or arrangements for representatives to meet with managers • The more problems, the more likely to act (e. g. 3 problems, 97% acted ) • Only 14% took no action and less likely if: • Less than 1 year in job 24 • Semi-skilled manual occupations
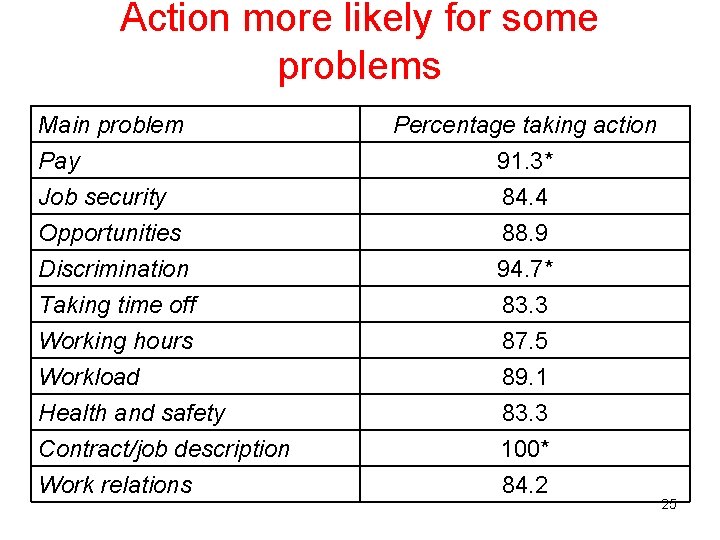
Action more likely for some problems Main problem Pay Job security Opportunities Discrimination Taking time off Working hours Workload Health and safety Contract/job description Work relations Percentage taking action 91. 3* 84. 4 88. 9 94. 7* 83. 3 87. 5 89. 1 83. 3 100* 84. 2 25
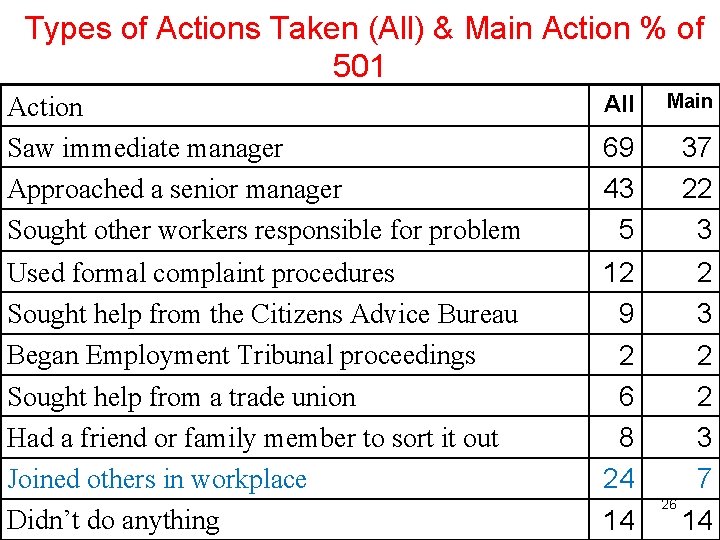
Types of Actions Taken (All) & Main Action % of 501 Action Saw immediate manager Approached a senior manager Sought other workers responsible for problem All Main 69 43 5 37 22 3 Used formal complaint procedures Sought help from the Citizens Advice Bureau Began Employment Tribunal proceedings Sought help from a trade union Had a friend or family member to sort it out Joined others in workplace Didn’t do anything 12 9 2 6 8 24 14 2 3 2 2 3 7 26 14
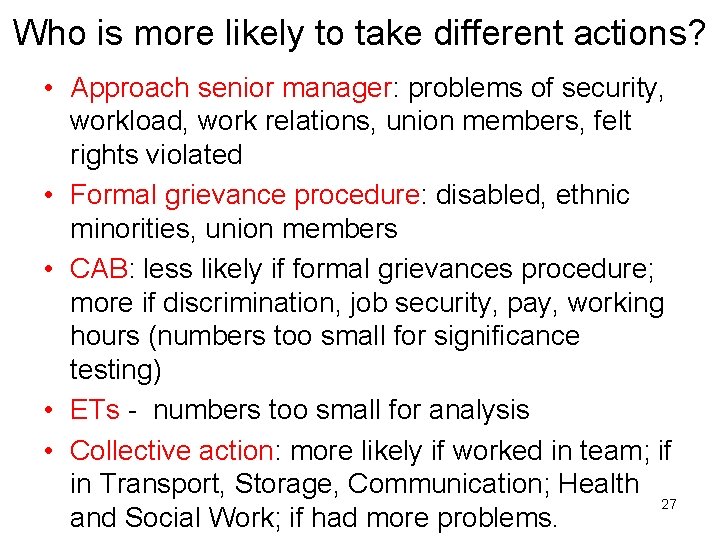
Who is more likely to take different actions? • Approach senior manager: problems of security, workload, work relations, union members, felt rights violated • Formal grievance procedure: disabled, ethnic minorities, union members • CAB: less likely if formal grievances procedure; more if discrimination, job security, pay, working hours (numbers too small for significance testing) • ETs - numbers too small for analysis • Collective action: more likely if worked in team; if in Transport, Storage, Communication; Health 27 and Social Work; if had more problems.
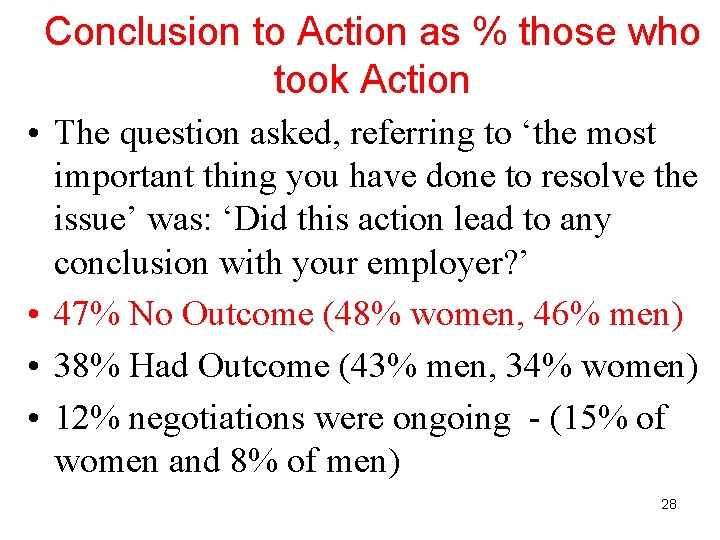
Conclusion to Action as % those who took Action • The question asked, referring to ‘the most important thing you have done to resolve the issue’ was: ‘Did this action lead to any conclusion with your employer? ’ • 47% No Outcome (48% women, 46% men) • 38% Had Outcome (43% men, 34% women) • 12% negotiations were ongoing - (15% of women and 8% of men) 28
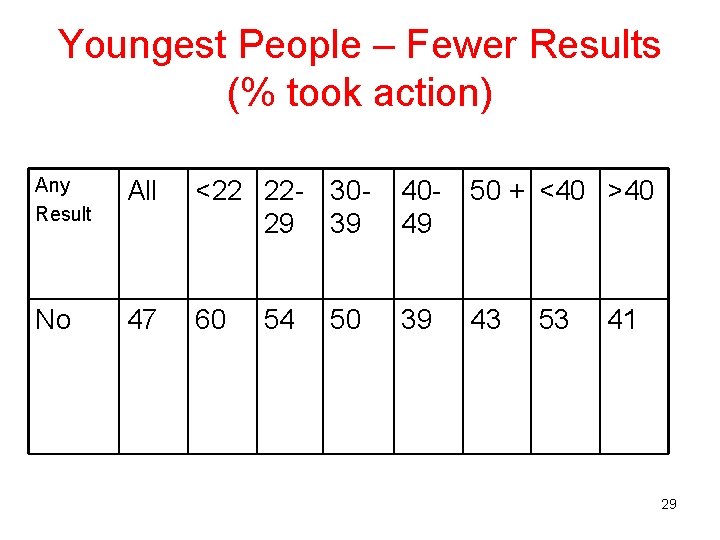
Youngest People – Fewer Results (% took action) Any Result All <22 22 - 3029 39 4049 50 + <40 >40 No 47 60 39 43 54 50 53 41 29
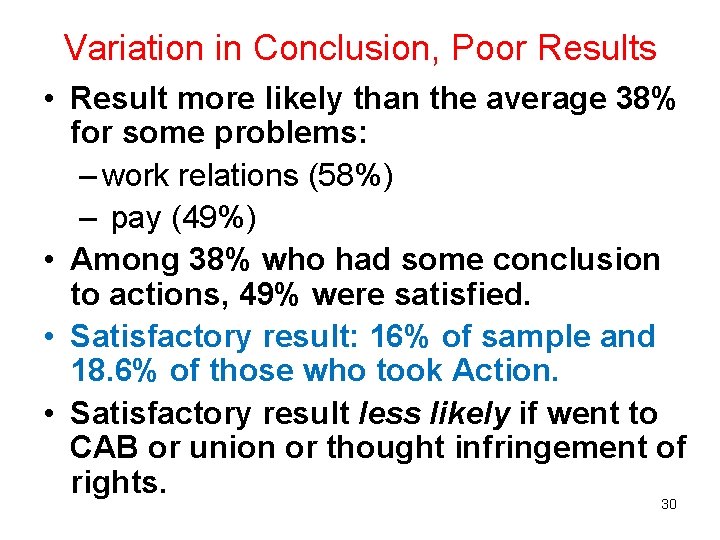
Variation in Conclusion, Poor Results • Result more likely than the average 38% for some problems: – work relations (58%) – pay (49%) • Among 38% who had some conclusion to actions, 49% were satisfied. • Satisfactory result: 16% of sample and 18. 6% of those who took Action. • Satisfactory result less likely if went to CAB or union or thought infringement of rights. 30
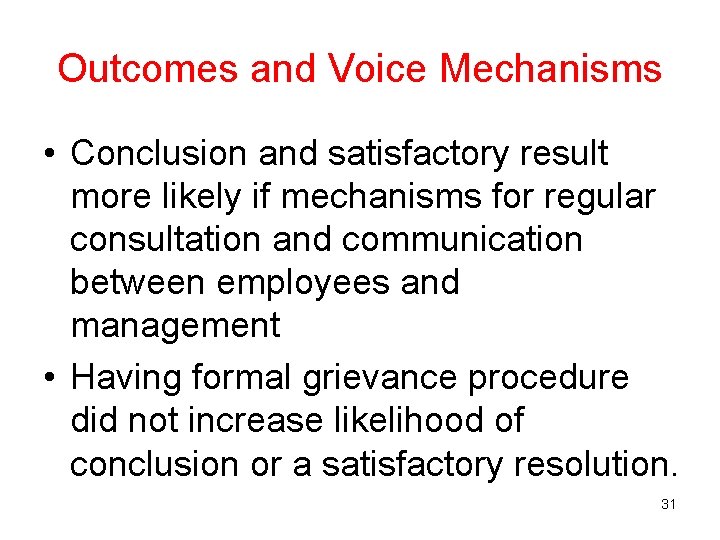
Outcomes and Voice Mechanisms • Conclusion and satisfactory result more likely if mechanisms for regular consultation and communication between employees and management • Having formal grievance procedure did not increase likelihood of conclusion or a satisfactory resolution. 31
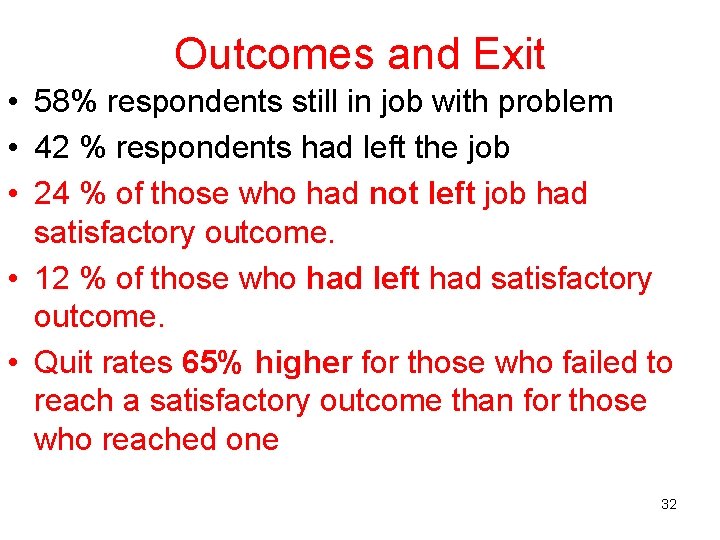
Outcomes and Exit • 58% respondents still in job with problem • 42 % respondents had left the job • 24 % of those who had not left job had satisfactory outcome. • 12 % of those who had left had satisfactory outcome. • Quit rates 65% higher for those who failed to reach a satisfactory outcome than for those who reached one 32
Vulnerable workers and Collective Organisation • A: Non-union members (71. 6% of the workforce, 83. 4% in private sector) • B: Low-paid (Earning at or below the median hourly wages) • A & B: 40% of workforce according LFS 2004. • Those among these with problems clearly VULNERABLE: almost HALF no outcome • Focus for union ‘organising’ approach. 33
Collective Action Probe • Prompt for All Actions: – ‘Joined with others in your workplace who share your concerns to get together as a group to pursue your claims. ’ – 24% of sample, 28% those who acted. 34
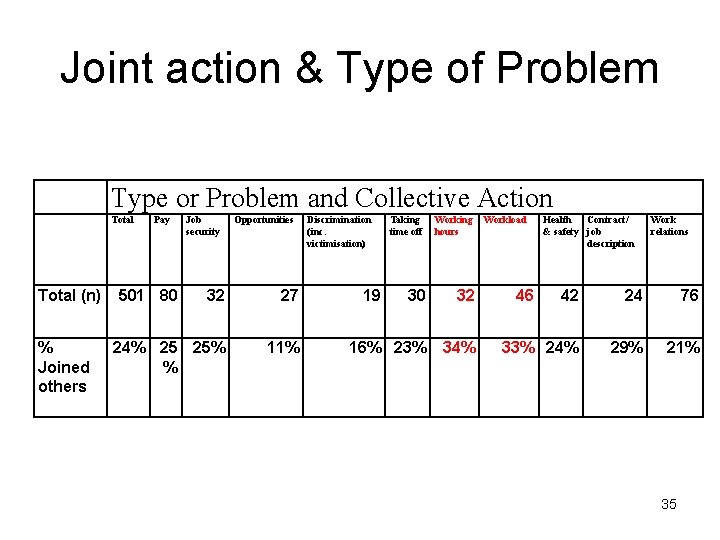
Joint action & Type of Problem Type or Problem and Collective Action Total (n) % Joined others Pay 501 80 Job security Opportunities 32 27 24% 25 25% % 11% Discrimination (inc. victimisation) 19 Taking time off Working hours 30 32 16% 23% 34% Workload 46 Health Contract/ & safety job description Work relations 42 24 76 33% 24% 29% 21% 35
Collective Identity – even higher • In the workplace where you had the problems, are/were your problems experienced by other people at work? • 75% said YES (375 people) • You mentioned that other people at your workplace shared the concerns. Did you discuss these issues or concerns with these other people or did you do anything together to try to resolve them? • 75% said YES (280 people) (56% sample) 36
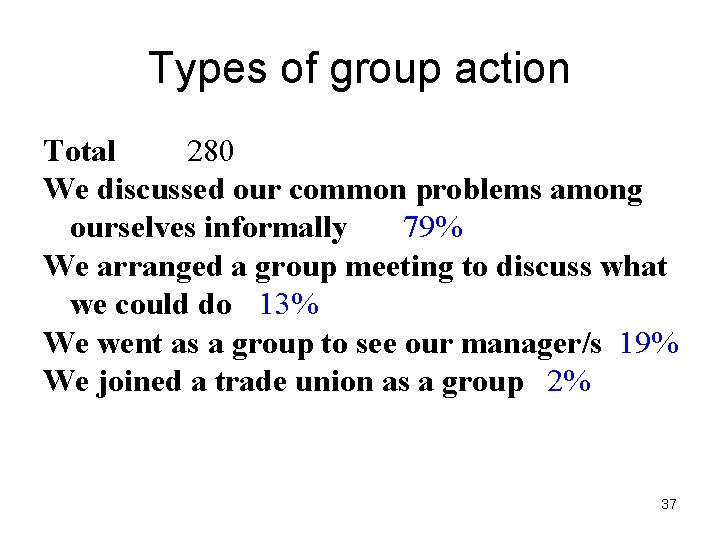
Types of group action Total 280 We discussed our common problems among ourselves informally 79% We arranged a group meeting to discuss what we could do 13% We went as a group to see our manager/s 19% We joined a trade union as a group 2% 37
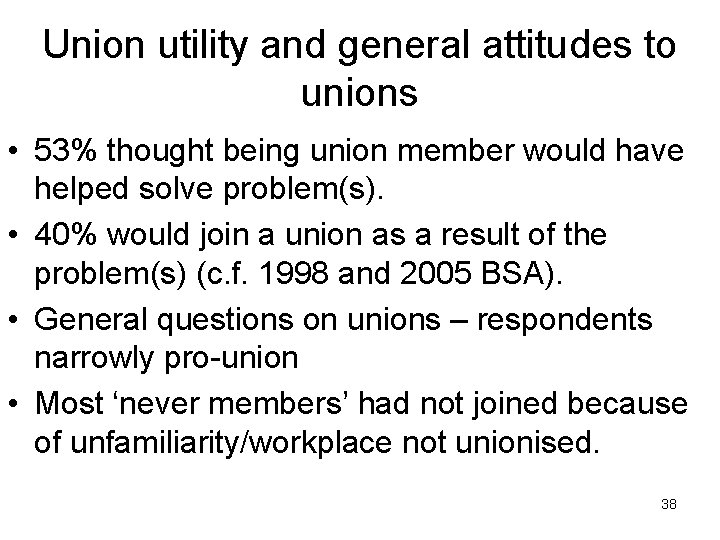
Union utility and general attitudes to unions • 53% thought being union member would have helped solve problem(s). • 40% would join a union as a result of the problem(s) (c. f. 1998 and 2005 BSA). • General questions on unions – respondents narrowly pro-union • Most ‘never members’ had not joined because of unfamiliarity/workplace not unionised. 38
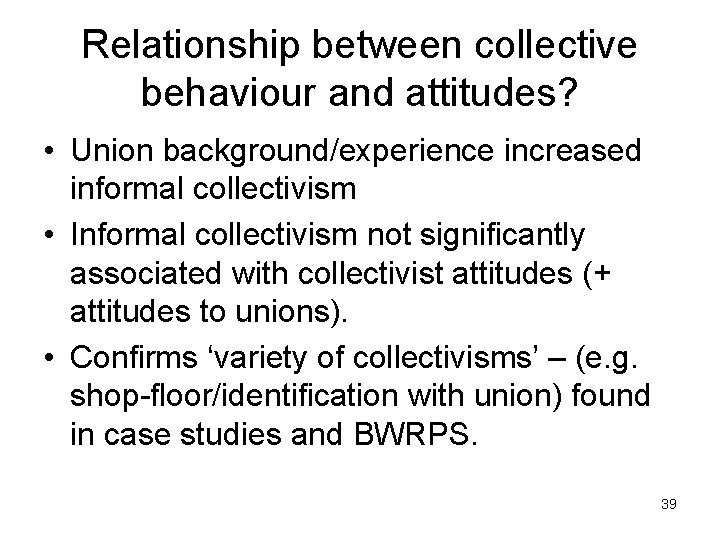
Relationship between collective behaviour and attitudes? • Union background/experience increased informal collectivism • Informal collectivism not significantly associated with collectivist attitudes (+ attitudes to unions). • Confirms ‘variety of collectivisms’ – (e. g. shop-floor/identification with union) found in case studies and BWRPS. 39
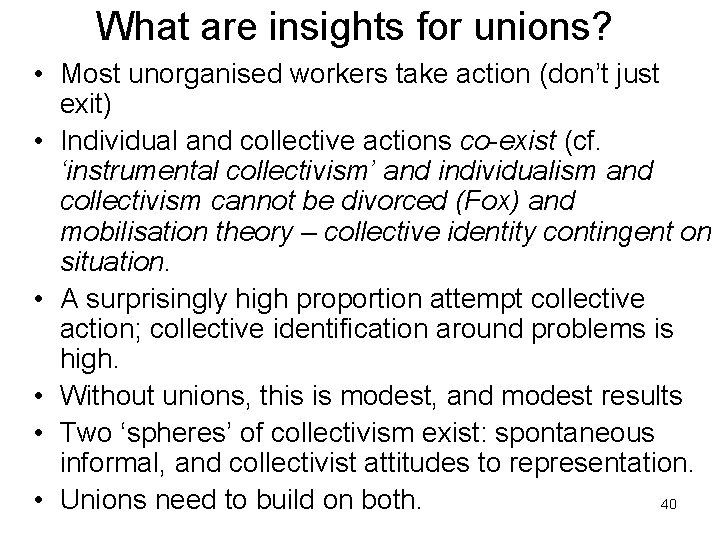
What are insights for unions? • Most unorganised workers take action (don’t just exit) • Individual and collective actions co-exist (cf. ‘instrumental collectivism’ and individualism and collectivism cannot be divorced (Fox) and mobilisation theory – collective identity contingent on situation. • A surprisingly high proportion attempt collective action; collective identification around problems is high. • Without unions, this is modest, and modest results • Two ‘spheres’ of collectivism exist: spontaneous informal, and collectivist attitudes to representation. 40 • Unions need to build on both.
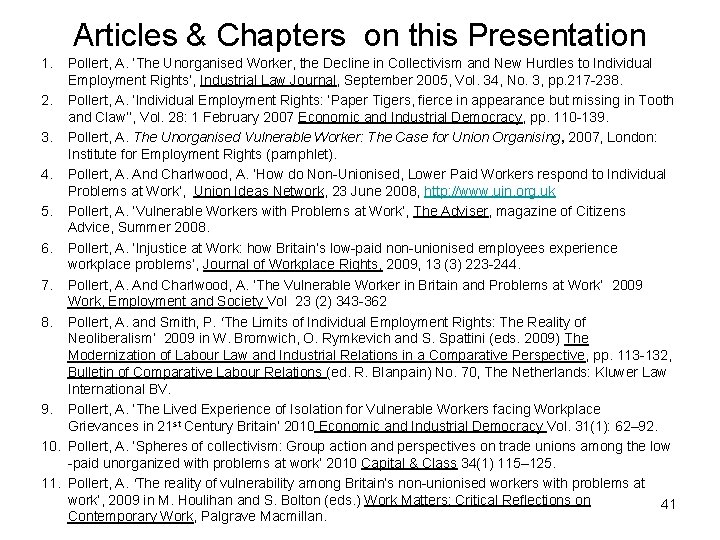
Articles & Chapters on this Presentation 1. Pollert, A. ‘The Unorganised Worker, the Decline in Collectivism and New Hurdles to Individual Employment Rights’, Industrial Law Journal, September 2005, Vol. 34, No. 3, pp. 217 -238. 2. Pollert, A. ‘Individual Employment Rights: ‘Paper Tigers, fierce in appearance but missing in Tooth and Claw’’, Vol. 28: 1 February 2007 Economic and Industrial Democracy, pp. 110 -139. 3. Pollert, A. The Unorganised Vulnerable Worker: The Case for Union Organising, 2007, London: Institute for Employment Rights (pamphlet). 4. Pollert, A. And Charlwood, A. ‘How do Non-Unionised, Lower Paid Workers respond to Individual Problems at Work’, Union Ideas Network, 23 June 2008, http: //www. uin. org. uk 5. Pollert, A. ‘Vulnerable Workers with Problems at Work’, The Adviser, magazine of Citizens Advice, Summer 2008. 6. Pollert, A. ‘Injustice at Work: how Britain’s low-paid non-unionised employees experience workplace problems’, Journal of Workplace Rights, 2009, 13 (3) 223 -244. 7. Pollert, A. And Charlwood, A. ‘The Vulnerable Worker in Britain and Problems at Work’ 2009 Work, Employment and Society Vol 23 (2) 343 -362 8. Pollert, A. and Smith, P. ‘The Limits of Individual Employment Rights: The Reality of Neoliberalism’ 2009 in W. Bromwich, O. Rymkevich and S. Spattini (eds. 2009) The Modernization of Labour Law and Industrial Relations in a Comparative Perspective, pp. 113 -132, Bulletin of Comparative Labour Relations (ed. R. Blanpain) No. 70, The Netherlands: Kluwer Law International BV. 9. Pollert, A. ‘The Lived Experience of Isolation for Vulnerable Workers facing Workplace Grievances in 21 st Century Britain’ 2010 Economic and Industrial Democracy Vol. 31(1): 62– 92. 10. Pollert, A. ‘Spheres of collectivism: Group action and perspectives on trade unions among the low -paid unorganized with problems at work’ 2010 Capital & Class 34(1) 115– 125. 11. Pollert, A. ‘The reality of vulnerability among Britain’s non-unionised workers with problems at work’, 2009 in M. Houlihan and S. Bolton (eds. ) Work Matters: Critical Reflections on 41 Contemporary Work, Palgrave Macmillan.
- Slides: 41