
Ingolf Boettcher Rome 2 October 2015 www statistik

Ingolf Boettcher Rome 2. October 2015 www. statistik. at The impact of spatial aggregation on price indices with scanner data Wir bewegen Informationen
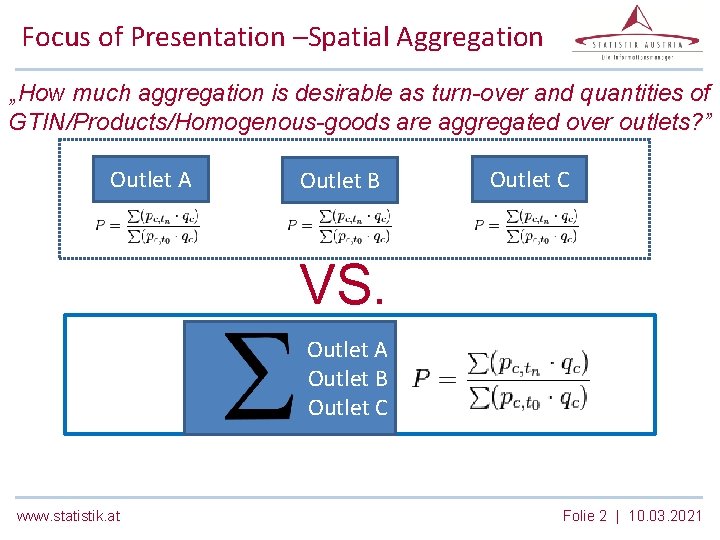
Focus of Presentation –Spatial Aggregation „How much aggregation is desirable as turn-over and quantities of GTIN/Products/Homogenous-goods are aggregated over outlets? ” Outlet A Outlet B Outlet C VS. Outlet A Outlet B Outlet C www. statistik. at Folie 2 | 10. 03. 2021
Reasons to aggregate SD over outlets § Limited resources and the need for efficient and transparent processes § Unavailability of scanner data at outlet level § Perception / Opinion / Finding that: Outlet level data is irrelevant or even obstructive for constructing a robust index www. statistik. at Folie 3 | 10. 03. 2021

Possible impact of spatial aggregation www. statistik. at Folie 4 | 10. 03. 2021
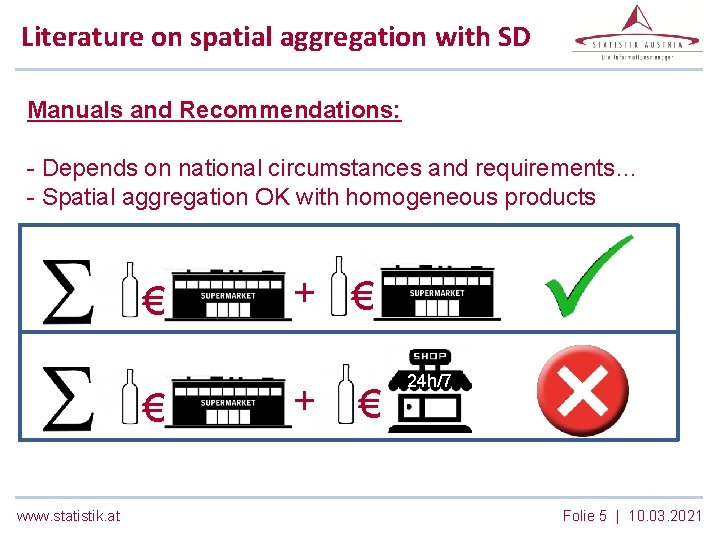
Literature on spatial aggregation with SD Manuals and Recommendations: - Depends on national circumstances and requirements… - Spatial aggregation OK with homogeneous products € € www. statistik. at + € 24 h/7 Folie 5 | 10. 03. 2021
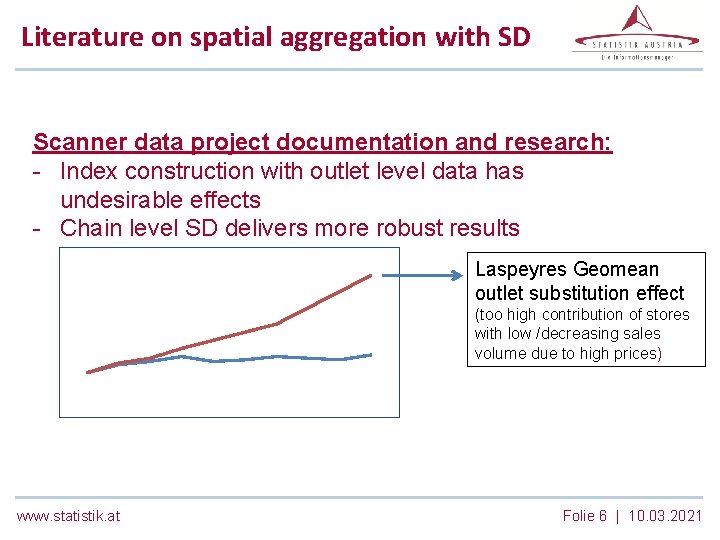
Literature on spatial aggregation with SD Scanner data project documentation and research: - Index construction with outlet level data has undesirable effects - Chain level SD delivers more robust results Laspeyres Geomean outlet substitution effect (too high contribution of stores with low /decreasing sales volume due to high prices) www. statistik. at Folie 6 | 10. 03. 2021

Austrian scanner data delivery – August 2015 Delivery of a 2 -Year Historical Scanner Data Set Product Segment COICOP 12. 1. 3. “Personal Care Products” # of Shops # of GTINs/article information per week per shop # transaction information per week (Month) About 350 About 3. 000 # of transmitted weeks Size of datasets in MB per week 106 (Dec 2012 – Dec 2014) About 13 Megabyte www. statistik. at About 1. 050. 000 (About 4. 200. 000) Folie 7 | 10. 03. 2021
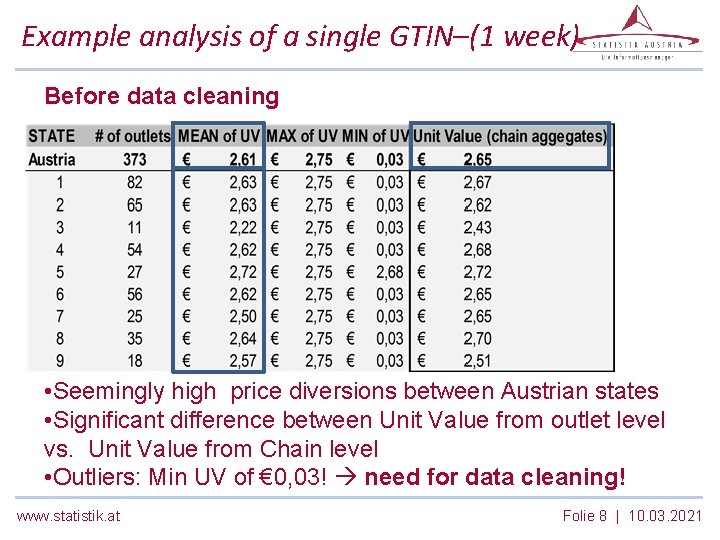
Example analysis of a single GTIN–(1 week) Before data cleaning • Seemingly high price diversions between Austrian states • Significant difference between Unit Value from outlet level vs. Unit Value from Chain level • Outliers: Min UV of € 0, 03! need for data cleaning! www. statistik. at Folie 8 | 10. 03. 2021

Example analysis of a single GTIN–(1 week) After data cleaning (simple removal of outliers at outlet level) • Low high price diversions between Austrian States • Negligible differences between Unit Value from outlet level vs. Unit Value from chain level www. statistik. at Folie 9 | 10. 03. 2021
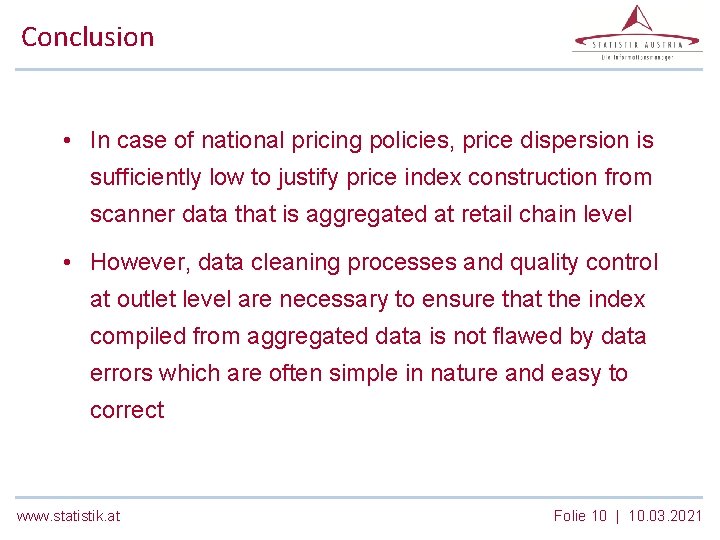
Conclusion • In case of national pricing policies, price dispersion is sufficiently low to justify price index construction from scanner data that is aggregated at retail chain level • However, data cleaning processes and quality control at outlet level are necessary to ensure that the index compiled from aggregated data is not flawed by data errors which are often simple in nature and easy to correct www. statistik. at Folie 10 | 10. 03. 2021

Dominik‘s Database http: //research. chicagobooth. edu/kilts/marketingdatabases/dominicks/category-files www. statistik. at Folie 11 | 10. 03. 2021

Dominik‘s Database www. statistik. at Folie 12 | 10. 03. 2021

Contact: Ingolf Boettcher Guglgasse 13, 1110 Wien Tel: +43 (1) 71128 -7917 Fax: +43 (1) 7180718 ingolf. boettcher@statistik. gv. at www. statistik. at The impact of spatial aggregation on price indices with scanner data Folie 13 | 10. 03. 2021
- Slides: 13