
Infrastructure themes funding models A private finance perspective



- Slides: 34
Infrastructure themes & funding models A private finance perspective John Pickhaver Macquarie Capital 21 March 2016
Important notice and disclaimer This presentation has been prepared by Macquarie Capital (Australia) Limited ABN 79 123 199 548 (“Macquarie”) for the sole purpose of providing an overview of key themes in infrastructure financing (“Purpose”). It is provided on a confidential basis, and may not be reproduced in whole or in part, nor may any of its contents be disclosed to any other person, without Macquarie’s prior written consent. This presentation is provided by Macquarie for general information purposes only, without taking into account any potential investors’ personal objectives, financial situation or needs. It should not be relied upon by the recipient in considering the merits of any particular transaction. It is not an offer to buy or sell, or a solicitation to invest in or refrain from investing in, any securities or other investment product. Nothing in this presentation constitutes investment, legal, tax, accounting or other advice. The recipient should consider its own financial situation, objectives and needs, and conduct its own independent investigation and assessment of the contents of this presentation, including obtaining investment, legal, tax, accounting and such other advice as it considers necessary or appropriate. This presentation has been prepared on the basis of publicly available information or as noted within the presentation. Macquarie has relied upon and assumed, without independent verification, the accuracy and completeness of all such information. It contains selected information and does not purport to be all-inclusive or to contain all of the information that may be relevant to the Purpose. The recipient acknowledges that circumstances may change and that this presentation may become outdated as a result. Macquarie is under no obligation to update or correct this presentation. Macquarie, its related bodies corporate and other affiliates, and their respective directors, employees, consultants and agents (“Macquarie Group”) make no representation or warranty as to the accuracy, completeness, timeliness or reliability of the contents of this presentation. To the maximum extent permitted by law, no member of the Macquarie Group accepts any liability (including, without limitation, any liability arising from fault or negligence on the part of any of them) for any loss whatsoever arising from the use of this presentation or its contents or otherwise arising in connection with it. This presentation may contain forward-looking statements, forecasts, estimates and projections (“Forward Statements”). No independent third party has reviewed the reasonableness of any such statements or assumptions. No member of the Macquarie Group represents or warrants that such Forward Statements will be achieved or will prove to be correct. Actual future results and operations could vary materially from the Forward Statements. Similarly, no representation or warranty is made that the assumptions on which the Forward Statements are based may be reasonable. No audit, review or verification has been undertaken by the Macquarie Group or an independent third party of the assumptions, data, results, calculations and forecasts presented or referred to in this presentation. The recipient acknowledges that neither it nor Macquarie intends that Macquarie act or be responsible as a fiduciary to the recipient, its management, stockholders, creditors or any other person. Each of the recipient and Macquarie, by accepting and providing this presentation respectively, expressly disclaims any fiduciary relationship and agrees that the recipient is responsible for making its own independent judgments with respect to any transaction and any other matters regarding this presentation. The Macquarie Group may have interests in the securities and other investment products referred to in the presentation, including being directors of, or may have or may in the future act in various roles including as underwriter, dealer, broker, lender or financial advisor to their issuers and may receive fees, brokerage or commission for acting in those capacities. Further, the Macquarie Group may act as a market maker or buy or sell those securities and other investment products as principal or agent and as such may effect transactions which are not consistent with this information. None of the entities noted in this presentation are an authorised deposit-taking institutions for the purposes of the Banking Act 1959 (Commonwealth of Australia). The obligations of these entities do not represent deposits or other liabilities of Macquarie Bank Limited ABN 46 008 583 542. Macquarie Bank Limited does not guarantee or otherwise provide assurance in respect of the obligations of these entities. © Macquarie Group 2016 PAGE 2
Value sharing A private financier’s perspective 1. Key themes driving private infrastructure investment 2. The state of private finance markets for infrastructure 3. Value sharing from a private finance perspective 4. PAGE 3
01 Key themes driving private infrastructure investment
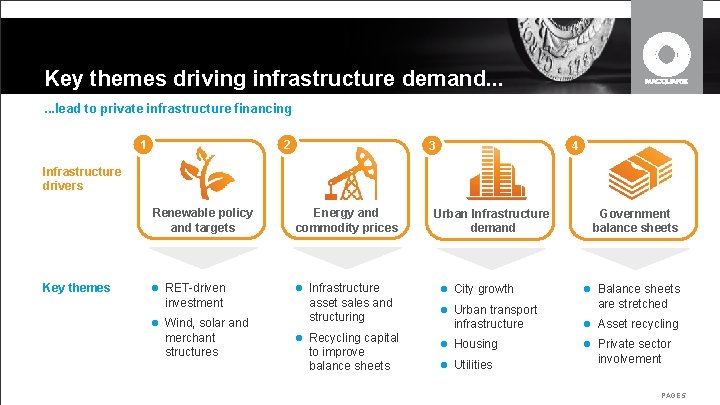
Key themes driving infrastructure demand. . . lead to private infrastructure financing 1 2 3 4 Infrastructure drivers Key themes Renewable policy and targets Energy and commodity prices RET-driven Infrastructure investment Wind, solar and merchant structures asset sales and structuring Recycling capital to improve balance sheets Urban Infrastructure demand City growth Urban transport infrastructure Housing Utilities Government balance sheets Balance sheets are stretched Asset recycling Private sector involvement PAGE 5
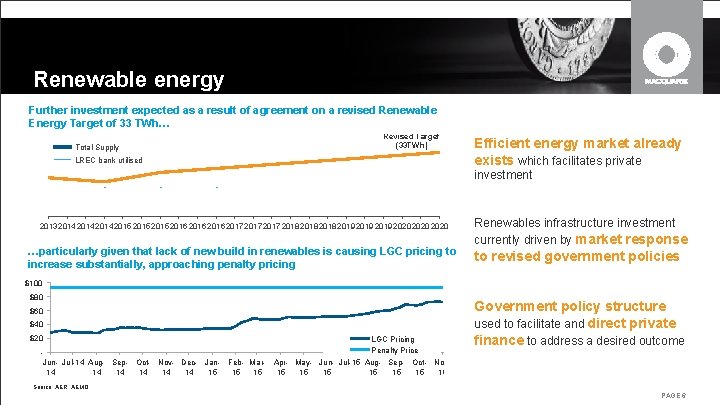
Renewable energy Further investment expected as a result of agreement on a revised Renewable Energy Target of 33 TWh… Total Supply Revised Target (33 TWh) LREC bank utilised Efficient energy market already exists which facilitates private investment 201320142015 2016201720182019 2020 …particularly given that lack of new build in renewables is causing LGC pricing to increase substantially, approaching penalty pricing Renewables infrastructure investment currently driven by market response to revised government policies $100 $80 $60 $40 $20 LGC Pricing Penalty Price Jun- Jul-14 Aug- Sep- Oct- Nov- Dec- Jan- Feb- Mar- Apr- May- Jun- Jul-15 Aug- Sep- Oct- Nov 14 14 14 15 15 15 Government policy structure used to facilitate and direct private finance to address a desired outcome Source: AER, AEMO PAGE 6
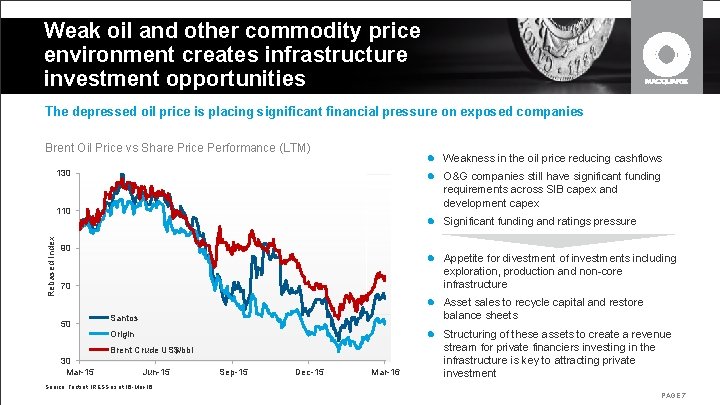
Weak oil and other commodity price environment creates infrastructure investment opportunities The depressed oil price is placing significant financial pressure on exposed companies Brent Oil Price vs Share Price Performance (LTM) Weakness in the oil price reducing cashflows 130 O&G companies still have significant funding requirements across SIB capex and development capex Rebased Index 110 Significant funding and ratings pressure 90 Appetite for divestment of investments including exploration, production and non-core infrastructure 70 Asset sales to recycle capital and restore 50 balance sheets Santos Structuring of these assets to create a revenue Origin Brent Crude US$/bbl 30 Mar-15 Jun-15 Sep-15 Dec-15 Mar-16 stream for private financiers investing in the infrastructure is key to attracting private investment Source: Factset, IRESS as at 16 -Mar-16 PAGE 7
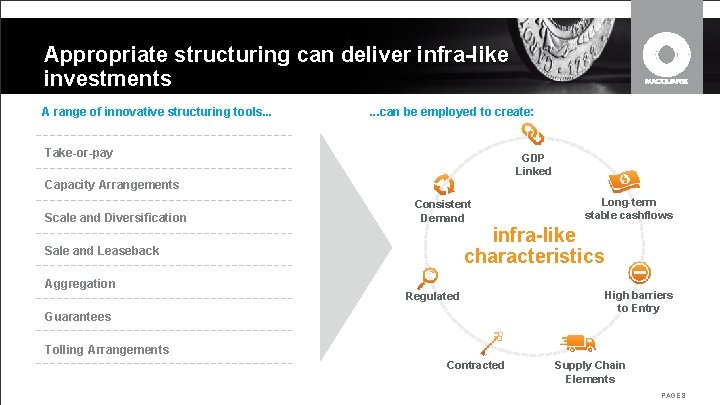
Appropriate structuring can deliver infra-like investments A range of innovative structuring tools. . . can be employed to create: Take-or-pay GDP Linked Capacity Arrangements Scale and Diversification Consistent Demand infra-like characteristics Sale and Leaseback Aggregation Long-term stable cashflows Regulated Guarantees High barriers to Entry Tolling Arrangements Contracted Supply Chain Elements PAGE 8
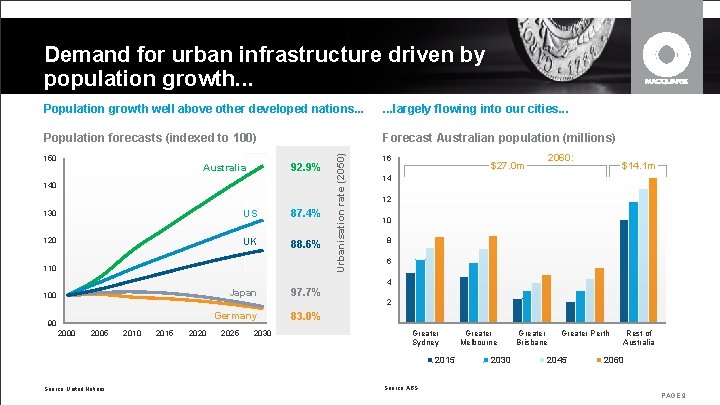
Demand for urban infrastructure driven by population growth. . . largely flowing into our cities. . . Population forecasts (indexed to 100) Forecast Australian population (millions) 150 92. 9% Australia 140 130 US 87. 4% 120 UK 88. 6% 110 Urbanisation rate (2050) Population growth well above other developed nations. . . 16 2060: $27. 0 m $14. 1 m 14 12 10 8 6 4 100 90 2005 2010 2015 2020 Japan 97. 7% Germany 83. 0% 2025 2030 2 Greater Sydney 2015 Source: United Nations Greater Melbourne 2030 Greater Brisbane Greater Perth 2045 Rest of Australia 2060 Source: ABS PAGE 9
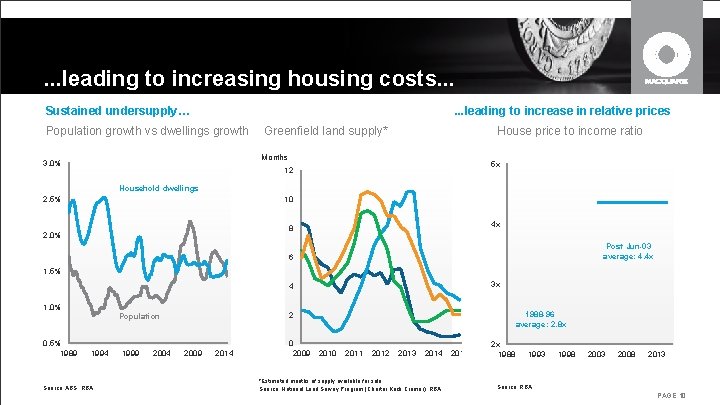
. . . leading to increasing housing costs. . . Sustained undersupply… . . . leading to increase in relative prices Population growth vs dwellings growth House price to income ratio Greenfield land supply* Months 3. 0% 5 x 12 Household dwellings 2. 5% 10 4 x 8 2. 0% Post Jun-03 average: 4. 4 x 6 1. 5% 3 x 4 1. 0% 0. 5% 1989 1994 Source: ABS, RBA 1999 2004 1988 -96 average: 2. 8 x 2 Population 2009 2014 0 2009 2010 2011 2012 2013 2014 *Estimated months of supply available for sale Source: National Land Survey Program (Charter Keck Cramer), RBA 2015 2 x 1988 1993 1998 2003 2008 2013 Source: RBA PAGE 10
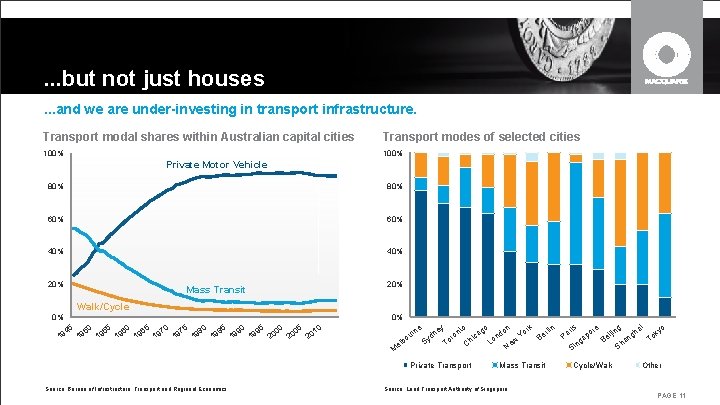
. . . but not just houses. . . and we are under-investing in transport infrastructure. Transport modal shares within Australian capital cities Transport modes of selected cities 100% Private Motor Vehicle 80% 60% 40% 20% Mass Transit Walk/Cycle 0% 0% 19 45 19 50 19 55 19 60 19 65 19 70 19 75 19 80 19 85 19 90 19 95 20 00 20 05 10 ne ur 20 e M o lb y ne d Sy to on r To Private Transport Source: Bureau of Infrastructure, Transport and Regional Economics go ca i Ch k n do n Lo N r Yo ew Mass Transit Source: Land Transport Authority of Singapore lin r Be i o g e ris ha oky or jin Pa ei ng ap T B a g n Sh Si Cycle/Walk Other PAGE 11
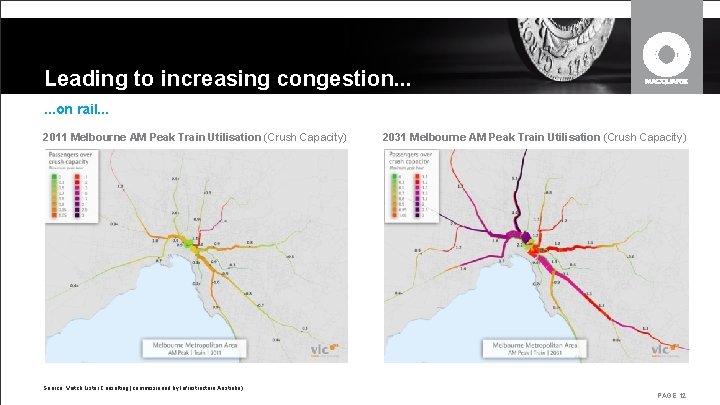
Leading to increasing congestion. . . on rail. . . 2011 Melbourne AM Peak Train Utilisation (Crush Capacity) 2031 Melbourne AM Peak Train Utilisation (Crush Capacity) Source: Veitch Lister Consulting (commissioned by Infrastructure Australia) PAGE 12
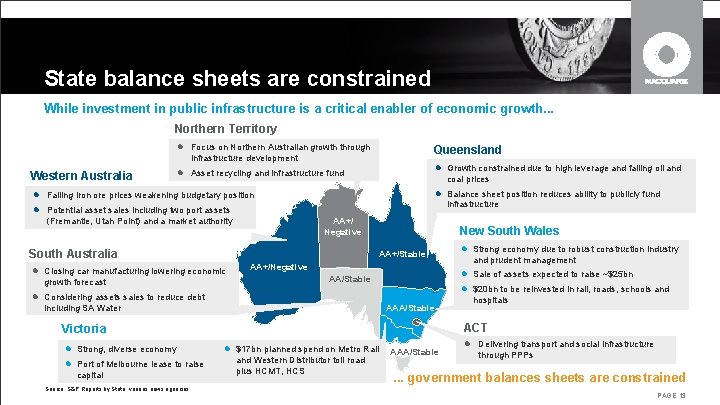
State balance sheets are constrained While investment in public infrastructure is a critical enabler of economic growth. . . Northern Territory Western Australia Focus on Northern Australian growth through infrastructure development Asset recycling and infrastructure fund Falling iron ore prices weakening budgetary position Potential asset sales including two port assets (Fremantle, Utah Point) and a market authority Growth constrained due to high leverage and falling oil and coal prices Balance sheet position reduces ability to publicly fund infrastructure AA+/ Negative AA+/Stable South Australia Closing car manufacturing lowering economic growth forecast Queensland AA+/Negative capital Source: S&P Reports by State, various news agencies hospitals AAA/Stable ACT Victoria Port of Melbourne lease to raise and prudent management $20 bn to be reinvested in rail, roads, schools and Considering assets sales to reduce debt Strong, diverse economy Strong economy due to robust construction industry Sale of assets expected to raise ~$25 bn AA/Stable including SA Water New South Wales $17 bn planned spend on Metro Rail AAA/Stable and Western Distributor toll road plus HCMT, HCS Delivering transport and social infrastructure through PPPs . . . government balances sheets are constrained PAGE 13
02 State of private finance markets for infrastructure
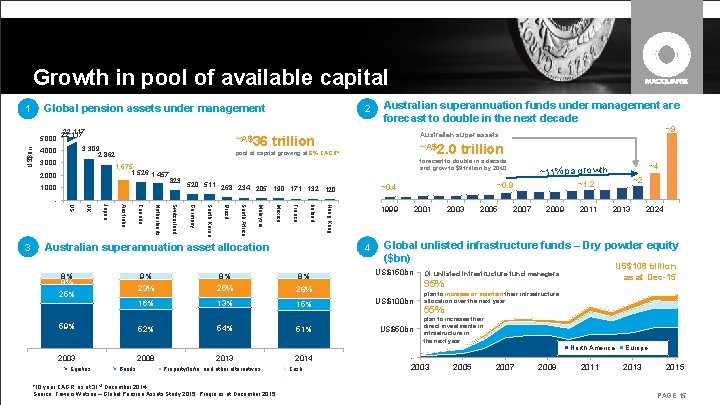
Growth in pool of available capital Global pension assets under management 1 US$bn 22, 117 5, 000 22, 117 ~A$36 3, 309 2, 862 4, 000 3, 000 1, 000 trillion 823 ~A$2. 0 520 511 268 234 205 190 171 132 120 1999 4 2001 2003 2005 ~4 ~11% pa growth ~2 ~1. 2 ~0. 9 2007 2009 2011 2013 US$150 bn 8% 8% 23% 25% 26% 13% 15% US$100 bn 59% 52% 54% 51% US$50 bn 2003 2008 2013 2014 - US$108 billion as at Dec-15 Of unlisted infrastructure fund managers: 95% plan to increase or maintain their infrastructure allocation over the next year 55% plan to increase their direct investments in infrastructure in the next year North America Equities Bonds Property/Infra. and other alternatives *10 year CAGR, as at 31 st December 2014 Source: Towers Watson – Global Pension Assets Study 2015, Preqin as at December 2015 Cash 2024 Global unlisted infrastructure funds – Dry powder equity ($bn) 9% 25% trillion ~0. 4 Hong Kong Ireland France Mexico Malaysia South Africa Brazil South Korea Germany Australian superannuation asset allocation 8% 8% ~9 Australian super assets forecast to double in a decade and grow to $9 trillion by 2040 Switzerland Netherlands Canada Australia Japan UK 3 US - Australian superannuation funds under management are forecast to double in the next decade pool of capital growing at 6% CAGR* 1, 675 1, 526 1, 457 2, 000 2 2003 2005 2007 2009 2011 Europe 2013 2015 PAGE 15
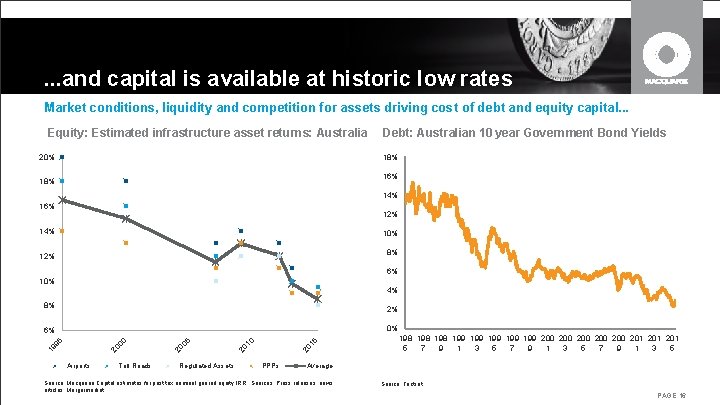
. . . and capital is available at historic low rates Market conditions, liquidity and competition for assets driving cost of debt and equity capital. . . Equity: Estimated infrastructure asset returns: Australia Debt: Australian 10 year Government Bond Yields 18% 20% 16% 18% 14% 16% 12% 14% 10% 12% 8% 6% 10% 4% 0% Toll Roads Regulated Assets 20 10 20 20 20 95 19 Airports 15 6% 05 2% 00 8% PPPs 198 198 199 199 199 200 200 200 201 201 5 7 9 1 3 5 Average Source: Macquarie Capital estimates for post tax nominal geared equity IRR. Sources: Press releases, news articles, Mergermarket. Source: Factset PAGE 16
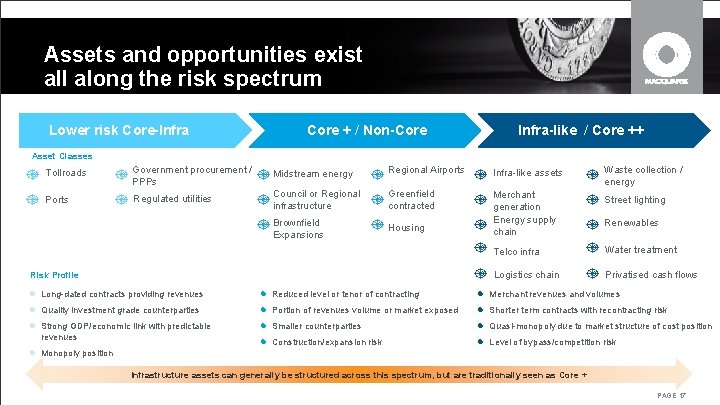
Assets and opportunities exist all along the risk spectrum Lower risk Core-Infra Core + / Non-Core Infra-like / Core ++ Asset Classes Tollroads Government procurement / PPPs Midstream energy Regional Airports Infra-like assets Ports Regulated utilities Council or Regional infrastructure Greenfield contracted Brownfield Expansions Housing Merchant generation Energy supply chain Risk Profile Waste collection / energy Street lighting Renewables Telco infra Water treatment Logistics chain Privatised cash flows Long-dated contracts providing revenues Reduced level or tenor of contracting Merchant revenues and volumes Quality investment grade counterparties Portion of revenues volume or market exposed Shorter term contracts with recontracting risk Strong GDP/economic link with predictable Smaller counterparties Quasi-monopoly due to market structure of cost position Construction/expansion risk Level of bypass/competition risk revenues Monopoly position Infrastructure assets can generally be structured across this spectrum, but are traditionally seen as Core + PAGE 17
03 Value sharing: A private finance perspective
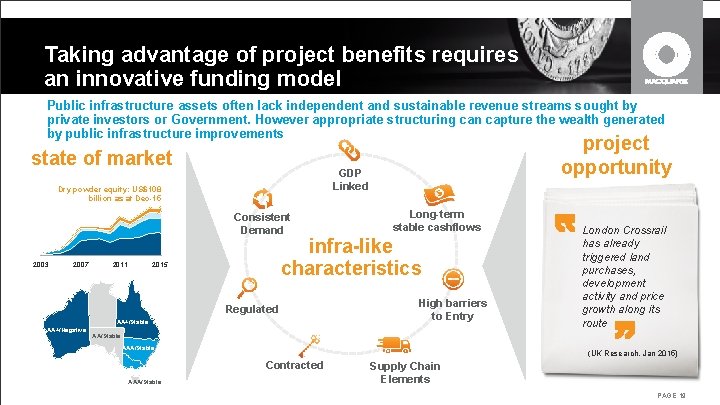
Taking advantage of project benefits requires an innovative funding model Public infrastructure assets often lack independent and sustainable revenue streams sought by private investors or Government. However appropriate structuring can capture the wealth generated by public infrastructure improvements state of market GDP Linked Dry powder equity: US$108 billion as at Dec-15 Consistent Demand 2003 2007 2011 AA+/Negative Long-term stable cashflows infra-like characteristics 2015 AA+/Stable project opportunity Regulated High barriers to Entry London Crossrail has already triggered land purchases, development activity and price growth along its route AA/Stable AAA/Stable (UK Research, Jan 2015) Contracted AAA/Stable Supply Chain Elements PAGE 19
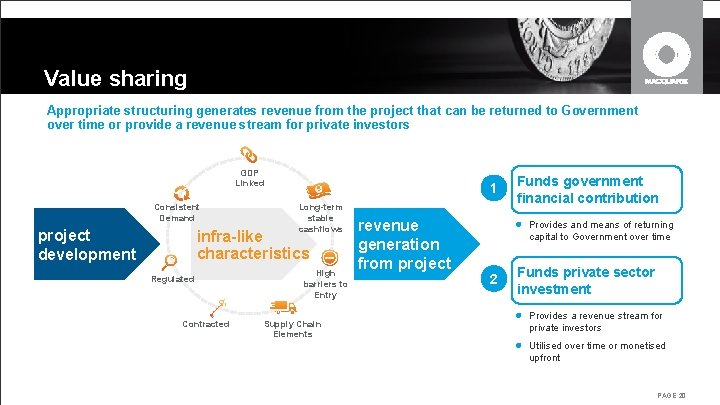
Value sharing Appropriate structuring generates revenue from the project that can be returned to Government over time or provide a revenue stream for private investors GDP Linked Consistent Demand project development 1 Long-term stable cashflows infra-like characteristics Regulated Contracted High barriers to Entry Supply Chain Elements revenue generation from project Funds government financial contribution Provides and means of returning capital to Government over time 2 Funds private sector investment Provides a revenue stream for private investors Utilised over time or monetised upfront PAGE 20
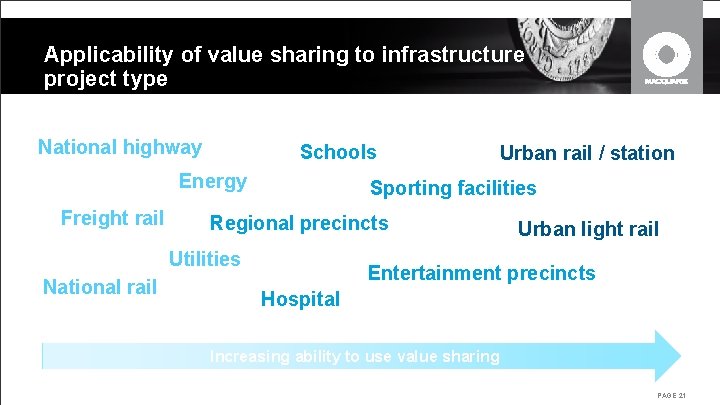
Applicability of value sharing to infrastructure project type National highway Schools Energy Freight rail Sporting facilities Regional precincts Utilities National rail Urban rail / station Urban light rail Entertainment precincts Hospital Increasing ability to use value sharing PAGE 21
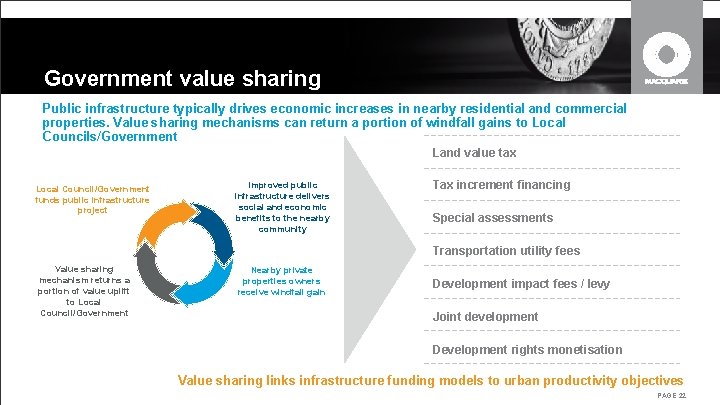
Government value sharing Public infrastructure typically drives economic increases in nearby residential and commercial properties. Value sharing mechanisms can return a portion of windfall gains to Local Councils/Government Land value tax Local Council/Government funds public infrastructure project Improved public infrastructure delivers social and economic benefits to the nearby community Tax increment financing Special assessments Transportation utility fees Value sharing mechanism returns a portion of value uplift to Local Council/Government Nearby private properties owners receive windfall gain Development impact fees / levy Joint development Development rights monetisation Value sharing links infrastructure funding models to urban productivity objectives PAGE 22
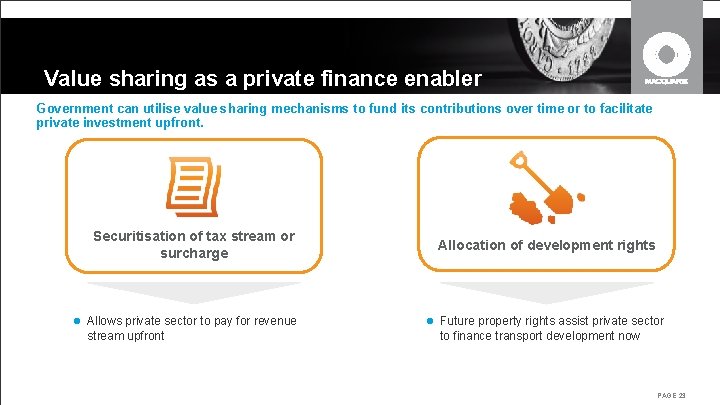
Value sharing as a private finance enabler Government can utilise value sharing mechanisms to fund its contributions over time or to facilitate private investment upfront. Securitisation of tax stream or surcharge Allows private sector to pay for revenue stream upfront Allocation of development rights Future property rights assist private sector to finance transport development now PAGE 23
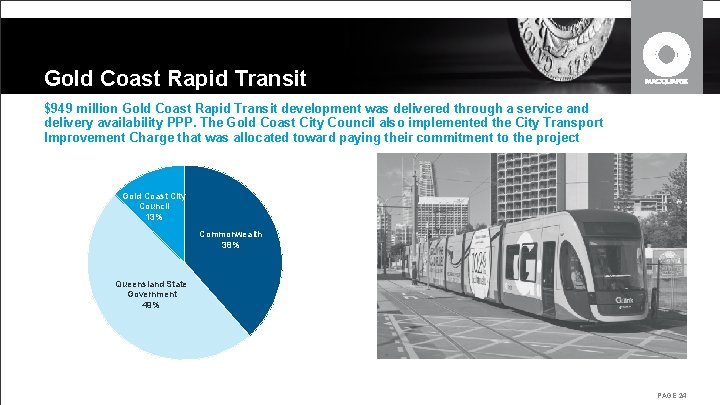
Gold Coast Rapid Transit $949 million Gold Coast Rapid Transit development was delivered through a service and delivery availability PPP. The Gold Coast City Council also implemented the City Transport Improvement Charge that was allocated toward paying their commitment to the project Gold Coast City Council 13% Commonwealth 38% Queensland State Government 49% PAGE 24
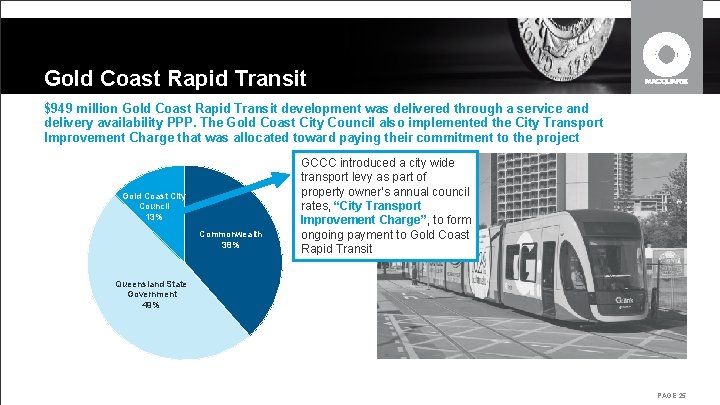
Gold Coast Rapid Transit $949 million Gold Coast Rapid Transit development was delivered through a service and delivery availability PPP. The Gold Coast City Council also implemented the City Transport Improvement Charge that was allocated toward paying their commitment to the project Gold Coast City Council 13% Commonwealth 38% GCCC introduced a city wide transport levy as part of property owner’s annual council rates, “City Transport Improvement Charge”, to form ongoing payment to Gold Coast Rapid Transit Queensland State Government 49% PAGE 25
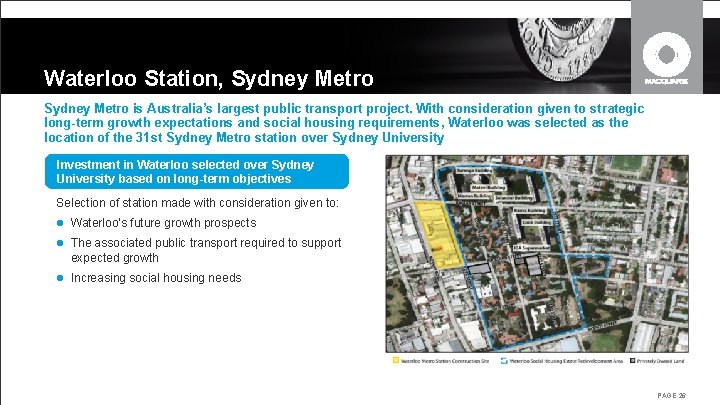
Waterloo Station, Sydney Metro is Australia’s largest public transport project. With consideration given to strategic long-term growth expectations and social housing requirements, Waterloo was selected as the location of the 31 st Sydney Metro station over Sydney University Investment in Waterloo selected over Sydney University based on long-term objectives Selection of station made with consideration given to: Waterloo’s future growth prospects The associated public transport required to support expected growth Increasing social housing needs PAGE 26
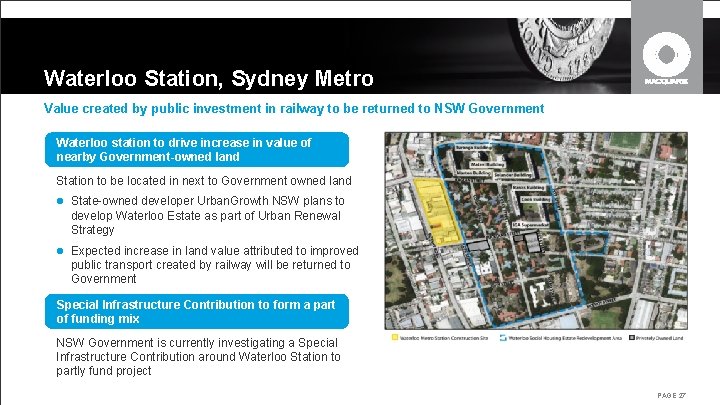
Waterloo Station, Sydney Metro Value created by public investment in railway to be returned to NSW Government Waterloo station to drive increase in value of nearby Government-owned land Station to be located in next to Government owned land State-owned developer Urban. Growth NSW plans to develop Waterloo Estate as part of Urban Renewal Strategy Expected increase in land value attributed to improved public transport created by railway will be returned to Government Special Infrastructure Contribution to form a part of funding mix NSW Government is currently investigating a Special Infrastructure Contribution around Waterloo Station to partly fund project PAGE 27
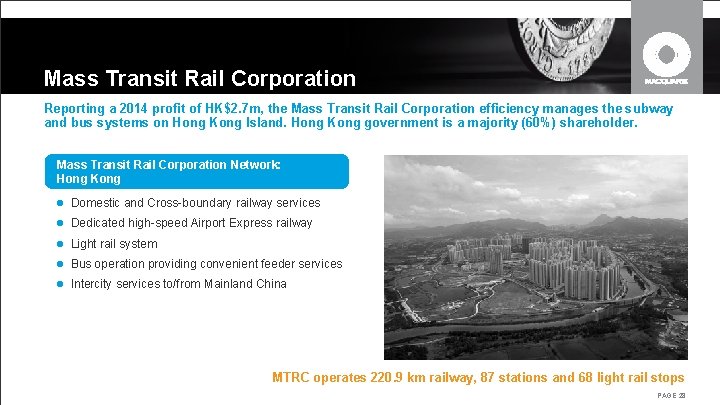
Mass Transit Rail Corporation Reporting a 2014 profit of HK$2. 7 m, the Mass Transit Rail Corporation efficiency manages the subway and bus systems on Hong Kong Island. Hong Kong government is a majority (60%) shareholder. Mass Transit Rail Corporation Network: Hong Kong Domestic and Cross-boundary railway services Dedicated high-speed Airport Express railway Light rail system Bus operation providing convenient feeder services Intercity services to/from Mainland China MTRC operates 220. 9 km railway, 87 stations and 68 light rail stops PAGE 28
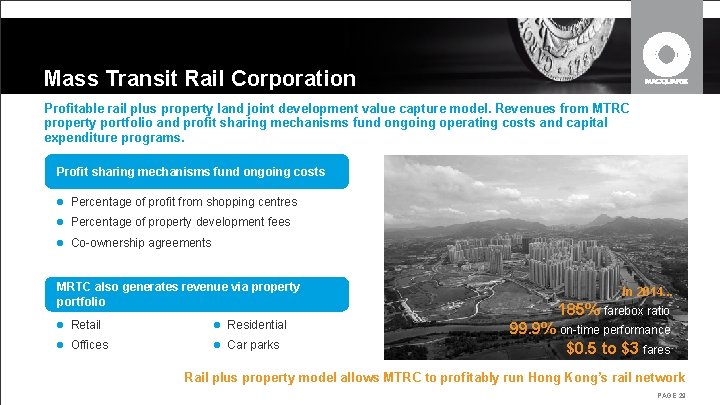
Mass Transit Rail Corporation Profitable rail plus property land joint development value capture model. Revenues from MTRC property portfolio and profit sharing mechanisms fund ongoing operating costs and capital expenditure programs. Profit sharing mechanisms fund ongoing costs Percentage of profit from shopping centres Percentage of property development fees Co-ownership agreements MRTC also generates revenue via property portfolio Retail Residential Offices Car parks In 2014. . . 185% farebox ratio 99. 9% on-time performance $0. 5 to $3 fares Rail plus property model allows MTRC to profitably run Hong Kong’s rail network PAGE 29
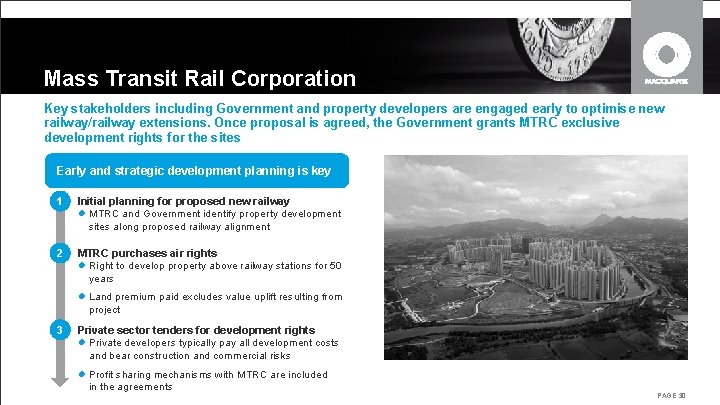
Mass Transit Rail Corporation Key stakeholders including Government and property developers are engaged early to optimise new railway/railway extensions. Once proposal is agreed, the Government grants MTRC exclusive development rights for the sites Early and strategic development planning is key 1 Initial planning for proposed new railway MTRC and Government identify property development sites along proposed railway alignment 2 MTRC purchases air rights Right to develop property above railway stations for 50 years Land premium paid excludes value uplift resulting from project 3 Private sector tenders for development rights Private developers typically pay all development costs and bear construction and commercial risks Profit sharing mechanisms with MTRC are included in the agreements PAGE 30
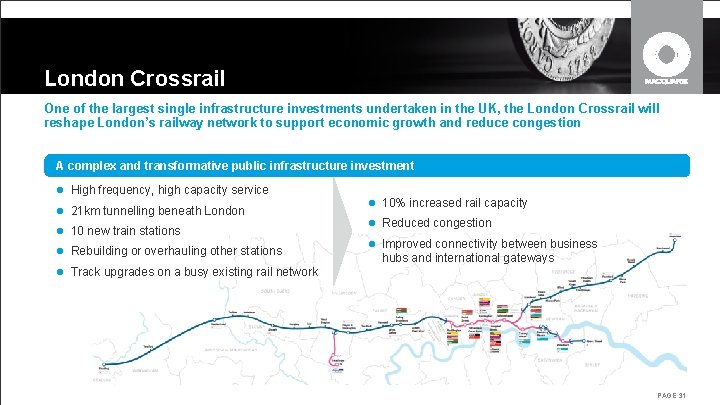
London Crossrail One of the largest single infrastructure investments undertaken in the UK, the London Crossrail will reshape London’s railway network to support economic growth and reduce congestion A complex and transformative public infrastructure investment High frequency, high capacity service 21 km tunnelling beneath London 10 new train stations Rebuilding or overhauling other stations 10% increased rail capacity Reduced congestion Improved connectivity between business hubs and international gateways Track upgrades on a busy existing rail network PAGE 31
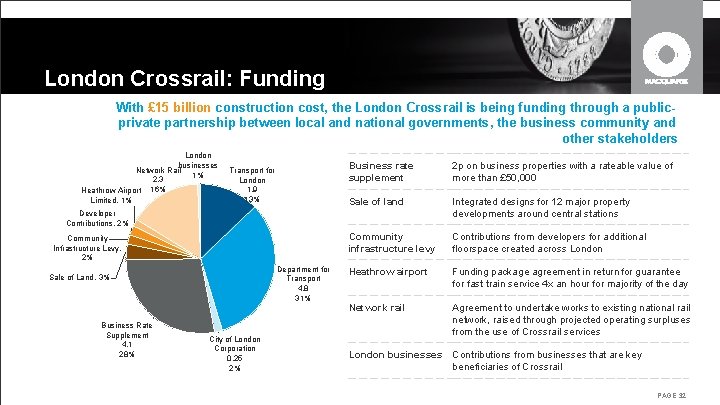
London Crossrail: Funding With £ 15 billion construction cost, the London Crossrail is being funding through a publicprivate partnership between local and national governments, the business community and other stakeholders London businesses Network Rail 1% 2. 3 Heathrow Airport 16% Limited, 1% Transport for London 1. 9 13% Business rate supplement 2 p on business properties with a rateable value of more than £ 50, 000 Sale of land Integrated designs for 12 major property developments around central stations Community infrastructure levy Contributions from developers for additional floorspace created across London Heathrow airport Funding package agreement in return for guarantee for fast train service 4 x an hour for majority of the day Network rail Agreement to undertake works to existing national rail network, raised through projected operating surpluses from the use of Crossrail services London businesses Contributions from businesses that are key beneficiaries of Crossrail Developer Contributions, 2% Community Infrastructure Levy, 2% Department for Transport 4. 8 31% Sale of Land, 3% Business Rate Supplement 4. 1 28% City of London Corporation 0. 25 2% PAGE 32
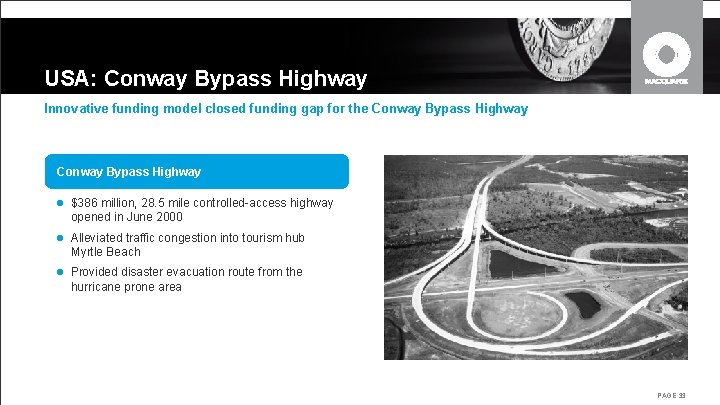
USA: Conway Bypass Highway Innovative funding model closed funding gap for the Conway Bypass Highway $386 million, 28. 5 mile controlled-access highway opened in June 2000 Alleviated traffic congestion into tourism hub Myrtle Beach Provided disaster evacuation route from the hurricane prone area PAGE 33
USA: Conway Bypass Highway Innovative funding model closed funding gap for the Conway Bypass Highway Road Improvement Development Effort scheme (“RIDE”) Incorporated 2. 5% Hospitality Fee, of which 1. 5% directed to RIDE Enabled Horry County Government to raise debt from State Transport Infrastructure Bank PAGE 34