Information Visualization Information Visualization Ch 1 Stuart K

, Stuart K. Card, Jock D. Mackinlay, Ben Shneiderman")


- Slides: 21
Information Visualization
• Information Visualization (Ch. 1), Stuart K. Card, Jock D. Mackinlay, Ben Shneiderman in Readings in Information Visualization: Using Vision to Think
• Use graphics to – communicate – think
Information visualization • Medium that assemble data objects into pictures that reveal patterns.
Visualization • The use of computer-supported, interactive, visual representations of data to amplify cognition • The main goals of this insight are discovery, decision making, and explanation
Visualization • Do sophisticated algorithms make visualization obsolete? – E. g. The phone example or the stock trade. • Do we use visualization as a division of labor between what the computer is good at and what we’re good at? • Eventually, if the goal is clear can’t we program the computer to attain the goal? – Does visualization then become unnecssesary?
• How do you know that temperature is more important than damage location?
• Knowledge crystallization implies visualization is the end product, rather than discovery. • Is there a maximum amount of data that can be conveyed? A maximum number of variables?
• information workspace” and “visual knowledge tools” levels; however we are lacking at utilizing “infosphere”-type visualizations. My understanding is that the infosphere level refers to visualizations which display aggregate data from the web or corporate networks for example –> essentially the “infosphere” is an alternative way to browse information across sites / information provide
• Instead of a visualization that makes one or two points very obvious (ie. focusing on transforming the data to make in depth analysis easier), is there a way to create a visualization that makes recognizing many different vectors easy, with each one not having very much depth?
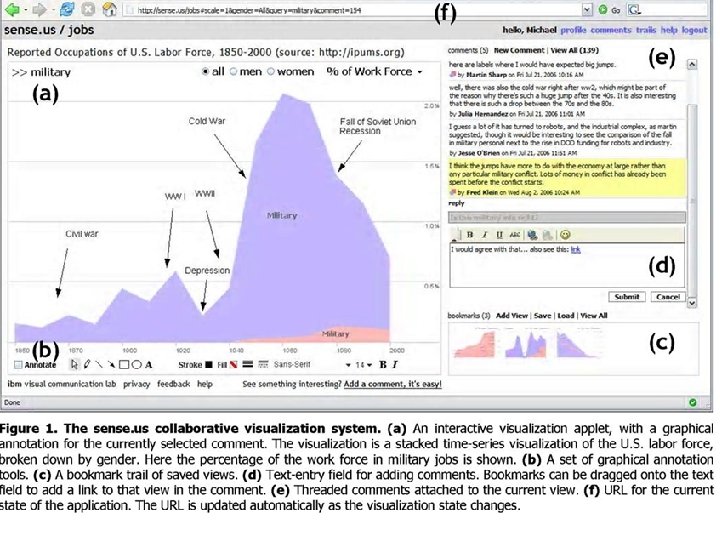
sense. us Voyagers and Voyeurs: Supporting Asynchronous Collaborative Information Visualization
Information Visualization • Information visualization leverages the human visual system to improve our ability to process large amounts of data. • Extends cognition or sensemaking to social process
• Hypothesizes that doubly-linked discussion interface would make the visualization a social place • Goals: – To understand emergent usage patterns ins social data analysis – To learn how well the various features of the system supported this analysiss – Extend past work with a comprehensive design for asynchronous collaboration around interactive data visualizations
• Do people socializing spend more time in deeper analysis and asking questions?
• Is there a difference between socializing and collaborating? – Collaborate: to work jointly with others or together especially in an intellectual endeavor – Work: to fashion or create a useful or desired product by expending labor • If so, which one does this paper address?
• In the job study, is it realistic that they have no purpose? Why do people browse if they don’t have a purpose? • Are the users doing what they think the researchers expect them to do?
• What would happen in a company if this were sales data and they needed to decide on where to market new products? • Would people be less or more collaborative? • If this were campaign workers deciding where to campaign?
Accuracy • Is there wrong insight? E. g. was the operative definition correct? • People said they learned something, but did they learn the “truth” or did they learn things that were “false”? • Is good data visualization unbiased? – Does socializing infoviz bias? • Does socializing create false gossip or wikipedia?
• What are the next research steps?