Infographics to Engage Enrich and Empower Students and


- Slides: 47
Infographics to Engage, Enrich, and Empower Students and Teachers TESOL 2017 International Convention & English Language Expo Seattle, Washington, USA Melojeane Zawilinski & Jolene Jaquays University of Michigan - Flint March 24, 2017
Overview This session demonstrates the three-step approach to using infographics in the classroom: • engaging in information • enriching visualization literacy • using and creating powerful infographics in classroom instruction
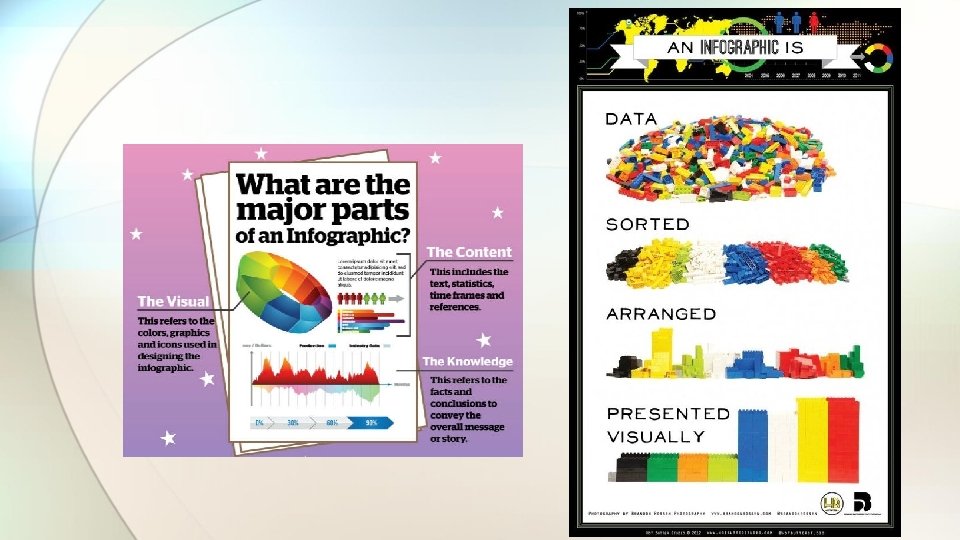
What Are Infographics? Infographics are visual representations of large amounts of data. They “should be viewed as complex, stand-alone texts, not simply a text feature or graphic element” (Davis and Quinn, 2013).
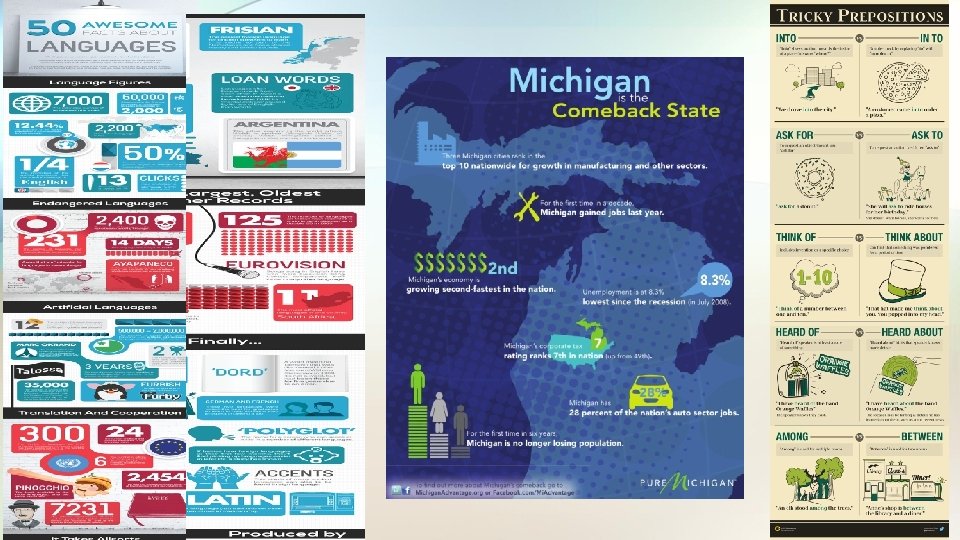
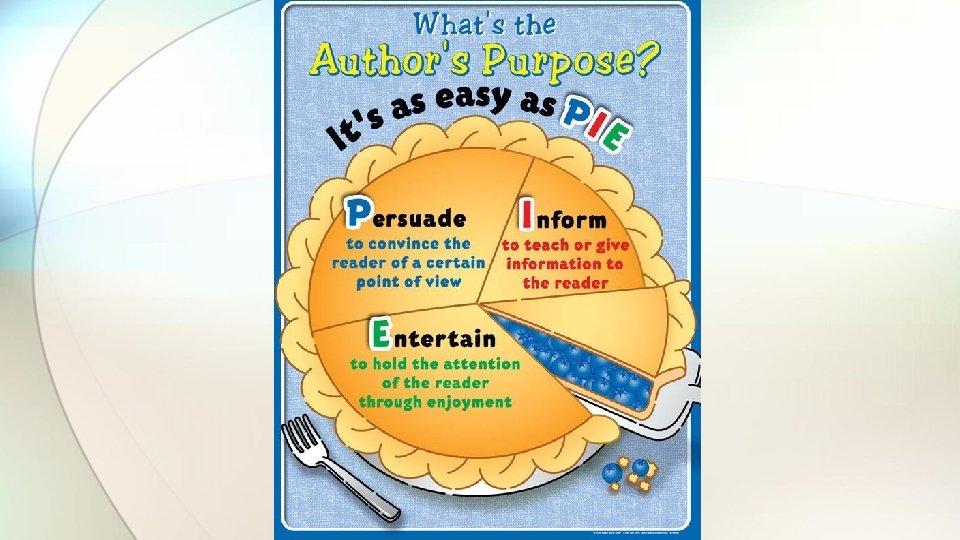
Sample Infographics • What common elements do you notice? Discuss with the person next to you.
Key Components of Infographics 1. The story / purpose 2. Data 3. Copy / Text 4. Design Colors Fonts Symbols 5. Graphs and Charts http: //www. envisionup. com/ask-the-envision-gurus/5 -keyelements-of-a-successful-infographic/
Types of Text on Infographics • Title • Introduction • Section Subheadings • Chart and Graph Labels • Data explanations • Sources and Footnotes • Supporting Narrative
Why are Infographics Relevant NOW? • Marketing • Internet • Informational materials (brochures, flyers, posters, etc. ) • Textbooks • Resource / Reference materials • Standardized Exams – IELTS (writing prompt 1)
How We Implement Infographics 1. As sources of information about writing 2. As speaking and writing prompts 3. As digital projects of visualized research and presentations 4. As an enrichment component for reading comprehension
https: //www. youtube. com/watch? v=9 c. O 1 a_k. Lur 8 If the world were a 100 people … Producing Original Infographics I. Visually-based Projects: Timelines! Life is Like a Roller Coaster Ride Project A. Poster Board B. Digital Timeline II. Digital Written Production of Simple Research A. Individually produced infographics B. Group Work and Presentation https: //muse. jhu. edu/article/589987/summary ( scholarly studies on visually-based infographic self-representations)
Why Timelines ? • Personal • Simple • Classic • Visual • Versatile
Timelines and Digital Visualization
Life Is Like a Roller Coaster Ride https: //www. youtube. com/watch? v=To 3 juj. Fzw. Hg
Digital Timeline in Excel
Life is Like a Roller Coaster Ride
Student Writing Sample #1 • • I was born on June 17, 1992. I started school in 1992. The first day was hard for me. The year 2010 was dark for me and my family because my grandmother died. She was very close for us. My life became better in 2013 because my nephew was born that year, and I traveled to Turkey. I got engaged in 2015. Then I got married in 2016 and traveled to USA. I am studying at ELP right now.
Student Sample Writing #2 • Coco was born in 1883, she is French. Her real name is Gabrielle Bonheur. She was going to write about her life when her mother died. She had learned the art of sewing when she was six years old. When Gabrielle was 12, her mother died. She was a singer before opening her first clothes shop in 1910. After she made women’s clothes, she made perfume. She died on January 10, 1971.
Steps in Infographics Production 1. Familiarize students with infographics Photo credit: visual. ly
Steps in Infographics Production 2. Select an Infographic-friendly topic or a Popular Theme *Music *Sports *Cars *Holidays
Steps in Infographic Production 3. Begin the Drafting Process by Hand
Steps in Infographic Production 4. Choose the Right Template or Software *Apps *Internet websites http: //piktochart. com https: //onepagelove. com/tag/infographics http: //www. infographicsshowcase. com/ http: //www. edudemic. com/how-classroom-project-infographic/
Steps in Infographic Production 5. Refine Content and Design
Steps in Infographic Production 6. Share and Critique * Share with each other in class * Invite a guest judge * Present to another class as live audience for presentation * Display for voting * Use rubrics for assessment
Modifiable Rubric
School-wide Presentations/Voting
Student-Produced Infographics
A Teacher-Made Infographic
Feedback from Students
Feedback from Teachers and Supervisors • This is so intriguing…. I can’t wait to use it in my classroom. -Emily Feuerherm, Assistant Professor, UM-Flint Classroom Teacher, UMAD, Mexico
Infographics Resources and Tools • Kathy Schrock’s seven-step guide for creating infographics is a simple, but thorough summary of the process that is ideal as an assignment handout. • Piktochart is a Web-based infographic software that has a vast selection of themes, graphics, and easy-to-use editing tools. The service is free to get started, then offers special pricing for educators. • Hubspot offers five free, fully customizable Power. Point templates with which to create infographics. • Easel. ly is another Web-based infographic tool that gives users 12 complimentary templates to start. The templates are customizable and allow users to add their own graphics with one click
Websites to Find Infographics • http: //larryferlazzo. edublogs. org/ • http: //www. infographicsshowcase. com/ • http: //infosthetics. com/ • http: //www. dailyinfographic. com/ • http: //www. teachersfirst. com/spectopics/infographics. cfm • https: //www. pinterest. com/eslkids/esl-infographics/ • https: //www. pinterest. com/visualoop/recyclinginfographics/
Lesson Plan Overview
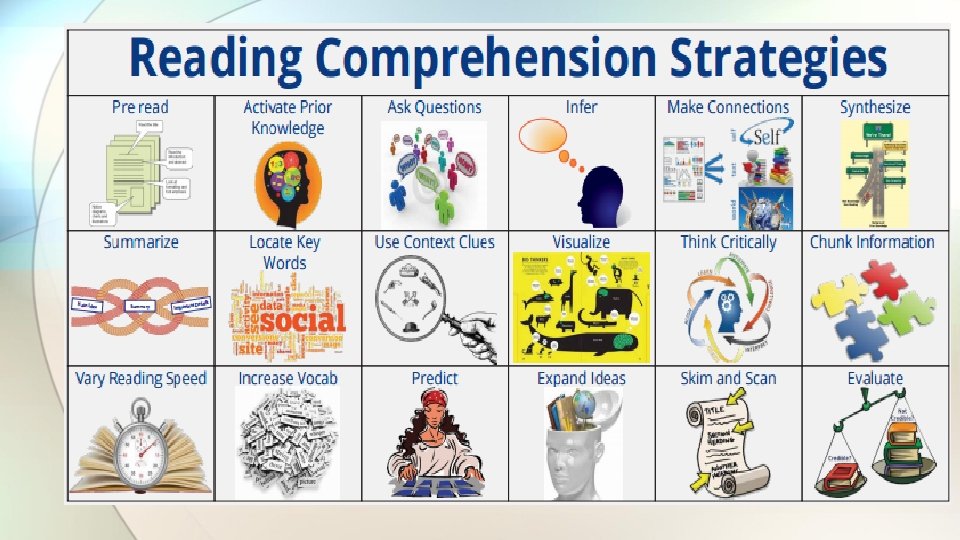
Infographics about Reading…
Infographics about Writing…
Infographics about Writing…
Steps to Write about Infographics INTRODUCTION • Step 1 – Read the title and labels on the infographic (think of synonyms). Write the introductory sentence. Start by stating exactly what the infographics shows. OVERVIEW • Step 2 – Analyze the information and look for overall trends Describe the info as precisely as possible. BODY • Step 3 – Plan your body paragraphs (one paragraph for each main trend) • Step 4 – Choose the most important details that will support your statement of main trends CONCLUSION • Step 5 – Conclude by restating the main trend(s) in different words • Step 6 – Proofread (grammar, organization, coherence, content)
UM – Flint Short Term STEM students
Why Do Digital Natives Need Infographics • http: //neomam. com/interactive/13 reasons/
Caveats and Cautions
Audience Feedback: Can you add any more other alternatives and avenues for infographics? Please add to this list. • Add as an appendix to a research paper • Tech- savvy book report • Advertisement • Syllabus (for teachers)
Websites to Create Infographics • http: //www. edudemic. com/how-classroom-project-infographic/ • http: //piktochart. com • https: //venngage. com • https: //www. canva. com/create/infographics
Any Questions? jjaquays@umflint. edu zawimelo@umich. edu http: //jjaquays. edublogs. org/