
Infographics Piktochart Canva Nickolas Falk Priddy Library The

Infographics: Piktochart & Canva Nickolas Falk Priddy Library - The Universities at Shady Grove University of Maryland Libraries
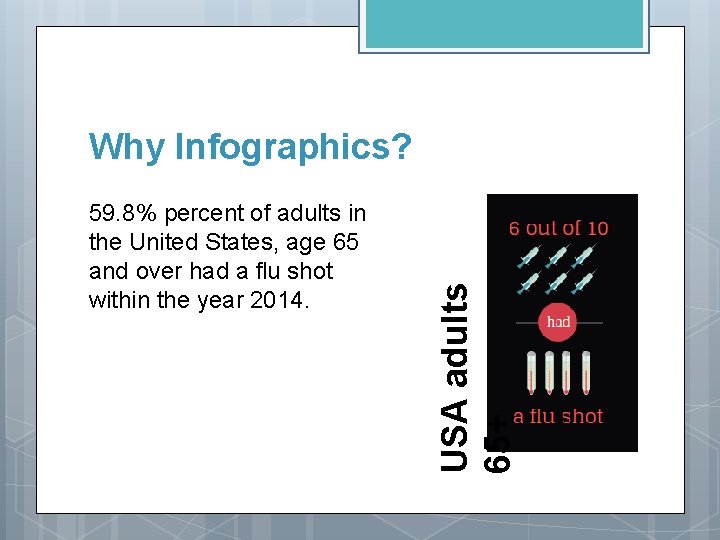
59. 8% percent of adults in the United States, age 65 and over had a flu shot within the year 2014. USA adults 65+ Why Infographics?

Learning Piktochart & Canva Piktochart Blog Canva Tutorials Subscribe! Tutorials https: //piktochart. com/blog/ https: //designschool. canva. com/tut orials/ The 5 -Minute Tutorial Similar layout to Piktochart https: //piktochart. com/blog/how-tocreate-infographic-in-5 -minutes/

Teaching Piktochart & Canva Piktochart Canva Ideas for Classroom Implementation Premade Workshops and Lesson Plans https: //piktochart. com/blog/categor y/education/ https: //designschool. canva. com/te aching-materials/
Design Principles • Simple, uncomplicated content and design • Do not overuse colors • Use good data • A few simple guidelines…
Hierarchy
Color
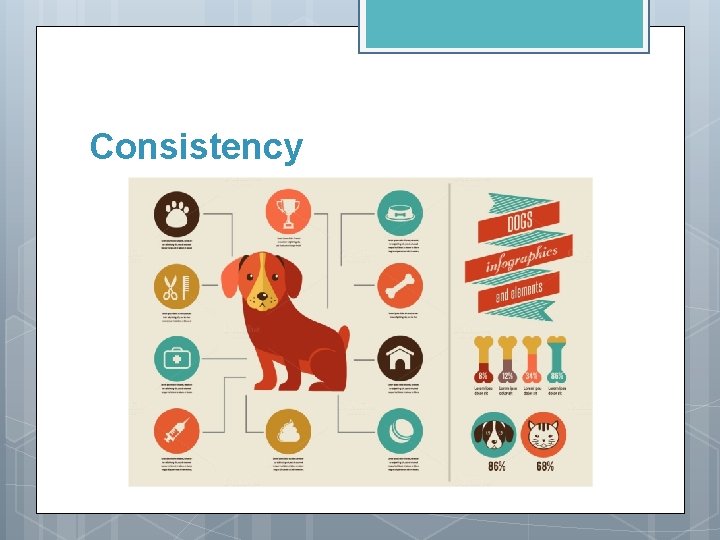
Consistency
Let’s Talk About Data Higher Education Institutions are now starting to purchase data sets. Government agencies publish data for free online. Journals are a great source to search for data or visualize their findings in your work.

Other Resources Our Lib. Guide http: //libguides. shadygrove. umd. edu/Priddy. Library. Worksh ops/infographics

Let’s Keep in Touch! nfalk@umd. edu 301 -738 -6224
- Slides: 11