INFO 300 Operations Management Module 9 Statistical Quality


 • Processes usually exhibit some variation in their output •")


 Specification control limits exceed process limits (for improved process)")


")
 Plot the individual sample proportions,")

")


 Curves • Graphical display of sampling plans – are unique for")


- Slides: 30
INFO 300 Operations Management Module 9: Statistical Quality Control Prof. Ram B. Misra
Learning Objectives 1. Understand the concept of process capability - explain how to measure process variation - calculate process capability 2. Determine if a process is under control using statistical control charts 3. Analyze the quality of batches of items using statistics 2
Statistical Quality Control (SQC) • Processes usually exhibit some variation in their output • This variation could be of two types: Assignable variation • Variation that is caused by factors that can be identified and managed • Assignable • Random • Statistical tools used to detect if the variation is under control Common variation • Variation that is inherent in the process itself 3
Variation Calculation • 4
INFO 300 Operations Management Module 9 a: Process Variation and Process Capability Prof. Ram B. Misra
Process Capability • The ability of a process to consistently produce a good or deliver a service with a low probability of generating defect • Specification limits – range of variation in the product or service that is considered acceptable; EX, 10 cm +- 0. 02; meaning the dimension could be in the 9. 98 – 10. 02 range. • Process control limits – range of variation that a process is able to maintain; Ex. 10 cm +- 0. 01; meaning the process is producing products in 9. 99 and 10. 01 range. • Process is capable when the values of the mean and the standard deviation of the process are such that the upper and lower control limits are within the specification limits 6
Process Capability – Example Lower process control limit Upper process control limit Process control limits exceed specification limits – process is not capable of meeting requirements Exhibit 10. 9 7
Process Capability – Example (2) Specification control limits exceed process limits (for improved process) – process is capable of meeting requirements Exhibit 10. 9 8
Process Capability – Example Process mean is shifted Exhibit 10. 10 9
Process Capability Index, Cpk • Cpk must be equal to 1 or larger. • Lower than one indicates process is not capable • Higher than 1 indicates process is capable. • Higher the better. 10
Process Capability Index New Cutting Machine New process mean x =. 250 inches Process standard deviation s =. 0005 inches Upper Specification Limit =. 251 inches Lower Specification Limit =. 249 inches Cpk = minimum of Cpk = = 0. 67 (. 251) -. 250 , (3). 0005. 0015 . 250 - (. 249) (3). 0005. 0015 Process is not capable.
INFO 300 Operations Management Module 9 b: Statistical Process Control Prof. Ram B, Misra
Statistical Process Control Procedures • Concerned with monitoring quality while the product or service is being produced • Statistical process control (SPC) - testing a random sample of output from a process to determine whether the process is producing items within a preselected range • Variables – characteristics that are measurable • Attributes – quality characteristics that are classified as either conforming or not conforming to specifications 13
Process Control Charts – Examples Exhibit 10. 11 14
Process Control with Attribute Measurements – p-Charts • Used when an item (or service) is either good or bad (a “yes” or “no” decision) 15
Creating p-Charts Calculate the control limits (UCL and LCL) Plot the individual sample proportions, the average of the proportions, and the control limits 16
Process Control with Attribute Measurements – p-Charts Example 10. 3 Exhibit 10. 12 17
Process Control with Attribute Measurements – c-Charts • Used when an item (or service) may have multiple defects • Distribution for the c-chart is Poisson (normal approximation is used 18
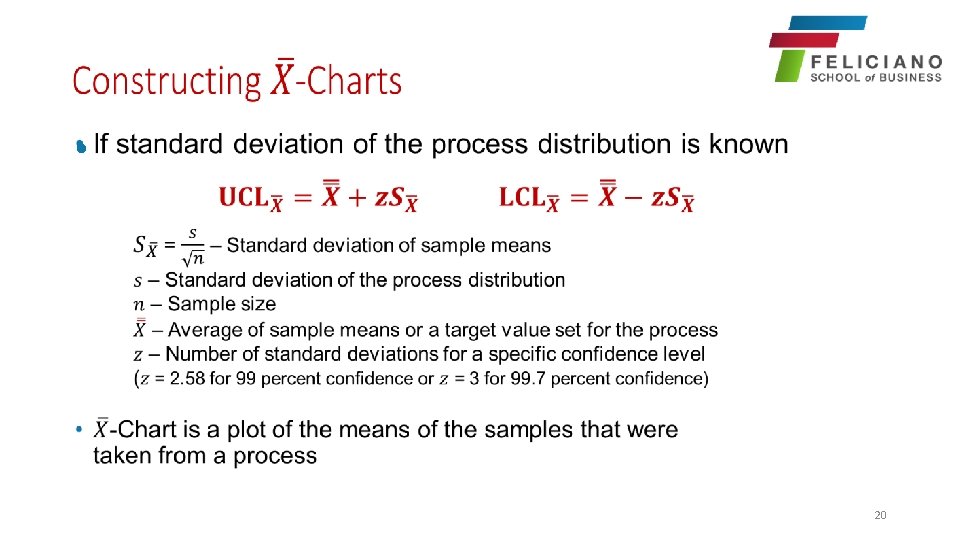
• Variables sampling involves measuring a quantifiable attribute such as weight, length, diameter, etc. • Preferable to keep small (usually 4 or 5 units) • Size of samples • Preferable to keep small (usually 4 or 5 units) • Number of samples • Once chart set up, each sample compared to chart • Use about 25 samples to set up chart • Frequency of samples • Tradeoff between cost of sampling and benefit of adjusting the system • Control limits • Generally use z = 3 (99. 7% of samples are expected to fall within control limits) 19
• R-Chart is a plot of the average of the range within each sample • Range – difference between the highest and the lowest numbers in that sample 21
Exhibit 10. 13 22
Exhibit 10. 15 23
INFO 300 Operations Management Module 9 c: Acceptance Sampling Prof. Ram B. Misra
Acceptance Sampling • Performed on goods that already exist to determine what percentage of the products conform to specifications • Executed through a sampling plan • Results include accept, reject, or retest • Sampling plan is defined by • n – the number of units in the sample • c – the acceptance number • The acceptance number denotes the maximum number of defective items that can be found in the sample before the lot is rejected 25
Acceptance Sampling – Four Factors • Values for n and c are determined by the interaction of four factors that quantify the objectives of the product’s producer and its consumer Acceptable quality level (AQL) • Maximum acceptable percentage of defectives defined by producer Lot tolerance percent defective (LTPD) • Percentage of defectives that defines consumer’s rejection point (producer’s risk) • The probability of rejecting a good lot (consumer’s risk) • The probability of accepting a bad lot 26
Operating Characteristic (OC) Curves • Graphical display of sampling plans – are unique for each combination of n and c • Illustrate the probability of accepting lots with varying percentage of defectives • Shape the OC curve – it should be steep in the region of most interest (between the AQL and LTPD) – vary n and c • The effects of lot size – has relatively little effect on the quality of protection 27
Operating Characteristic Curve Example 10. 7 Exhibit 10. 17 28
Ethics and Quality Management ► ► Operations managers must deliver healthy, safe, quality products and services Poor quality risks injuries, lawsuits, recalls, and regulation Ethical conduct must dictate response to problems All stakeholders must be considered
Summary In this module, we learned : 1. How to determine process capability, 2. How to analyze process quality using control charts 3. How to analyze the quality of batches of items using statistics 30