Influence of volcanic eruptions on the bidecadal variability

Influence of volcanic eruptions on the bi-decadal variability in the North Atlantic Didier Swingedouw, Pablo Ortega, Juliette Mignot, Eric Guilyardi, Valérie Masson-Delmotte, Myriam Khodri, Paul Butler

Can we use paleoclimate to understand recent variability? 100 years of instrumental data is a too short timeline to understand decadal variability High temporal resolution for the proxy records Use models to bridge the gap between time periods Communication between model and data people


Decadal predictions need initial conditions Reconstructions Obs. (Huck et Nudged IPSLCM 5 A-LR simulations nudged or free (with observed external forcings) Two reconstructions of the Historical AMOC Agreement between nudged and reconstructions Synchronisation also in the historical simulations Swingedouw et al. , Clim. Dyn. 2013 Control

20 -yr cycle in IPSL-CM 5 A-LR Sea ice cover -, SLP- negative delayed feeedback EGC + 10 yrs 3 yrs T, ’ S’ + 5 yrs convection + 2 yrs 9 yrs AMOC + Escudier et al. Clim. Dyn. 2013

20 -yr cycle in IPSL-CM 5 A-LR Sea ice cover -, SLP- negative delayed feeedback EGC + 10 yrs 3 yrs T, ’ S’ + 5 yrs convection + 2 yrs 9 yrs AMOC + Mt Agung eruption Escudier et al. Clim. Dyn. 2013

Impact of volcanic forcing Climatic index Agung 15 yrs Model free 1963 1982 1991 2006 Time

Impact of volcanic forcing Climatic index El Chichon Agung 15 yrs 1963 1982 1991 2006 Time

Impact of volcanic forcing Climatic index El Chichon Pinatubo Agung Destructive interference? 15 yrs 1963 1982 1991 2006 Time

Experimental design IPSL-CM 5 A-LR climate model 5 -member historical ensemble (natural and anthropogenic forcing) 5 -member initialised ensemble nudged with SST anomalies 5 -member sensitivity ensemble without Pinatubo CMIP 5 ensemble Comparison with existing in situ SSS data A last millennium perspective Agung Pinatubo El Chichon

AMOC response in the IPSL-CM 5 A-LR model The sensitivity ensemble without Pinatubo shows a larger decrease in the early 2000’s as compared to historical ensemble Then a partial recovery in the late 2010’s Including NAO effect increase the agreement with reconstruction of AMOC variations
 AMOC response")
Is it real? Model dependent Need for other lines of evidences (observations!) AMOC response 15 years after the eruption is the key assumption that needs to be tested!
 from CMIP 5 WITHOUT")
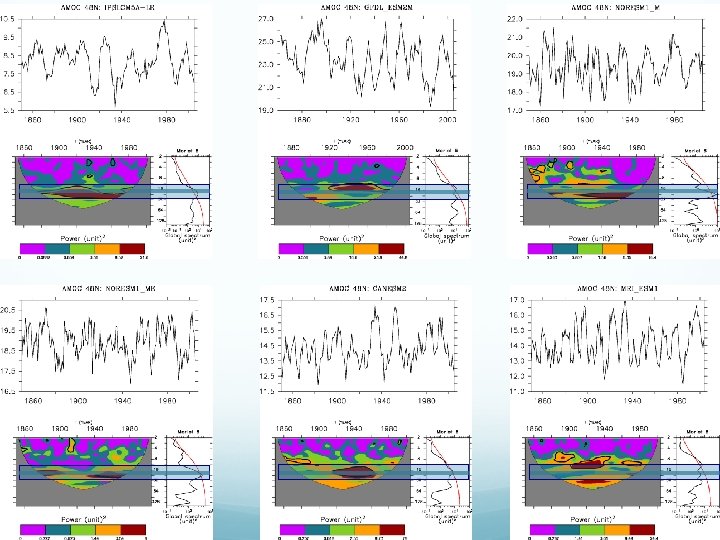
CMIP 5 multi-model confirmation? 11 individual models (not different versions) from CMIP 5 WITHOUT IPSLCM 5 A The ensemble mean shows a maximum in AMOC just before 1980 as in IPSLCM 5 A Large spread 5 models show a maximum of energy in the 12 -30 yrs spectral band. Strong similarity of the response in these 5 models

Comparison with in situ salinity data Labrador data available from Canadian Bedford Institute of Oceanography Reconstruction of SSS variability over the east subpolar gyre (Reverdin 2010) Agreement between historical and data (20 -yr sliding window correlation, p<0. 1) An explanation for two GSAs!

A last millennium perspective Last millennium simulation from IPSLCM 5 A-LR (Khodri et al. in prep. ) We select all the volcanoes from preindustrial era that are larger than Agung but not too large 5 -member ensemble

Greenland data EOF 1 of Compilation of 6 ice cores reconstructing Greenland δ 18 O over the last millennium (Ortega et al. in press) EOF 1 δ 18 O ice cores 20 -yr preferential variability in the PC 1

Link Greenland-AMO Greenland as high-resolution proxy of the AMO? AMOC leads AMO in the model by 5 -10 years
: bivalve as a very high")
A paleo-indicator of the AMOC? Butler et al. (2013): bivalve as a very high temporal resolution proxy Not SST, rather related to nutrient supply Pseudo-proxy approach: is there a link between nutrient and AMOC in the model north of Iceland? AMOC leads nutrient supply north of Iceland by 1 -3 years Butler et al. 2013

Last millennium perspective We select the same timeseries following volcanoes in data and SST in the North Atlantic from the model Significant correlation both in model and data, following AMOC variations by around 5 years

Conclusions Volcanic eruption precedes an AMOC maximum by around 10 -15 years Effect of Pinatubo: destructive interference! NAO still explains large amount of variance as compared to this mechanism of 20 -yr cycle excitation by volcanoes Impact of volcanoes also very clear in a 5 -member CMIP 5 ensemble Consistent with in situ salinity in the subpolar gyre And data of Greenland Iceland over the last millennium large body of evidences confirming potential reality of these processes in response to volcanic eruptions

Thank’s! didier. swingedouw@u-bordeaux 1. fr

Background t 2 m skill without trends: years 2 -5 AMOC: a key player for decadal prediction Volcanic impact on AMOC (Ottera et al. 2011, Iwi et al. 2010, Mignot et al. 2011, Zanchettin et al. 2012…) Bi-decadal variability in the North Van Oldenborgh et al. 2012 Atlantic: in several models (Frankcombe et al. 2010…) and in data (Chylek et al. 2011, Sicre et al. 2008, Divine et al. 2006… ) Zanchettin et al. 2012

Comparison model-proxies Pseudo-proxy approach: is there a link between nutrient and AMOC in the model? AMOC leads nutirent supply with 1 -3 years

A conceptual model to explain AMOC variability in the model We propose a conceptual model based on: harmonic response to volcanoes Linear response to radiative forcing (GHG)

Comparison with IPSL-CM 5 -LR We compare the conceptual model and the simulations a=0. 6 ; b=1. 5 D=50 yrs

Role of observed NAO in the initialised ensemble We add a term corresponding to observe NAO to explain AMOC variation in the initialised simulation a=0. 6 ; D=50 yrs b=1. 5 ; c=2

Scaling of the model We use a cost function based on MSE between IPSL model and toy model

Comparison of the AMOC forcings NAO forcing is larger than that from volcanoes Over the period 1973 -2018: Std volcanoes =0. 54 Sv Std NAO = 0. 93 Sv

Mechanisms Had. ISST Pinatubo decreases SST and increases sea-ice cover in the GIN Seas This interferes with variability of the EGC This removes the salinity anomalies in the Labrador Sea And then the convection and the AMOC variations Historical No Pinatubo

Convection sites response

In situ Labrador Sea variation • The 1985 GSA is clearly different from 1972 and 1993 in the sense that there is a subsurface positive anomaly • Belkin et al. (1998): two modes of GSA, one remote (Artic) and one more local (1980 s) Central Labrador Sea from 1949 to 2005 (updated from Yashayaev et al. , 2003) Source IPCC 2007 GSA GSA

Temperature propagation toto
 from CMIP 5 WITHOUT IPSLCM")
A multi-model confirmation? 11 individual models (not different versions) from CMIP 5 WITHOUT IPSLCM 5 A-LR The ensemble mean shows a maximum in AMOC just before 1980 as in IPSLCM 5 A-LR Large spread 5 models show a maximum of energy in the 12 -30 yrs spectral band. Strong similarity of the response in these five models

Pinatubo direct impact

Agung: 1963 -1965 Is volcanic impact on the NAO so clear in data? Pinatubo: 1991 -1993 El Chichon: 1982 -1984
- Slides: 36