
Inflation The Quest For Stability Daily Dad Joke
Inflation: The Quest For Stability

Daily Dad Joke: What did the ocean say to the shore? Nothing, it just waved.
Class Objectives �Understand what inflation is and its impact on society- who it benefits and who it hurts �Understand how government policies can impact inflation
Inflation is “ a rise in the general level of prices” Today We’re Going Over: �Is Inflation good or bad? �Who does inflation help or hurt?
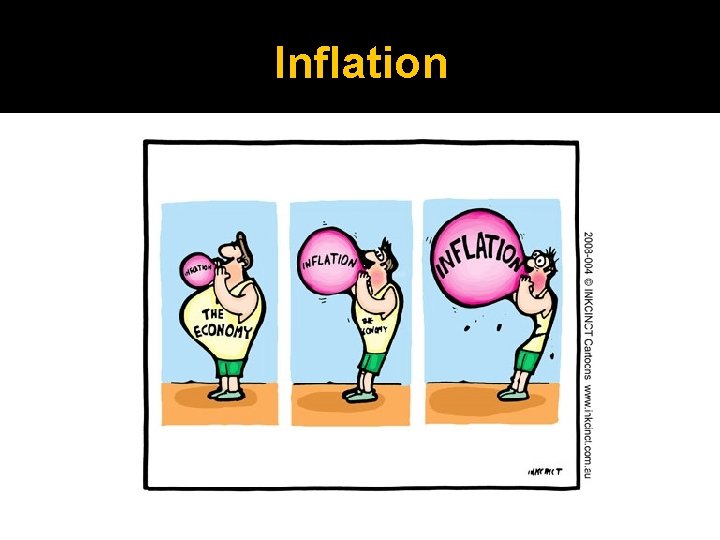
Inflation

German Hyperinflation
Zimbabwean Hyperinflation �A few years ago, prices in Zimbabwe were doubling every 24 hours or so. They were in 2 nd place all time with regard to inflation. Hungary still has the fastest inflation rate, as at their peak, prices were doubling every 16 hours. This meant that the price of a movie ticket ($8) purchased today would rise to $32, 768 in 8 days. � Marginal Revolution: Zimbabwe Inflation: The End of the Story
Measuring It �Consumer Price Index (CPI) �Price of a market basket of 300 goods and services. �Set 1982 -84 as the base at 100. �Inflation is measured as change in index from one period to the next.
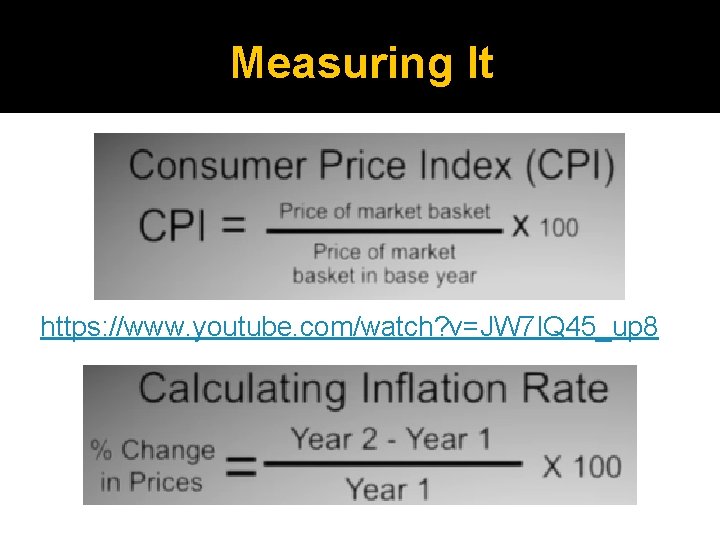
Measuring It https: //www. youtube. com/watch? v=JW 7 IQ 45_up 8
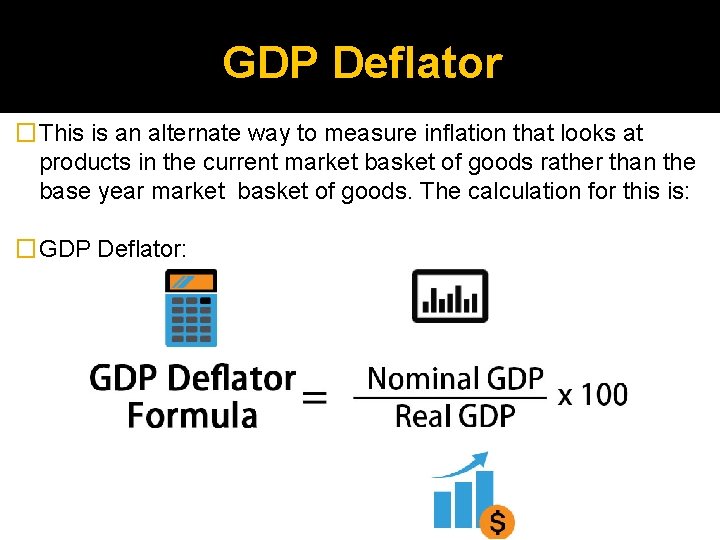
GDP Deflator �This is an alternate way to measure inflation that looks at products in the current market basket of goods rather than the base year market basket of goods. The calculation for this is: �GDP Deflator:
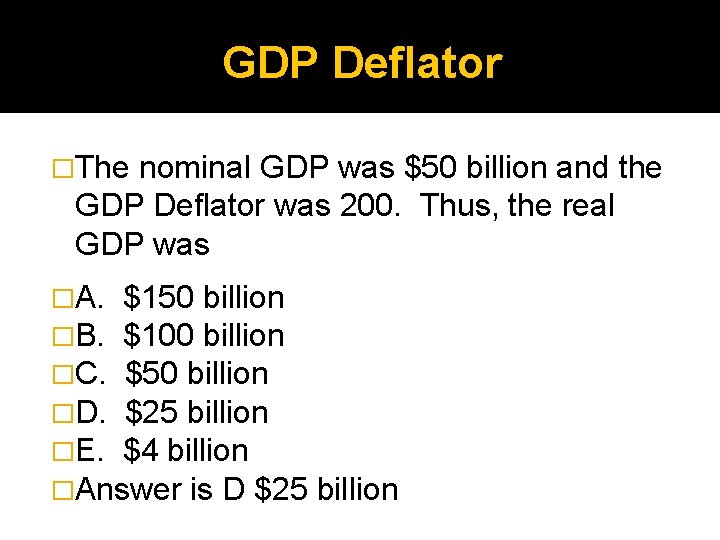
GDP Deflator �The nominal GDP was $50 billion and the GDP Deflator was 200. Thus, the real GDP was �A. $150 billion �B. $100 billion �C. $50 billion �D. $25 billion �E. $4 billion �Answer is D $25 billion
Long Term �Long term average Inflation is a little below 3% per year. �One of the key roles of the Federal Reserve is to keep price stability in the US! � How would you define stability?
Many, Many Questions � Why do we care what the inflation rate is? � How important is what we measure to calculate inflation? � What demand supply determinants does the inflation rate impact? � Can prices go up too slowly? Is it a problem if prices fall? � At what point are prices rising too fast?
Winners �Debtors �Government
Neutral Flexible Income: COLA Teachers Social Security Minimum Wage
Losers �Savers �Creditors �Fixed (Lenders) Income or Pension Recipients �Taxpayers
Causes of Inflation � What causes inflation? Based on your knowledge of the determinants of supply and demand, what would cause an increase in price levels? � Increase � Too in demand much money in circulation � Expectation that prices will increase in the future � Increases in raw material costs � Increases in labor costs
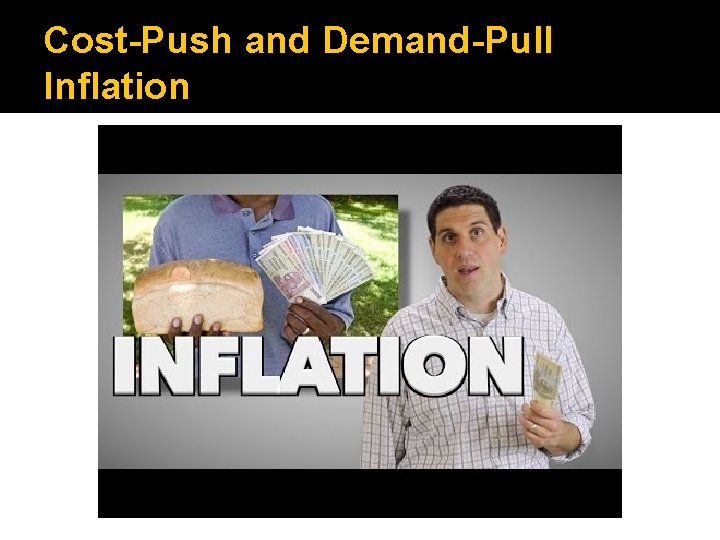
Cost-Push and Demand-Pull Inflation
Demand Pull Inflation �Driven by Demand Issues. �Increase in prices caused by excessive spending (demand) �This is generally caused by the Federal Reserve issuing too much money �Draw a supply/demand graph showing this.
Cost Push Inflation �Driven by Supply issues �Rising cost of input items (those resources that go into the production of goods and services) �The average cost of output goes up, and thus Pushes up the costs in the economy. �Determinants of Supply- Draw Curves
Core Inflation �Inflation after food and energy prices are removed �Food and energy tend to be volatile; policy makers do not want to be misled by changes in price that may be temporary.
Criticisms of CPI � Does not account for consumers ability to substitute goods- this tends to overstate inflation � Core inflation does not include food and energy prices � Accounting for technological change tends to understate the true increase in prices � Basket of goods chosen does not represent all consumers equally
Phillips Curve �The Phillips Curve relates the annual rates of inflation and the annual rates of unemployment. �Inverse relationship between Inflation and Unemployment �Lower unemployment causes prices to increase; higher unemployment causes prices to decline
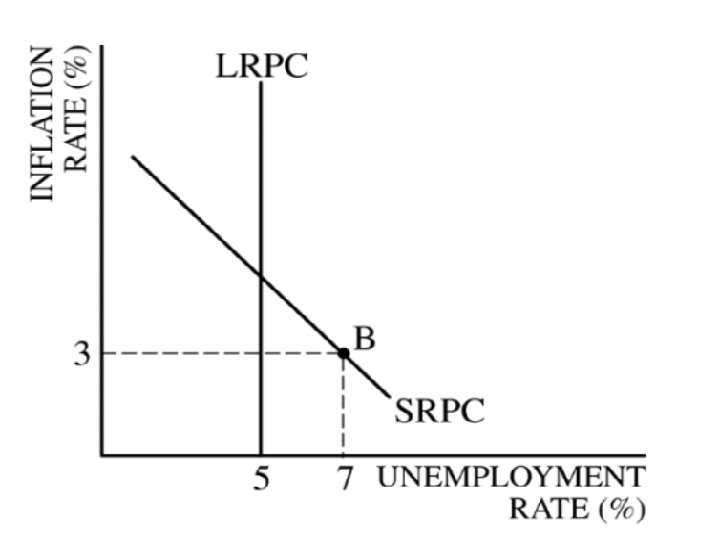
Phillips Curve �When it was first discovered, it was assumed that there was a stable and predictable relationship between these two statistics. �Now it is assumed that in the short term that this relationship holds- there is an inverse relationship between inflation and unemployment.
Short Term Relationship � An increase in Aggregate Demand (Demand for the entire economy) will increase real output (GDP); This will reduce the unemployment rate. As the unemployment rate falls below the natural rate, excessive spending causes demand pull inflation. � However, this relationship does not always hold. In the late 1990’s, significant productivity growth increased Aggregate Supply (Supply for the entire economy). Thus this change offset the increases in Demand.
Stagflation �A combination of high unemployment and high inflation. These were seen in the 1970’s and early 1980’s. � This change was caused by adverse Aggregate Supply Shocks- a sudden, large increase in resource costs. � The shift in the Aggregate Supply curve to the left will increase prices and decrease output (GDP). �A supply shock will cause the Phillips Curve to shift to the right.
Long Run Phillips Curve � In the long-run, the Phillips will be vertical (essentially). It’s like an x= function on a graph. � Changes in output and employment are continual. As demand grows, there is an increase in employment and prices. As prices increase, workers look to renegotiate their contract to increase their pay (keep up with price increases). This reduces profits and causes the Aggregate Supply Curve to shift to the left, thus reducing employment. � In the long run, full employment output corresponds with unemployment at the natural rate. This shows that in the long run, any rate of inflation is consistent with the natural rate of unemployment. � Princeton Review has good information about this on pages 237 -239.
Exit Card If there is time
Effects of Inflation � For this exercise, the class is to be divided into 8 groups- by table. Each group is to determine if you are able to maintain your standard of living given the changes in the economy. For each change, you are to determine the impact on your standard of living-does it improve, stay the same or go down? Another way to look at this is what is the impact on your personal demand curve? I will be manipulating the economy to impact each of your situations.
Change and Impact � The economy is starting to grow. The tax cuts are starting to take effect, as well as the infrastructure spending that has increased with the latest budget deal in early 2018. Economy is improving � As the economy improves to full capacity, there start to be too many dollars chasing too few goods. As demand heats up this causes an increase in prices (demand increase, supply stays the same). Overall, the level of inflation jumps from 2% to 5% by the end of 2018.
Change and Impact � The tariffs put in place cause reaction by other countries. Tariffs and other trade sanctions are imposed which drives up the prices of goods and services. The dollar starts to decline which further impacts prices, especially for oil. � The supply shocks to the economy start to take their toll. As prices increase and wages are not able to keep up, the quantity demanded of goods declines. Thus, companies have to start laying off employees. Unemployment goes from 4% to 10% by the end of 2019. The base cost of goods also continues to rise. Most prominent among those increases are in energy and food. Given these two, inflation continues to rise and goes to 12% in the second half of 2019.
Change and Impact � The Fed decides that they need to fight inflation more aggressively. They pursue a policy that significantly restricts the money supply. For 2020, this starts to work and inflation falls back to 7. 5%. However, this keeps unemployment high, and it actually increases in 2020 to 14%. � Expectations are that in 2021, the Fed will continue to aggressively fight inflation, and that the inflation rate will fall further to 5%. However, the Fed is not as aggressive this year as they try to fight the high unemployment level as well. Thus inflation only falls to 7% in 2021 but unemployment declines to 8%.
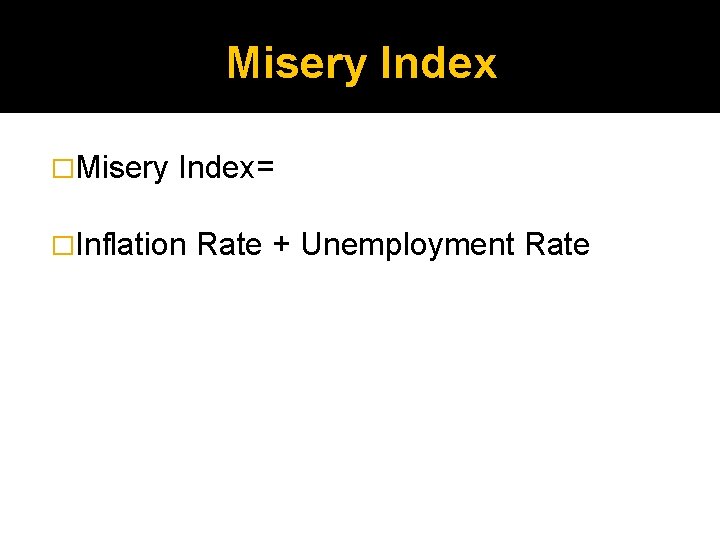
Misery Index �Misery Index= �Inflation Rate + Unemployment Rate
Conclusions �Were you able to maintain your standard of living? �What ways did you benefit? �What ways did you lose?
- Slides: 35