Inferential Statistics Chapter 6 Inferential Statistics Making inferences


: Those chosen are more intelligent Population 1 > Population 2")

 sample scores on the comparison distribution at")


- Slides: 24
Inferential Statistics Chapter 6 Inferential Statistics: Making inferences about populations based on samples
Chapter Outline Hypothesis-Testing The Core Logic of Hypothesis Testing The Hypothesis-Testing Process
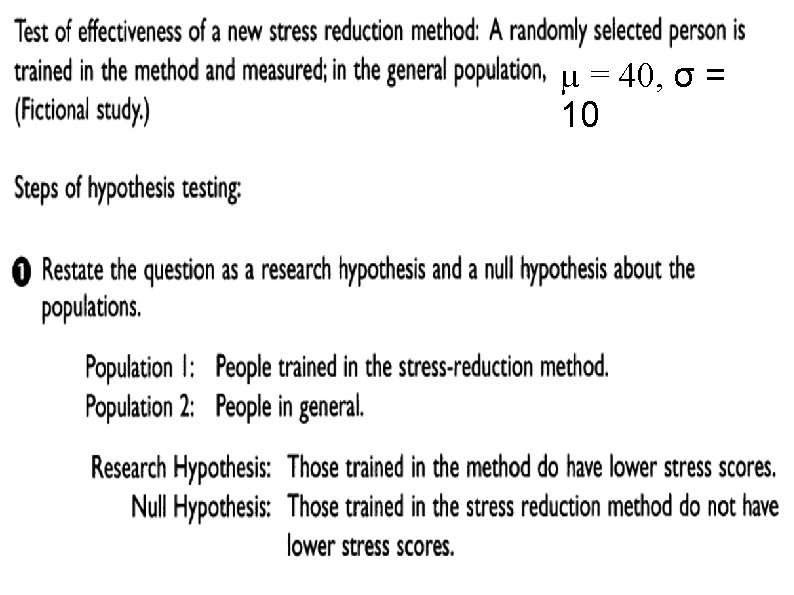
Hypothesis Testing A systematic procedure for deciding whether the results of a research study (using a sample) supports a hypothesis that applies to a population (probabilistic conclusion) Hypothesis: A predictions tested in a research study based on informal observation or theory e. g. , Concrete words are remembered better than Abstract Theory: a set of principles that attempts to explain one or more facts, relationships, or events usually gives rise to various specific hypotheses that can be tested in research studies e. g. , Dual-coding Theory: Concrete 2 codes & Abstract 1 code
Hypothesis Testing Researchers want to draw conclusions about a particular population e. g. , Babies in general (POPULATION) Conclusions will be based on results of studying a sample e. g. , One baby (SAMPLE)
The Core Logic of Hypothesis Testing • Researchers must spell out predictions in advance (A priori) to conclude that their hypothesis was supported. • Establish the p-value (a priori) of getting our experimental results if our hypothesis was not true. • Researchers attempt to answer these questions: • What is the probability of getting our research results if the opposite of what we predicted were true? • If it is highly unlikely that we would get our research results if the opposite of what we are predicting were true: • We can reject the opposite prediction. • If we reject the opposite prediction, we can accept our prediction. • Then we conduct the experiment.
Hypothesis Testing Principle Are there differences between men and women in regards to IQ tests? Make a prediction by answering question! Research Hypothesis or Alternative Hypothesis (HA) IQM ≠ IQW or IQM < IQW or IQ M > IQ W H 1: Predicted Relationship between the populations There is a difference: IV affecting the DV!
Hypothesis Testing Principle Are there differences between men and women in regards to IQ tests? Make a prediction by answering question! Null Hypothesis (H 0): IQ Men = IQ Woman H 0: Relationship between populations that is the opposite of H 1 (Scientific Hypothesis) The opposite of what you predict It simply says: No change, nothing happens, hence NULL
Hypothesis Testing Rejecting vs. Fail to Reject the Null Hypothesis Always test the null hypothesis: Test the opposite of what you predict. Fail to Reject (Accept) H 0: No difference, inconclusive Reject H 0: There is a difference, H 1 is supported You want to always REJECT H 0
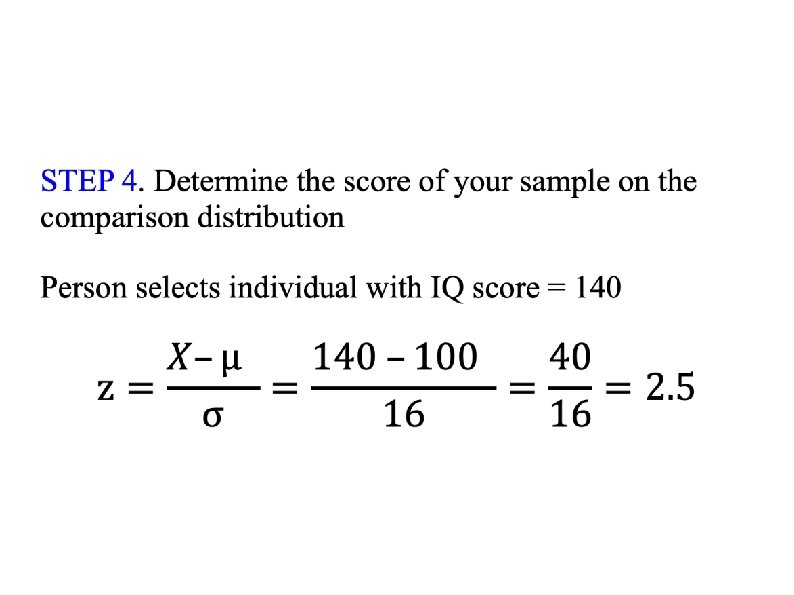
Example A person says that she can identify people of above average intelligence with her eyes closed. Is this true? STEP 1. Define populations and reframe question into research and null hypothesis about populations. Population 1: People chosen by woman with her eyes closed (THIS IS THE SAMPLE) Population 2: People in general (Comparison Distribution, KNOWN)
Research Hypothesis (H 1): Those chosen are more intelligent Population 1 > Population 2 Population 1 has a higher mean intelligence than population 2 Null Hypothesis (H 0): Those chosen are not more intelligent Population 1 = Population 2 Population 1 does not have higher mean intelligence than population 2.
STEP 2. Define Characteristics of the comparison distribution Known normal distribution with µ = 100; σ = 16
STEP 3. Determine cutoff (chosen a priori) sample scores on the comparison distribution at which the null hypothesis is rejected ( p =. 05) p <. 05 or top 5% : (50% -5% = 45%) Z = 1. 64
STEP 3. Cutoff sample score on the comparison distribution at which the null hypothesis is rejected. p =. 05 indicates that assuming the H 0 is true there is a 5% probability of obtaining a score as extreme, or more extreme, than our study prediction. This indicates our study prediction is unlikely when the starting assumption (H 0) is true. If the p-value is low enough (<. 05) we reject our starting assumption or the null hypothesis
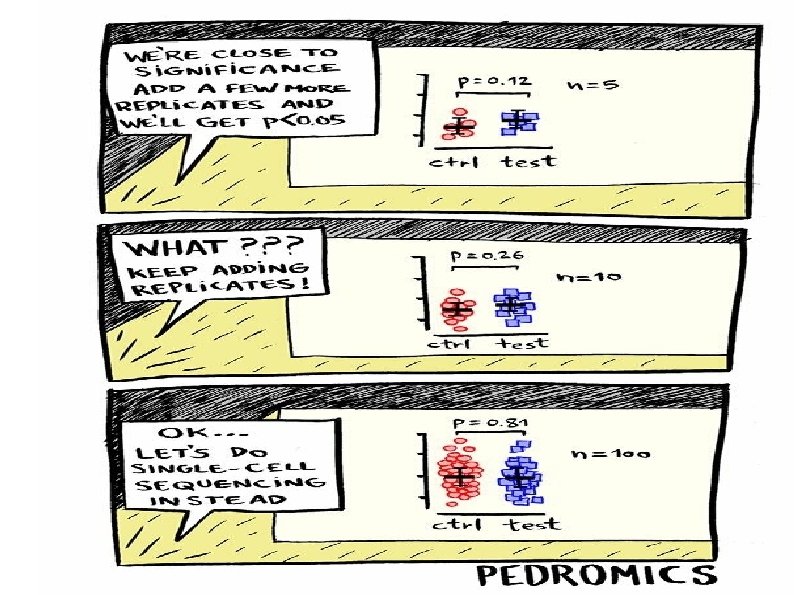
Probability and Significance p <. 05 This result is so extreme or so unusual (top 5%) that chance cannot explain it Null Hypothesis Significance Testing (NHST)
5. Compare the scores obtained in Step 3 and 4 to decide whether to reject the null hypothesis: Score on Step 4 (Z = 2. 5) is higher than score on Step 3 (Z = 1. 64) Conclusion: Reject H 0; H 1 is supported
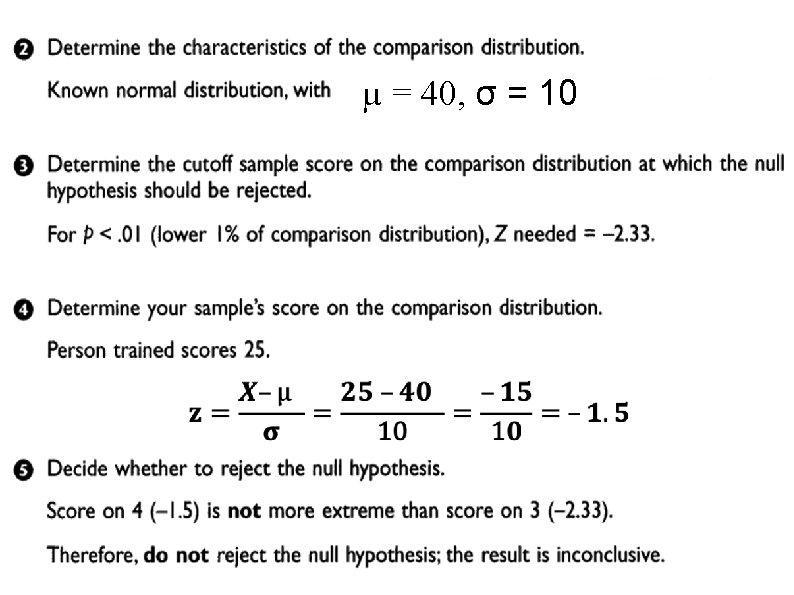
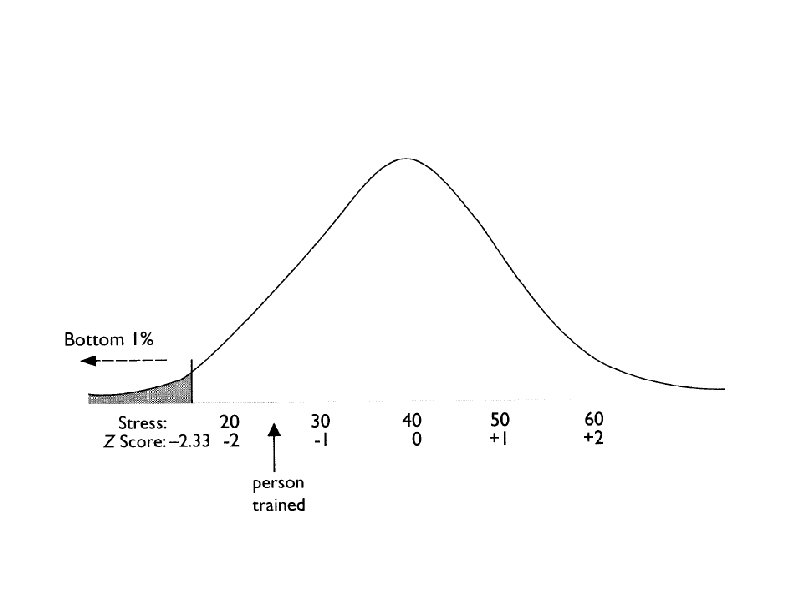
Implications of Rejecting or Failing to Reject the Null Hypothesis When you reject the null hypothesis all you are saying is that your results support the research hypothesis. The results never prove the research hypothesis or show that your hypothesis is true. Research studies and their results are based on the probability or chance of getting your result if the null hypothesis were true. When you fail to reject or accept the null hypothesis, you do not say that the results support the null hypothesis. You say that the results are not statistically significant, or that the results are inconclusive. We are basing research on probabilities, and the fact that we did not find a result in this study does not mean that the null hypothesis is true.
Significance Level Criterion as % cutoff or p value The lower the significance level, the more sure we are in rejecting H 0: Top. 01% (p <. 0001): Z score = +3. 5) The higher the significance level, less likely to deal with inconclusive results: Top 50% ( p =. 5, Z = 0) and always reject the H 0:
Significance Level Convention in Psych: p <. 01 or. 05 How results are expressed: Reject Ho: Results are statistically significant Fail to reject Ho: Results are not statistically significant
Key Points Hypothesis testing considers the probability that the results of a study could have come about even if the experimental procedure had no effect. If this probability is low, the scenario of no effect is rejected and the hypothesis behind the experimental procedure is supported. The expectation of an effect is the research hypothesis; the hypothetical situation of no effect is the null hypothesis. When a result is so extreme that it would be very unlikely if the null hypothesis were true, the null hypothesis is rejected and the research hypothesis is supported. If the result is not that extreme, the researcher does not reject the null hypothesis and the study is inconclusive. Behavioral and social scientists usually consider a result extreme enough if it is less likely than 5% that you would get that result if the null hypothesis was true. A significance level of 1% is also commonly used in research. The cutoff percentage is the probability of the result being extreme in a predicted direction in a directional or onetailed test. The cutoff percentages are the probability of the result being extreme in either direction in a nondirectional or two-tailed test. Steps for hypothesis testing are: Restate the question as a research hypothesis and a null hypothesis about the population. Determine the characteristics of the comparison distribution. Determine the cutoff sample score on the comparison distribution at which the null hypothesis should be rejected. Determine your sample’s score on the comparison distribution. Decide whether to reject the null hypothesis.