Inferential Biostatistics Dr Naresh Manandhar Associate Professor Department

Inferential Biostatistics Dr. Naresh Manandhar Associate Professor Department of Community Medicine
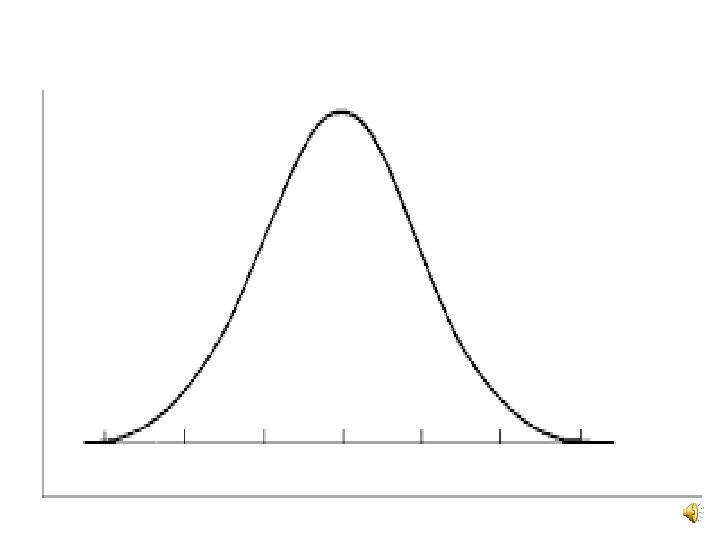
Distribution Properties Ø Bell Shaped Ø Smooth and symmetric Ø Mean=Median=Mode Ø Unimodal")
Normal (Gaussian)Distribution Properties Ø Bell Shaped Ø Smooth and symmetric Ø Mean=Median=Mode Ø Unimodal Ø The peak of curve decline on either side towards base line and never touch base line. Ø The point of inflexion is at the distance (mean± Sd).

Normal Curves

Area Properties Mean± Sd – 68. 27% Mean-SD Mean+SD

Mean± 2 Sd – 95. 45% Mean-2 SD Mean+2 SD

Mean± 3 Sd – 99. 73% Mean - 3 SD Mean + 3 SD

Mean± 2 Sd – 95. 27% Mean± 1. 96. Sd – 95% Mean± 3 Sd – 99. 73% Mean± 2. 58. Sd – 99% Normal Range = Mean± 1. 96 Sd

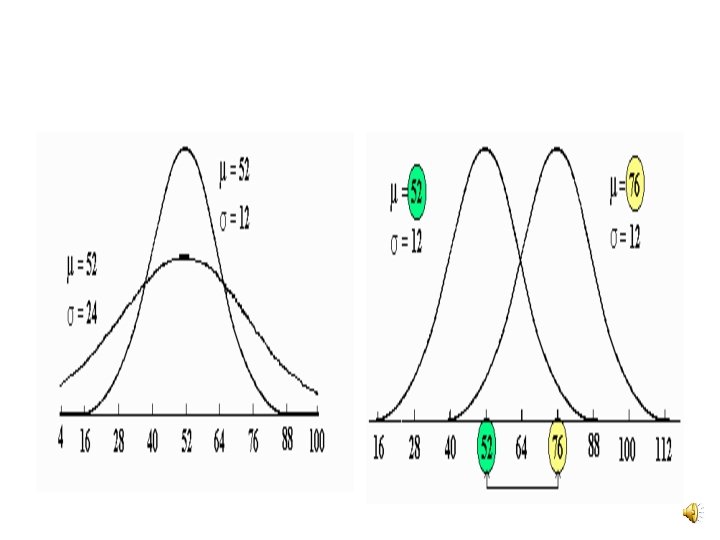
Normal Curves

Standard Normal Variable

Standard Normal Distribution Standard Normal Variable Z Mean= Zero, SD= one.

Express X into Z X 5 6 7 8 9 Z -√ 2 -1/√ 2 0 1/√ 2 √ 2 (Z-Z) 2 2 1/2 0 1/2 2 Mean= 35/5=7 Mean= 0/5=0 sd= √ 10/5= √ 2 sd= √ 5/5=1
 of 500 persons is 22. 5 kg/m")
Example: The mean Body Mass Index (BMI) of 500 persons is 22. 5 kg/m 2 with standard deviation of 1. 27 kg/m 2. If the BMI follows normal distribution, calculate i. Normal range of BMI ii. Number of persons BMI will lies between 22 to 24 kg/m 2 and iii. Percent of persons BMI will be less than 21 kg/m 2.

Given: Mean= 22. 5 kg/m 2, Sd =1. 27 kg/m 2 No. of person=500 Normal Range = Mean± 1. 96 Sd Normal range= 22. 5 ± 1. 96 x 1. 27 Taking –ve sign, Lower range= 22. 5 – 2. 49 = 20. 01 kg/m 2 Taking +ve sign, Upper range= 22. 5 +2. 49 = 24. 99 kg/m 2 Hence Normal Range is 20 -25 kg/m 2

For question ii. Number of persons BMI will lies between 22 to 24 When x=22, Z 1= (22 - 22. 5)/1. 27 = - 0. 39 When x=24, Z 2= (24 - 22. 5)/1. 27 = 1. 18

Z 1=-0. 39 Z=0 Z 2=1. 18
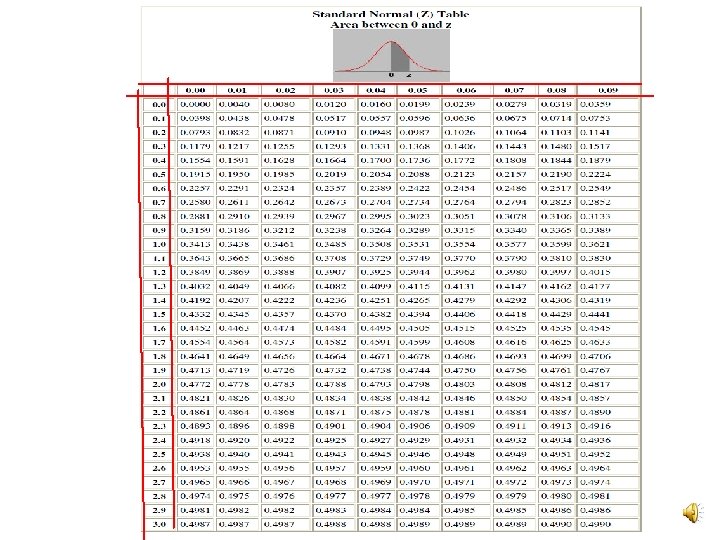

From unit normal distribution table when z 1=- 0. 39 , area under curve= 0. 1517 when z 2=1. 18 , area under curve= 0. 3810 Required area between ( z 1=- 0. 39 and z 2=1. 18) = 0. 1517 + 0. 3810 = 0. 5327 Number of persons BMI will lies between 22 to 24 kg/m 2= 0. 5327 x 500 = 226. 33 = 226 (Appx. )

For Percent of persons BMI will be less than 21 kg/m 2. When x=22, Z 3= (21 - 22. 5)/1. 27 = - 1. 18

Z 3=-1. 18 Z=0
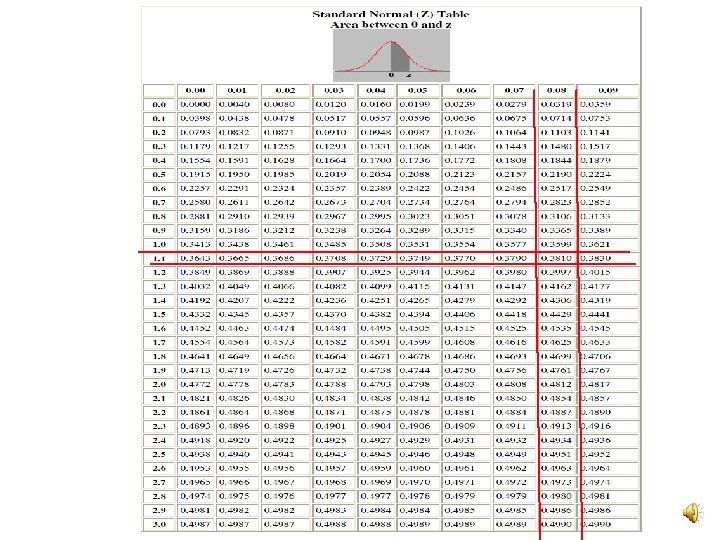

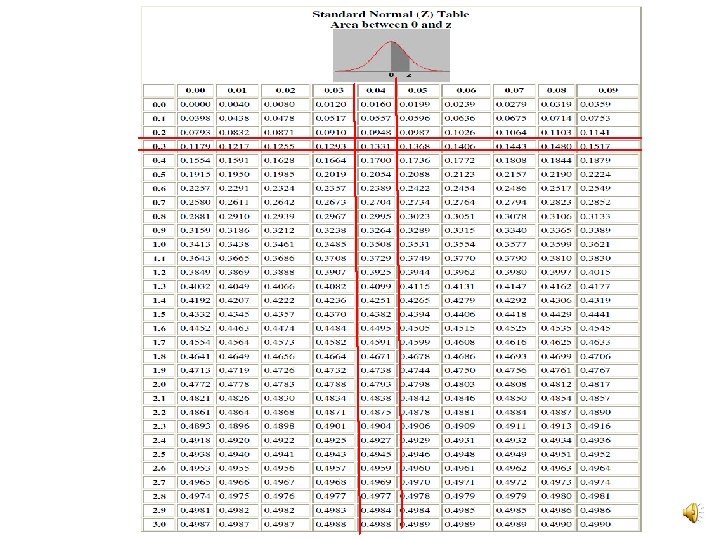
From unit normal distribution table when z 3=-1. 18 , area under curve = 0. 3810 Required area below ( z 3=- 1. 18) = 0. 5 - 0. 3810 = 0. 1190 Percent of persons BMI less than 21 kg/m 2 = 0. 119 x 100 = 11. 9%

# The mean diastolic blood pressure of 550 medical students is 85 mm of Hg with standard deviation of 7 mm of Hg. If the diastolic blood pressure follows the normal distribution, estimate i. Normal range of diastolic blood pressure ii. Number of persons diastolic blood pressure will lies between 86 to 89 mm of Hg and iii. Percent of persons diastolic blood pressure will be more than 82 mm of Hg.

# The mean menstrual cycle of 750 females is 28 days with standard deviation of 2 days. If the mean menstrual cycle follows the normal distribution, estimate i. Normal range of mean menstrual cycle ii. Number of females mean menstrual cycle will lies between 24 to 31 days and iii. Percent of persons mean menstrual cycle will be more than 32 days.

- Slides: 27