Individuals Modeling Microbial Populations Examples Challenges Dave Siegel

Individuals & Modeling Microbial Populations: Examples & Challenges Dave Siegel UC Santa Barbara

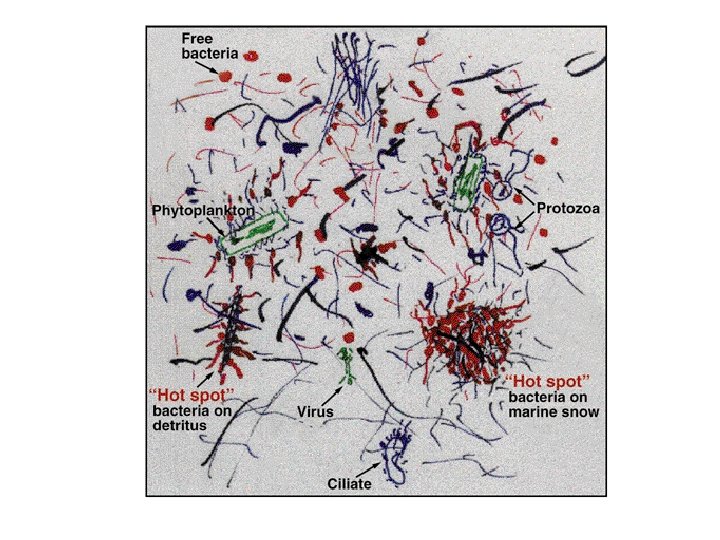
Art by Farooq Azam

Each microbe is an individual • Responds to its immediate surroundings • Can alter its local surroundings through its actions • Influence its neighbors by the transmission of its effects through the fluid media, by eating them or by being eaten

Microbes make up populations… • Populations are assemblages of individual microbes • Population dynamics is the result of many individual interactions as modified by the fluid environment surrounding them • It is a population’s trajectory in time that we want / need to know… Need to make microbial population forecasts

Microbial population forecasts • Need to know for policy seting… – Biogeochemical cycling of C, N, P, S, etc. – Occurrence of harmful algal blooms & hypoxia conditions – Transfer of NPP energy to higher trophic levels • Hopefully make these forecasts accurately • How do we use our understanding of individuals to forecast microbial populations?

Microbial population forecasts • Population dynamics gives us the classic set of tools for making forecasts • However, present techniques are limited – Simple “box” models (PZN, PZNDB, …) – Functional group approaches are promising • The “art of modeling” is how biological detail is stuffed into each “box”

Communities as collectives… • Microbial communities are the result of the collective interactions of many individuals (as modified by the fluid environment) – How do these collective enterprises work? – How do we account for individual dynamics in a population system?

Outline of talk • Discuss modeling individuals & populations • Assess scales where population theory holds • Introduce the microbial subgrid scale problem • Give example where subgrid scale processes have population level consequences • Introduce an individual based model and the problems it introduces • Suggest some future directions…

Microbial processes • Individual scale processes – Resource uptake & capture – Resource utilization – Reproduction – Other interspecific interactions (virulence, etc. ) • Population scale processes – Competition – Predation – Other interspecific interactions (…)

Modeling individuals Model individuals as discrete entities • Need to know ID & state for each individual State vector: ai(type; x, u, Qj; t) for all i & Sj(x, t) • Develop rules to predict future state of each individual & its interactions with its environs Transition rule: Dai(…) = f(ai(…), Sj(x, t), Dt) & DSj(…) = f(Sj(x, t), ai(…), …, a. N(…), Dt) • Individual based modeling (IBM)

Modeling populations Model populations as continuous fields • Define a population over a scale & report in units of [# / volume (or “BGC $”/volume)] • Develop rules to predict the future state for each population & resource in the system DPi(x, t) = f(type; P 1(x, t), …, PM(x, t), S 1(x, t), …) • Population dynamic modeling

What is the size of that volume? • Populations are continuous fields • Minimum scale of investigation must large enough to insure stable estimates of P(x, t) • Need to “count” large number of organisms • If N = 400 => Parcel scale, Lp ~ 7 P-1/3 For P = 106 ml-1 => Lp ~ 0. 7 mm ~ 700 mm For P = 1 ml-1 => Lp ~ 70 mm ~ 70, 000 mm • Only consider scales > Lp Siegel [1998] L&O, 43, 1133

What does the flow do? Smallest relevant flow scale is the Batchelor scale, LB = [D 2 n / e]1/4 Balance between fluid stretching & molecular diffusion on solute distribution LB for nitrate in seawater range from 10 -200 mm depending on e (D = 1. 4 x 10 -9 m 2 s-1) For organic solutes, LB will be even smaller And organisms can make this even smaller…

Are microbes populations? • We find that LB << Lp Flow length scales are << parcel scales Lp S(x, t) LB This does not count yet smaller solute scales imposed by individuals

Are microbes populations? • Turbulence creates solute variations on scales smaller than Lp • Violates the fluid continuum hypothesis => populations are not chemical species • Within a “population parcel” there will be fluctuations in substrate levels • Marine microbes are discrete populations

Dynamics of discrete populations • Microbes are spaced too far apart compared with variations in solute distributions • The speed at which neighboring individuals interact is important – If fast, then discreteness may not matter – If slow, then it may be critical • Important for understanding the role of individuals in competition, predation, etc. Siegel [1998] L&O, 43, 1133

How do we now model microbes? • Assume microbes are populations and fit parameter values to data • These parameters are uptake kinetics, mortality rate, etc. • Unfortunately, these are parameterizations for both biological process & discreteness • A microbial subgrid scale (SGS) problem…

Microbial SGS problems • How do processes on unresolved scales affect resolved scale processes? • In flows, small scale motions “influence” large scale motions (turbulent diffusion) • This is called a subgrid scale (SGS) problem – Leads to eddy diffusivities & closure models • A mircobial SGS model is the link between discrete & population-level descriptions

Example of a microbial SGS problem

A simple example • Illustrate role of individual scale process on population level dynamics • Resource competition among microbes • Molecular diffusivity as control parameter – Increasing diffusivity increases speed at which individuals interact & vice versa – Does the “winner” of this competition change?

Microbial resource competition • A community of N different “species” • All require substrate (S) though each “species” is slightly different (10%) • Uptake follows Michaelis-Menten kinetics • Mortality is first order • Nearly all of their internal S concentration is instantaneously remineralized (fi = 0. 99)
![Microbial resource competition Ci = concentration of nutrient in species i [m. M] Ci](http://slidetodoc.com/presentation_image/b95f475553b1821afeaf7e4a73b90ec7/image-22.jpg "Microbial resource competition Ci = concentration of nutrient in species i [m. M] Ci")
Microbial resource competition Ci = concentration of nutrient in species i [m. M] Ci = Ni * Qi = (abundance) * (cellular S) Vi = max uptake rate [d-1], Ki = ½ sat coef [m. M], mi = mortality [d-1], fi = remineralization fraction
 vary 10% from mean")
Microbial resource competition • Parameters (Vm, i, Ki, mi, Ri) vary 10% from mean • Mean [Vm, i Ki mi Ri] = [3 d-1 0. 2 m. M 2 d-1 0. 4 mm] • fi = 0. 99 (remin frac) • SCi = 1 m. M – log normal species list (N=25) Uptake [d-1] • S(t=0) = 1 m. M • Well mixed assumption S(x, t) = f(t) only Substrate [m. M]
 Winner is species 13!!")
Microbial resource competition Abundance Log 10(Abundance) Winner is species 13!!
")
Microbial resource competition Substrate SCi S Srefract Log 10(Substrate)
")
Microbial resource competition Abundance Log 10(Abundance)

Microbial assemblage amendment experiments • Filtered Sargasso Sea water + amendment • Same DOC added • FISH probes for bacterial lineages Craig Carlson– unpubl.

Diffusive “limitation” • Osmotrophs acquire resources across their cell wall • Rates of solute diffusion in water are very slow – Molecular diffusivities vary 1 x 10 -11 to 1 x 10 -7 m 2 s-1 • At steady state, a balance between nutrient uptake and diffusion within its “boundary layer” is found S(r) Diffusion Munk & Riley [1952] Pasciak & Gavis [1974] S∞ Scell Nutrient Deficit

Diffusive “limitation” • Nutrient transport can be modeled with Fick’s law • At steady state, nutrient transport across different spherical “shells” surrounding the cell is constant

Diffusive “limitation” • Diffusive transport at cell wall is then • At steady state, this balances nutrient assimilation
 • Facts about diffusive")
Diffusive “limitation” • Solve for Scell as f(uptake, diffusivity, geometry) • Facts about diffusive limitation Scell < S∞ => V(Scell) < V(S∞) (S∞ - Scell ) increases as Q & Vmax get larger (S∞ - Scell ) increases as D & Rcell get smaller

Diffusion & resource competition Same parameters modulo the addition of size & cell quota Siegel and Brzezinski, to be published someday … maybe …
")
Diffusion & resource competition Abundance Log 10(Abundance)
")
No diffusion case!! Abundance Log 10(Abundance)
 S SCi Srefract • Substrate uptake is")
Diffusion & resource competition Abundance Log 10(Abundance) S SCi Srefract • Substrate uptake is strongly reduced by diffusion limitation
 Winner is now species 10!! It was")
Diffusion & resource competition Abundance Log 10(Abundance) Winner is now species 10!! It was species 13…
 alters the population-scale")
Results of simple example • Adding an individual-scale process (diffusive limitation) alters the population-scale results • Only difference among species was cell size yet a new “winner” emerged • Diffusive limited uptake altered time courses of stock changes & nutrient drawdown • Different substrates can have different diffusivities allowing for yet different outcomes

But… • Each organism still saw the same substrate concentration - not close to Farooq’s cartoon We need to… • Understand microbial geography • Represent critical parts of organism life cycle • Allow organisms to interact with their local environ & with each other
 • Develop a spatial, discrete world Account for the organism")
Individual Based Modeling (IBM) • Develop a spatial, discrete world Account for the organism life cycle Include fluid environment connecting organisms but with much unoccupied regions to mimic the discrete ocean Contain enough organisms so experiment works Compare to a population-level dynamical model • Example – Two diatoms competing for Si. O 4

An IBM of diatom competition • Discrete analog of the chemostat equations Su Af • Solve in 3 D for 1 ml • High spatial resolution (100 x 100; Dx=100 mm) • Model the cell’s life cycle • Interaction by molecular diffusion of Si. O 4 only • Compare discrete results with chemostat equations Langston, Siegel & Brzezinski [to remain unpublished]

Computational life cycle Cells assimilate local nutrients Cells can move by sinking or swimming Nutrients diffuse by Fick’s law Cells divide when their quotas are twice a minimum Daughter cells are located randomly Death occurs randomly Dead cell nutrients are recycled locally

Example slice through domain Su Af

Example slice through domain Su

Role of diffusion Si. O 4 Su IBM Af Population Dynamics IBM results match analytical theory… On average, cells see ~Scell not something else


We have a nested SGS problems • Microbial discreteness needs to be accounted for on the scale of a population – SGS 1 Unresolved interactions among individuals affects population level change This is what I have been focused on • Solution to SGS 1… Need to compare IBM results to population level models – construct ad hoc closures Key are spatial moments of population covariances

Size matters – SGS 2 • Microbe sizes vary from 0. 1 to >100 mm, but grid scale (Dx) is 100 mm • Can’t make Dx that much smaller (computers are only so big…) • Need to correctly account for the effects that an individual imposes on its environment • Local models are required to “merge” individuals into the environment

Diversity Matters – SGS 3 • How can we model viruses & diatoms? Nvirus ~ 107 ml-1 & Ndia ~ 10 ml-1 Lp for viruses ~ 20 mm & Lp for diatoms ~ 3 cm Implies number of model grids > 104 on a side Not good, but remember Moore’s Law • This is a very hard (& good) problem (Though I think we can put it off for a bit)

Points I tried to make • Microbes are individuals & it matters – Alters interactions rates among individuals – Makes population models case specific • Resolution of this issue requires solution of the “microbial subgrid scale” problems • Provide a path for modeling microbial dynamics from “first principles”

Models and microbes • Models must be viewed as vehicles for hypothesis testing • They provide access to space / time scales far beyond present experimental means • Enable the evaluation of the importance of microbial processes • Beautiful problem with untapped potential

Implementation of this vision… • This is not a serious project – needs serious commitment (both time & $) • Microbiologists & “modelers” must work together => a social experiment The focused co-indoctrination is critical There are obvious incentives for both parties • Remember how that infinite journey starts…

Thank You!! Santa Barbara Sunset Photo: Steve Churchill
- Slides: 53