Individual Markets Demand Supply Mr Griffin AP Economics


 - is movement")


 - is movement")


- Slides: 76
Individual Markets: Demand & Supply Mr. Griffin AP Economics Montgomery High School
MARKETS DEFINED POTENTIAL BUYERS POTENTIAL SELLERS MARKETS
LAW OF SUPPLY A direct relationship exists between price and quantity supplied o. As Price Rises… …Quantity Supplied Rises o. As Price Falls… …Quantity Supplied Falls
LAW OF DEMAND An inverse relationship exists between price and quantity demanded o. As Price Falls… …Quantity Demanded Rises o. As Price Rises… …Quantity Demanded Falls
LAW OF DEMAND o Diminishing Marginal Utility
LAW OF DEMAND o Diminishing Marginal Utility • Income Effect
LAW OF DEMAND o Diminishing Marginal Utility • Income Effect • Substitution Effect
LAW OF DEMAND o Diminishing Marginal Utility o Income Effect o Substitution Effect • Demand Curve • Individual and Market Demand
DEMAND DEFINED DEMAND SCHEDULE P $5 4 3 2 1 QD Various Amounts 10 20 A Series of Possible Prices 35 55 80 …a specified time period …other things being equal
GRAPHING DEMAND Price of Corn P CORN P $5 4 3 2 1 QD 10 20 35 55 80 $5 Plot the Points 4 3 2 1 o 10 20 30 40 50 60 70 80 Quantity of Corn Q
GRAPHING DEMAND Price of Corn P CORN P $5 4 3 2 1 QD 10 20 35 55 80 $5 Plot the Points 4 3 2 1 o 10 20 30 40 5055 60 70 80 Quantity of Corn Q
GRAPHING DEMAND Price of Corn P CORN P $5 4 3 2 1 QD 10 20 35 55 80 $5 Plot the Points 4 3 2 1 o 10 20 30 40 50 60 70 80 35 Quantity of Corn Q
GRAPHING DEMAND Price of Corn P CORN P $5 4 3 2 1 QD 10 20 35 55 80 $5 Plot the Points 4 3 2 1 o 10 20 30 40 50 60 70 80 Quantity of Corn Q
GRAPHING DEMAND Price of Corn P CORN P $5 4 3 2 1 QD 10 20 35 55 80 $5 Plot the Points 4 3 2 1 o 10 20 30 40 50 60 70 80 Quantity of Corn Q
GRAPHING DEMAND Price of Corn P CORN P $5 4 3 2 1 QD 10 20 35 55 80 $5 Connect the Points 4 3 2 1 o D 10 20 30 40 50 60 70 80 Quantity of Corn Q
GRAPHING DEMAND Price of Corn P CORN P $5 4 3 2 1 QD 10 20 35 55 80 $5 4 3 2 What if Demand Increases? 1 o D 10 20 30 40 50 60 70 80 Quantity of Corn Q
GRAPHING DEMAND Price of Corn P CORN P $5 4 3 2 1 $5 QD 4 1030 2040 3 3560 Increase 2 5580 in 80+ 1 Demand o Increase in Quantity Demanded 10 20 30 40 50 60 70 80 Quantity of Corn D’ D Q
GRAPHING DEMAND Price of Corn P CORN P $5 4 3 2 1 QD 10 20 35 55 80 $5 4 3 2 What if Demand Decreases? 1 o D 10 20 30 40 50 60 70 80 Quantity of Corn Q
GRAPHING DEMAND Price of Corn P CORN P $5 4 3 2 1 $5 QD 4 10 -2010 3 3520 5540 2 Decrease 8060 in Decrease in Quantity Demanded 1 Demand o 10 20 30 40 50 60 70 80 Quantity of Corn D D’ Q
Change in Demand o Changes in Demand…shift in the curve n Increase in demand - demand curve shifts to the right n Decrease in demand curve shifts to the left
Increase in Demand curve shifts to the right D 1 Do
Decrease in Demand curve shifts to the left D 0 D 1
Change in Quantity Demanded o Change in Quantity Demanded ( Qd) - is movement along a demand curve o Changes in quantity demanded can only be caused by a change in the price of the good. • • Increase in Qd - a movement to the right along a demand curve Decrease in Qd - a movement to the left along a demand curve
P Price moves up… A decrease in quantity demanded caused by a price increase Demand Quantity demanded decreases Q
P Price moves down… An increase in quantity demanded caused by a price decrease Demand Quantity demanded increases Q
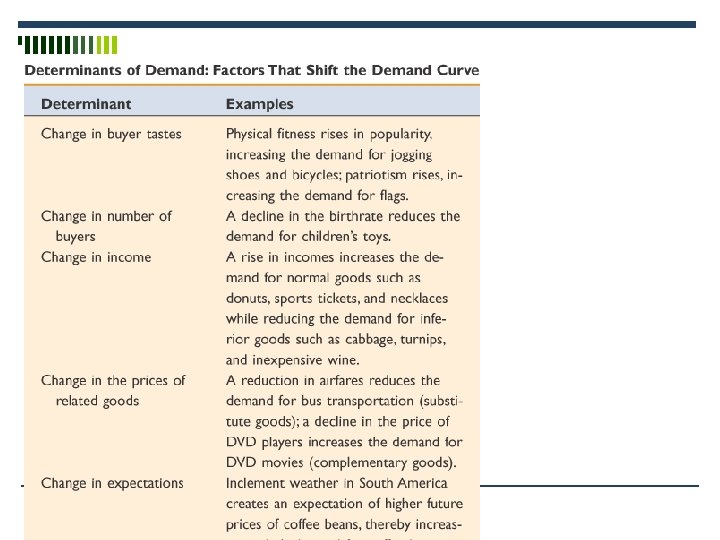
DETERMINANTS OF DEMAND o Tastes o Number of Buyers o Income n o Prices of Related Goods n n o Normal (Superior) & Inferior Goods Substitutes & Complements Unrelated Goods Expectations
Exceptions to the Law of Demand n Giffen Goods whose quality is judged by price n Goods with snob appeal
DO NOW w/ whiteboards and a Partner o Demonstrate a properly labeled S/D graph. o Demonstrate a decrease in Qd o Demonstrate an increase in Demand
SUPPLY DEFINED SUPPLY SCHEDULE Various Amounts CORN P QS $1 2 3 4 5 5 20 35 50 60
SUPPLY DEFINED SUPPLY SCHEDULE Various Amounts CORN P QS $1 A Series of Possible Prices 2 3 4 5 5 20 35 50 60 …a specified time period …other things being equal
LAW OF SUPPLY A direct relationship exists between price and quantity supplied o. As Price Rises… …Quantity Supplied Rises o. As Price Falls… …Quantity Supplied Falls
GRAPHING SUPPLY Price of Corn P Plot the Points $5 CORN P QS 4 $5 4 3 2 1 o 5 10 20 30 40 50 60 70 80 Quantity of Corn Q 60 50 35 20 5
GRAPHING SUPPLY Price of Corn P Plot the Points $5 CORN P QS 4 $5 4 3 2 1 o 10 20 30 40 50 60 70 80 Quantity of Corn Q 60 50 35 20 5
GRAPHING SUPPLY Price of Corn P Plot the Points $5 CORN P QS 4 $5 4 3 2 1 o 10 20 3035 40 50 60 70 80 Quantity of Corn Q 60 50 35 20 5
GRAPHING SUPPLY Price of Corn P Plot the Points $5 CORN P QS 4 $5 4 3 2 1 o 10 20 30 40 50 60 70 80 Quantity of Corn Q 60 50 35 20 5
GRAPHING SUPPLY Price of Corn P Plot the Points $5 CORN P QS 4 $5 4 3 2 1 o 10 20 30 40 50 60 70 80 Quantity of Corn Q 60 50 35 20 5
GRAPHING SUPPLY Price of Corn P $5 S P QS 4 $5 4 3 2 1 o CORN Connect the Points 10 20 30 40 50 60 70 80 Quantity of Corn Q 60 50 35 20 5
GRAPHING SUPPLY Price of Corn P $5 4 3 2 S What if Supply Increases? 1 o 10 20 30 40 50 60 70 80 Quantity of Corn CORN P QS $5 4 3 2 1 Q 60 50 35 20 5
GRAPHING SUPPLY Price of Corn P $5 4 3 2 1 o Increase in Supply S S’ CORN P QS $5 6080 4 5070 3 3560 45 2 20 Increase 1 530 in Quantity Supplied 10 20 30 40 50 60 70 80 Quantity of Corn Q
GRAPHING SUPPLY Price of Corn P $5 4 3 2 S What if Supply Decreases? 1 o 10 20 30 40 50 60 70 80 Quantity of Corn CORN P QS $5 4 3 2 1 Q 60 50 35 20 5
GRAPHING SUPPLY Price of Corn Decrease P $5 4 3 2 1 o in Supply S’ S CORN P QS $5 6045 4 5030 3 3520 Decrease 2 200 in Quantity 1 5 -Supplied 10 20 30 40 50 60 70 80 Quantity of Corn Q
Change in Supply o. Changes in Supply…shift in the curve n Increase in supply - supply curve shifts to the right n Decrease in supply curve shifts to the left
Increase in Supply So S 1 Supply curve shifts to the right
Decrease in Supply S 1 So Supply curve shifts to the left
Change in Quantity Supplied o Change in Quantity Supplied ( Qs) - is movement along a supply curve o Changes in quantity supplied can only be caused by a change in the price of the good. • • Increase in Qs - a movement to the right along a supply curve Decrease in Qs - a movement to the left along a supply curve
P An increase in Quantity Supplied Caused by a price increase Supply Price moves up… Quantity supplied increases Q
P A decrease in Quantity Supplied Caused by a price decrease Supply Price moves down… Quantity supplied decreases Q
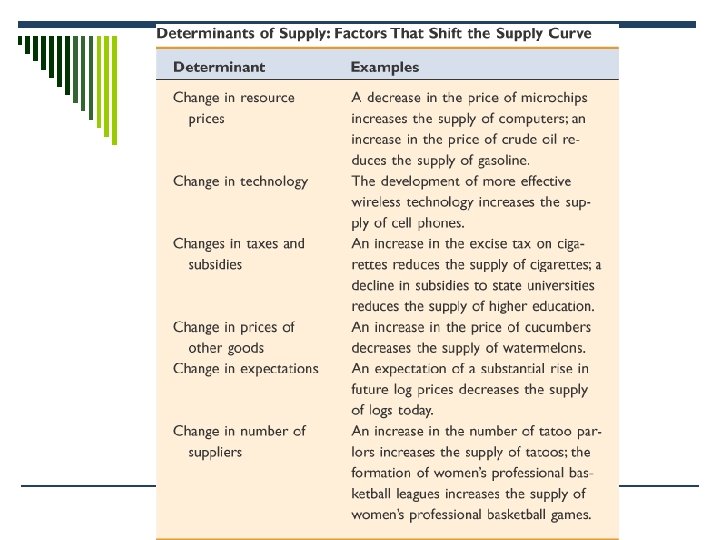
DETERMINANTS OF SUPPLY o Resource Prices o Technology o Taxes & Subsidies o Prices of Other Goods o Price Expectations o Number of Sellers
DO NOW w/ whiteboards and a Partner o Demonstrate a properly labeled S/D graph. o Demonstrate a decrease in Qs o Demonstrate an increase in Supply
Combining Supply with Demand
MARKET DEMAND & SUPPLY BUSHELS OF CORN P $5 4 3 2 1 QD 10 20 35 55 80 MARKET 200 DEMAND B x 2, 000 U 4, 000 Y 7, 000 E 11, 000 R 16, 000 S BUSHELS OF CORN P QS $5 4 3 2 1 60 50 35 20 5 MARKET 200 SUPPLY S 12, 000 E 10, 000 L 7, 000 L 4, 000 E 1, 000 x R S EQUILIBRIUM G h p ra y… l l ica
MARKET DEMAND & SUPPLY Price of Corn CORN MARKET P QD $52, 000 44, 000 37, 000 11, 000 2 16, 000 1 P S $5 P QS Market $5 12, 000 Clearing 4 Equilibrium 10, 000 37, 000 24, 000 11, 000 4 3 2 1 o CORN MARKET D 2 4 6 78 10 12 14 16 Quantity of Corn Q
MARKET DEMAND & SUPPLY Price of Corn CORN MARKET P QD $52, 000 44, 000 37, 000 11, 000 2 16, 000 1 P Surplus $5 S P QS At a $4 price 4 12, 000 more is being$5 3 supplied than demanded 2 1 o CORN MARKET 4 10, 000 3 7, 000 2 4, 000 1 1, 000 D 2 4 6 78 10 12 14 16 Quantity of Corn Q
MARKET DEMAND & SUPPLY Price of Corn CORN MARKET P QD $52, 000 44, 000 37, 000 11, 000 2 16, 000 1 P S $5 S P Q At a $2 price 12, 000 more is being $5 10, 000 4 demanded than 37, 000 supplied 24, 000 11, 000 Shortage 4 3 2 1 o CORN MARKET D 2 4 6 78 101112 14 16 Quantity of Corn Q
MARKET DEMAND & SUPPLY Price of Corn CORN MARKET P QD $52, 000 44, 000 37, 000 11, 000 2 16, 000 1 P Surplus $5 S 4 3 2 Shortage 1 o 2 4 6 78 101112 14 16 Quantity of Corn CORN MARKET P QS 12, 000 $5 10, 000 4 37, 000 24, 000 11, 000 D Q
MARKET EQUILIBRIUM o. Equilibrium Price & Quantity o. Rationing Function of Prices o. Changes in Demand o. Changes in Quantity Demanded o. Changes in Supply o. Changes in Quantity Supplied
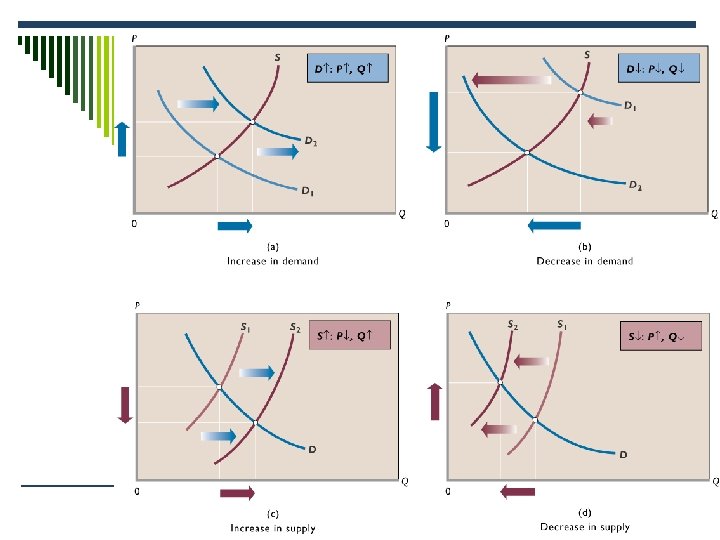
Complex Cases Multiple Shifts… o. Supply Increases; Demand Decreases n Prices Decrease n Quantity Indeterminate o. Supply Decreases; Demand Increases n Price Increases n Quantity Indeterminate
Complex Cases Multiple Shifts… o. Supply Increases; Demand Increases n Prices Indeterminate n Quantity Increases o. Supply Decreases; Demand Decreases n Price Indeterminate n Quantity Decreases
Know This Chart!
Government Set Prices o. Price Ceilings n. Shortages n. Rationing Problem n. Black Markets n. Rent Controls o. Price Floors n. Surpluses
o Price Ceiling n A maximum price set by government below the market generated equilibrium price
P A Price Ceiling S P 1 Pc Shortage QS Qe D QD Q
What are the economic affects of a price ceiling? n Lowers price, lowers quantity supplied • The ceiling creates a shortage • Qd > Q s
o Who gets the product? n Queuing and line tickets • Rationing, such as coupons • Favoritism • Special groupings
o Examples of Price Ceilings n World War II rationing n Rent Controls n Gas in the 1970’s
o Price Floor n A minimum price set by government above the market equilibrium price
P Pf P 1 A Price Floor Surplus S D QD Qe QS Q
n Reasons for a Price Floor p To help suppliers of a specific good to get a higher price than otherwise would be the case
o What could reduce prices thus justifying a price floor? n Supply factors: push the supply curve rightward, reducing price p Technology p Too many sellers p Increase in inventory
What are the economic effects of a price floor? o Raises price, lowers quantity demanded • The floor creates a surplus • Q s > Q d
o Problems with price floors: n What to do with the surplus?
o Price Floor Examples n American agriculture n The minimum wage law
Key Terms market change in quantity demanded demand supply demand schedule supply schedule law of demand law of supply diminishing marginal utility supply curve income effect determinants of supply substitution effect change in supply demand curve change in quantity supplied determinants of demand surplus normal goods shortage inferior goods equilibrium price substitute good equilibrium quantity complementary good rationing function of prices change in demand price ceiling and floor