INDIVIDUAL DIFFERENCES PERSONALITY History definitions approaches and structure


, ideographic, and nomothetic (types and traits) approaches to the")


 1 x y 4 x")

, N")
 Culture (situational influences) Extraversion")

 Normality (differential psychology)")
 impaired")
 dynamic personality")


 Training potential Low,")


 in socio-economic status as a function of IQ")

 1.")


 Environment genes Personality traits")


: Schumann, Tchaikovsky, Pollock, Van")
 IQ")
 model: creativity as a super-set of intelligence")

 “three ring” model of giftedness creativity task commitment IQ")

 : \"Imagine what")


 Clockwise from top left: Winston Churchill, Nelson")
 on Leadership Identification: strong affective ties between leader and")
 Freud (1856 -1939) Darwin")
 leadership traits in Big Five language N E")


 Mathematical reasoning Visual")
- Slides: 72
INDIVIDUAL DIFFERENCES PERSONALITY: History, definitions, approaches, and structure PERSONALITY: Traits in everyday life, what do they predict? PSYCHOPATHOLOGY: Abnormal behavior and mental illness INTELLIGENCE: Measurement of human abilities, IQ tests INTELLIGENCE: IQ in everyday life, what does it predict? BEHAVIOR GENETICS: Genetic and environmental influences BEYOND IQ: Searching for novel abilities (social, emotional, etc. ) MOOD AND MOTIVATION: Differences within-individuals CREATIVITY: Relationship to personality and intelligence LEADERSHIP: Situational, personal, and interactional theories INTERESTS: Rediscovering the importance of vocations
Traits as general predispositions to act according to interests, values, and preferences behaviour: e. g. , goes partying a) different people have different interests b) b) different interests determine different behaviours awareness and intention I interests: e. g. , likes parties values: e. g. , having fun preferences: e. g. , meeting people c) we are aware, as actors and observers, of these interests and behaviours d) people tend to act in consistent manners
Differential Psychology: Goals and Applications abnormal behavior clinical understand performance in school educational performance at work occupational relationships general/lay Differences between individuals predict
Intelligence: individual differences in competition and adaptation Ø Intelligence, also known as intellectual ability, IQ, cognitive ability, or “g” (for general intelligence) Ø Measures an individual’s ability to adapt and solve problems Ø Problems can range from complex mathematical tests to simple reaction time (RT) experiments and even practical tasks Ø Intelligence can be broken down into minor skills or abilities Ø It is measured through standardised multiple-choice tests Ø Individual’s performance is compared to the norm (that of others’) Ø IQ is a powerful and widely-used tool for classification and selection of individuals Ø In educational and occupational settings, it has proven very effective
Figure #1. 7: Genetic and environmental determinants of individual differences mother father Are similarities with our parents (e. g. , personality, intelligence) inherited or “acquired”, that is, learned? Are they genetically (nature) or environmentally (nurture) determined? son daughter
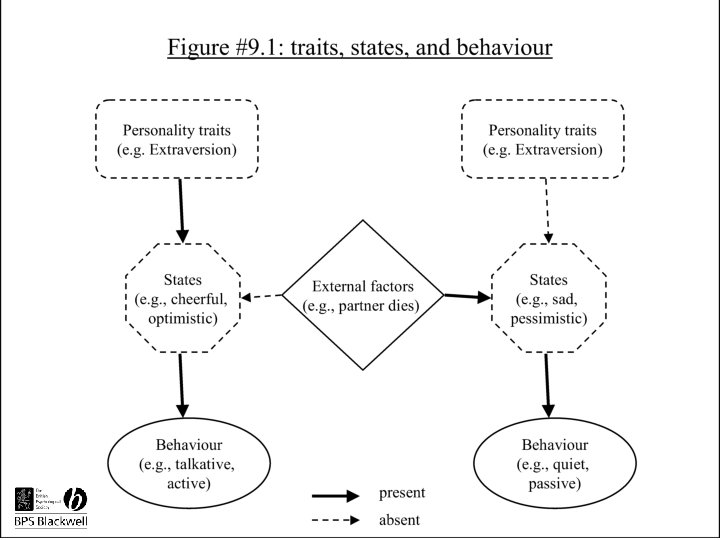
Traits, motivation, mood and situational factors Traits motivation behavior Situational factors mood
Figure #1. 9: Fluency and originality as indicators of creativity or creative responses Instruction: You have one minute to name all the things you could do with a chair sit ? hit someone ? Can you think of more uses of a chair? lock a door CHAIR stand on it ? ? work out burn it (fire) Which responses are more original and why?
Figure #2. 1: Situational (states), ideographic, and nomothetic (types and traits) approaches to the study of personality p 1 1)Situational: personality as inconsistent states/behaviors p 2 p 1 2)Ideographic: describes different people with different terms types traits p 1 p 2 3)Nomothetic: describes different people using same types (extremes) or traits (continuum)
Figure #2. 3: Dispositional approaches to personality: traits and types traits x types • continuous • discontinuous • degree (how? ) • discrete (what? ) • quantitative • qualitative • ordinal • categorical • score on x-y factor • x or y y x y
Figure #2. 2: Personality traits as psychological determinants of consistent behaviors WHAT ARE PERSONALITY TRAITS? • General descriptions of individuals • Implicit explanations of their behavior • Internal characteristics of the individual • Causal determinants of repetitive behaviors • They explain and predict systematic differences • As well as similarities between individuals 3 EXAMPLES: a) Pete is a selfish guy b) Leo is a happy girl c) Sven is incredibly obsessive
Figure #3. 2: correlation and causation (5 possible paths) 1 x y 4 x yz y 2 y x 5 y z x H 1: Smoking causes Neuroticism x 3 H 2: Neuroticism causes smoking H 3: Physiological arousal causes both smoking and Neuroticism z y H 4: Smoking causes physiological arousal, which in turn causes Neuroticism H 5: Neuroticism causes physiological arousal, which in turn causes smoking
Figure #3. 2 Moderation • Gender and smoking are uncorrelated or independent (they do not overlap) • Gender and smoking are both correlated with stress • Both men and women are more likely to experience stress if they are smokers • Both smokers and non-smokers are more likely to experience stress if they are male x z y x = gender, y = smoking, z = stress
Figure #3. 4 Personality and health: 3 types of influence Personality A (-), N (+) Intrinsic dispositions: anger mistrust - C (-), N (+) Risky behavioral choices smoking drugs - C (+) Prevention & reaction visits to doctor treatment + HEALTH Note. A = Agreeableness, N = Neuroticism, C = Conscientiousness, + = positive influence, - = negative influence
Figure #3. 4 Personality, culture, and happiness Personality (dispositional Influences) Culture (situational influences) Extraversion Life events Emotional Stability Socio-politicoeconomic factors happiness
Figure #3. 5 Personality and subjective well-being: the “bigger picture” Well-being Social A N Subjective Quality of life E C Economic Neuroticism, E = Extraversion, A = Agreeableness, C = Conscientiousness
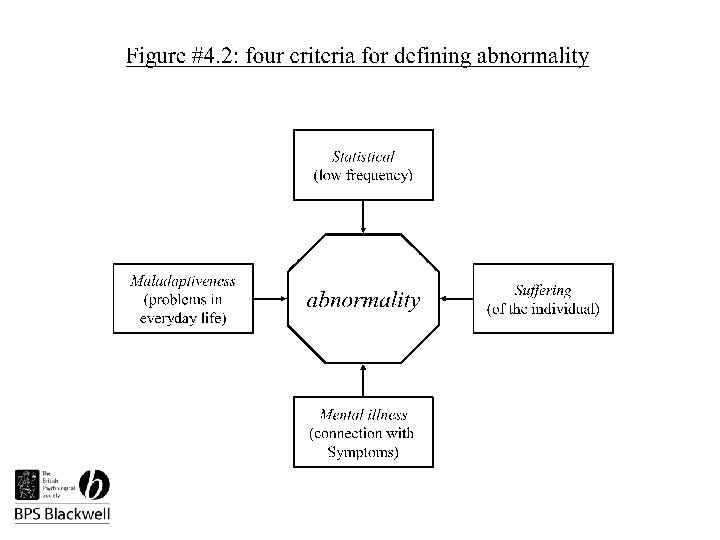
Differential Psychology and Pyschopathology Abnormality (psychopathology) Normality (differential psychology)
Figure #4. 4: Diathesis-stress model: An integrative approach to psychopathology Genetic predisposition (vulnerability) impaired social functioning diathesis interaction stress Environmental Triggers (potentiators) symptoms impaired occupational functioning
Figure #4. 5: A simplified adaptation of Mc. Crae & Costa’s (1999) dynamic personality model External influences Cultural norms, life events Characteristic adaptations: goals, attitudes, beliefs, etc. Self-concept: self-schemas, personal myths Basic Traits Neuroticism Extraversion Openness Agreeableness Conscientiousness genes
Figure #5. 1: Personality and intelligence chapters in context personality intelligence what is it? does it matter? chapter #2 chapter #3 chapter #5 chapter #6
Figure #5. 3: Graphical depiction of the bell curve or normal distribution of IQ The “bell curve” figure below shows the normal distribution of IQ scores, which have a mean of 100 and a standard deviation of 15. Thus if your IQ = 100 you have “average” intelligence, whereas an IQ = 130 shows superior intelligent, and an IQ = 70 signals borderline retardation. SD IQ -3 -2 -1 55 70 85 Mild Retardation Borderline Retardation Low Average 0 +1 100 Average Above Average 115 Superior +2 +3 130 Gifted 145
Figure #6. 4 Mediated and direct effects of g on job performance Training performance g JOB performance
Figure #6. 4: Occupational consequences of IQ (based on Gottfredson, 2004) Training potential Low, slow, simple, supervised Career potential 70 -75 75 -80 Explicit, hands-on Clerk, teller Police officer Machinist Salesperson Assembler Food service Nurse’s aide 80 -85 85 -90 Mastery, learning, hands-on 90 -95 Written materials + experience University type Manager School teacher Accountant Gathers, infers, selftraining Lawyer Scientist CEO 95 -100 100 -105 105 -110 110 -115 115 -120 120 -125 125 -13
#9. 5 Intelligence predicts health and longevity health g Self-care Risk-prevention Optimal treatment LONGEVITY Accident prevention
#6. 5 The path from g to longevity Better genes Better informed Avoid risks Choose healthy Live longer
Figure #6. 6 Generational gains (father-son) in socio-economic status as a function of IQ (based on Mascie-Taylor & Gibson, 1978) IQ points (difference) 15 10 5 0 -5 -10 -15 -20 -3 -2 -1 0 1 2 3 Socio-economic (difference)
Figure #6. 7 Origin of race differences in IQ and implications GENETIC Poverty and social inequalities Are unchangeable ENVIRONMENTAL Society is unfair towards certain groups TEST BIAS IQ test are designed to favour certain groups
Figure #6. 8: In decline: sex differences in abilities (based on Feingold, 1988) 1. 6 M female advantage 1. 4 1. 2 M Spe speed L language M mechanical male advantage Spa spatial 1 M. 8 M Spe. 6. 4 Spa Spe L L Spa . 2 Standard deviation 1947 1962 Spe L Spa 1972 L Spe Spa 1980
Figure #9. 8 Event-related potentials for low and high IQ subjects (loosely based on Ertl & Schafer, 1969) IQ = 145 IQ = 75 0 Time in milliseconds 250
Figure #6. 4 g may influence both cognitive performance and brain activity measures Cognitive performance Psychometric tests g Brain activity EEG, ERP
Figure #7. 1 Individual differences: Genetically or environmentally determined? We are born the same but experience makes as different OR Our experience is biologically determined IS OUR EXPERIENCE INFLUENCED BY GENETICALLY DETERMINED INDIVIDUAL DIFFERENCES? ARE INDIVIDUAL DIFFERENCES IN PERSONALITY AND INTELLIGENCE THE PRODUCT OF EXPERIENCE?
Figure #7. 2: Family, adoption, and twin designs Family studies Biological parents G+E child Adoption studies Biological parents Adoptive parents G E child Child shares genes (G) and Child shares genes with environment (E) with biological, environment parents. The effects of with adoptive, parents. genes and environment are Genetic effects are evident if thus confounded child resembles biological parents, and vice-versa Twin studies Biological parents G+E G+E DZ DZ MZ MZ Fraternal/dizygotic (DZ) twins share 50% of their genes, whilst identical/monozygotic (MZ) twins share 100% of their genes. Comparing MZ and DZ twins will provide evidence for the effect of genes (like in matched designs)
Figure #7. 4: IQ correlations for family, adoption and twin designs (adapted from Plomin & Spinath, 2004) r values Common genes and environment 1 0. 9 Adoptedapart MZ 0. 8 Common environment 0. 7 Common genes 0. 6 Together Sib 0. 5 0. 4 0. 3 Adoptedapart P-O Adoptive Sib P-O = parent-offspring Sib = siblings MZ = monozygotic DZ = dizygotic 0. 2 0. 1 0 Adoptive P-O Adoptedapart Sib Together P-O Together DZ Together MZ
Figure #7. 2: Genetic effects on IQ over the lifespan (Adapted from Mc. Gue et al. , 1993) 1. 0 DZ TWINS MZ TWINS 0. 8 0. 6 0. 4 0. 2 0. 0 4 -6 years 12 -16 years Over 20 years
Figure #7. 6: Genetic interplay: Personality and intelligence Intelligence (gf) Environment genes Personality traits Knowledge Intelligence (gc) Adult skills
Figure #7. 7 On the raise: The Flynn effect in 4 nations (IQ increases across time) 100 Belgium 95 Norway 90 85 80 Netherlands Great Britain 75 70 1942 1952 1962 1972 1982 1992
Figure #8. 1: Hot intelligences at a glance 1920… Social intelligence 1983… Multiple intelligences 1985… 1990… Practical Intelligence Emotional intelligence Thorndike Gardner Sternberg Salovey Mayer Goleman Act wisely in interpersonal relations Identify and manage emotions in self and others Do well in everyday live; being streetwise Bodily Social Spiritual Musical skills
Figure #8. 1: Thorndike’s three intelligences and social intelligence Intelligence Mechanical Abstract Social Ability to manage objects Ability to manage ideas Ability to manage people
Figure #8. 1: Four related problems with the notion of Social Intelligence Objectively testable? (“correct” answers) Different from Cognitive ability? SOCIAL INTELLIGENCE Predicts unique Variance? Different from Personality?
Figure #8. 2: Testing hot intelligence theories: 5 main questions for research Does it exist? Some people are generally more able than others to… Does it refer to stable individual differences? Can it be measured? Same people will always score the same on the same test Can it be quantified through reliable psychometric tools? Is it important? It is better to have high than low scores? Does it predict real-life criteria (e. g. , job success, happiness)? Is it an ability? Is it related to intelligence rather than personality traits? Measured by performance tests moderately correlated with g? it is more important than IQ? Does it tell us anything new, i. e. provide any novel information? Does it have incremental validity, predict outcomes beyond IQ?
Figure #10. 1: Conceptual map of chapter’s contents introduction definition differential approaches creativity and intelligence creativity and personality testing creativity across fields summary & conclusions paradigms
Figure #10. 9 Genius and insanity From top left (clockwise): Schumann, Tchaikovsky, Pollock, Van Gogh, Newton, Wittgenstein, Poe, and Hemingway, all experienced psychopathological symptoms
Figure #10. 4: creativity and intelligence Creativity as a form of intelligence a) IQ creativity Intelligence as a form of creativity b) creativity IQ Intelligence and creativity as related constructs c) creativity IQ Intelligence and creativity as unrelated constructs d) creativity IQ Intelligence and creativity as overlapping constructs e) creativity IQ
Figure #10. 3: Sternberg & Lubart’s (1995) model: creativity as a super-set of intelligence environment CREATIVITY intelligence knowledge thinking styles personality motivation
Figure #10. 6: Thinking “outside the box”: when intelligent and creative solutions are the same thing (based on Weisberg & Alba, 1981) Problem: Above are nine dots arranged in a set of three rows. Your challenge is to draw four straight lines which go through the middle of all of the dots (once) without taking the pencil off the paper. start here Solution: think outside the box!
Figure #10. 7: Renzulli’s (1986) “three ring” model of giftedness creativity task commitment IQ
Figure #10. 6: Scoring methods for creativity tests • Originality - each response is compared with all other responses. Reponses that were given by only 5% of your group are unusual (1 point), responses that were given by only 1% of your group are unique - 2 points). • Fluency – quantity regardless of quality (the higher fluency the higher the originality; this “contamination” problem can be corrected by using: originality = originality/fluency) • Flexibility - or use of different categories. • Elaboration - amount of detail (for Example "a doorstop" = 0 whereas "a door stop to prevent a door slamming shut in a strong wind" = 2 (one for explanation of door slamming, two for further detail about the wind). • Appropriateness – how valuable/useful the response is (rated by experts)
Figure #10. 6: Salient creativity measures • Consequences Test (Guilford, 1954) : "Imagine what might happen if all laws were suddenly abolished? " • Remote Associates Test (Mednick, 1962) Find a fourth word which is associated with each of the se three words : A. ratblue-cottage; B. Wheel-electric-light; C. surprise-linebirthday • Unusual Uses Tests (Guilford, 1954) "Find as many uses as you can think of for A. toothpick; B. brick, C. paper clip • Word Association Test. (Getzels & Jackson, 1962) Write as many meanings as you can for the following A. duck, B. sack, C. pitch • Creative Test Battery : Torrance Test of Creative Thinking (TTCT) : Three picture based exercises and 6 word based exercises (Figural and Verbal). Does a good job of identifying gifted students.
Figure #10. 1: Defining the creativity syndrome people environments products processes CREATIVE original useful
Figure #10. 3: Creativity across different paradigms behavioral biological insight, physiological abnormal cognitive creative correlates behavior processes, throughout styles, thinking brain mental attention, lifespan, assessment, processes, evolutionary disorders, focus methods, testing, observable functions, observable flexibility, birth-order learning, performance products, hemispheric mad genius learning associations activity clinical cognitive developmental changes family, gender educational teaching knowledge differences acquisition differential personality, intelligence,
Figure #10. 10: The creative personality and the Big Five Expressive, verbal, active, self-confident + + Extraversion Emotionally unstable, obsessive, anxious and sensitive Neuroticism + Openness + + + Open to new experiences, intellectually curious, aesthetically sensitive creative Unconventional, non-conformist, unstructured, irresponsible Conscientiousness - Antisocial, arrogant, selfish, cruel Agreeableness -
Figure #10. 11: Scoring methods for Alternate Uses Test • Originality - each response is compared with all other responses from all of the people you gave the test to. Reponses that were given by only 5% of the sample are unusual (1 point), responses that were given by only 1% of your group are unique (2 points) • Fluency – quantity regardless of quality (the higher the fluency, the higher the originality; this “contamination” problem can be corrected by using the formula: originality = originality/fluency) • Flexibility - or use of different categories • Elaboration - amount of detail (for Example "a doorstop" = 0 whereas "a door stop to prevent a door slamming shut in a strong wind" = 2 (one for explanation of door slamming, two for further detail about the wind). • Appropriateness – how useful (according to experts) the response is
Figure #11. 1: Famous Leaders (seven examples) Clockwise from top left: Winston Churchill, Nelson Mandela, Albert Einstein, James Joyce, Ronald Reagan, Jean Paul Sartre, and Mohandas Ghandi.
Figure #11. 2: Freud (1921) on Leadership Identification: strong affective ties between leader and group Prototypicality: leader as representative figure of the group Loves the group: equal treatment, respect and love by the leader to all group members Process of influence Through role model (paternal figure) Choice of leader Through similarity (with the group) Trust and fairness Through illusion (leader loves group)
Figure #11. 1: Internalized authority (Darwin and Freud on Leadership) Freud (1856 -1939) Darwin (1809 -1882) Ancient society ruled by despotic male Passion for authority Submissive mind Desire to be ruled Leadership
Figure #11. 3 : Stogdill’s (1974) leadership traits in Big Five language N E O A C Responsibility Adjustment, Dominance Intellect Friendliness Emotional balance Sociability intelligence Independence Social participation creativity Social awareness Achievement Initiative Support Self-confidence Altruism Personal integrity Ethical conduct Adapted from Hogan et al (1994)
Figure #11. 5: Personality traits, transformational leadership, and leadership effectiveness Personality traits partly determine transformational leadership style, which in turn partly determines leadership effectiveness N E . 28 Transformational leadership O A . 32 r <. 28 omitted Important predictor Secondary predictor C Weak predictor Leadership effectiveness
Figure #11. 4: Big Five correlates of leadership emergence and effectiveness Meta-analytic findings by Judge et al. (2002) Leadership Emergence Leadership Effectiveness. 33 -. 24. 33 -. 22 N . 24 E . 16 . 24. 21 O A C Note. Estimated corrected correlation coefficients (number of correlations varied from 17 to 37). N = Neuroticism, E = Extraversion, O = Openness, A = Agreeableness, C = Conscientiousness
Figure #12. 1: The three pillars of differential psychology Individual differences ABILITIES Cognitive Traits PERSONALITY INTERESTS (and motivation) Affective Traits Conative Traits
Figure #12. 4 Prediger on Holland data conventional things enterprising realistic social investigative artistic ideas people
Figure #12. 5 Big Five, Holland, and Prediger artistic investigative social enterprising Openness to Experience Extraversion Ideas Data People Things
Figure #12. 5: Stability of interests across the lifespan (based loosely on Low et al, 2005) 0. 9 0. 8 0. 7 0. 6 0. 5 0. 4 12 -14 years 14 -16 years 16 -18 years 18 -22 years 22 -25 years 25 -30 years 30 -35 years 35 -40 years
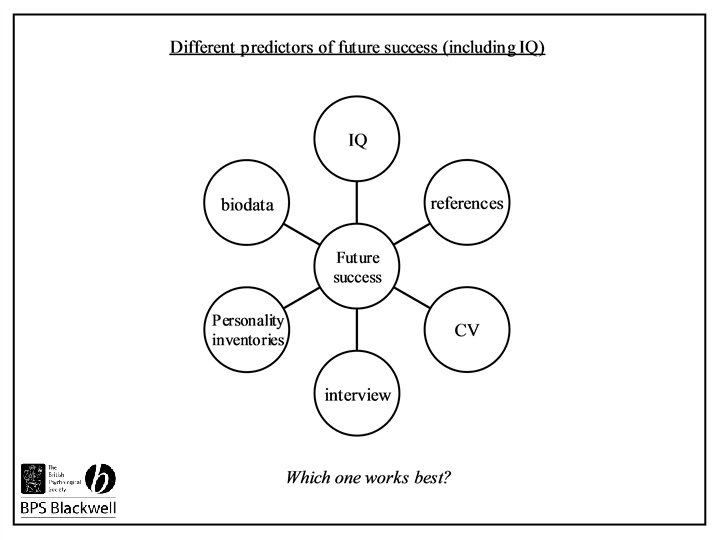
Figure #6. 3 Predictive validity of cognitive ability across different job types (based on Hunter, 1983; and Hunter & Hunter, 1984) biologist corporate manager mechanic teacher machinist metal fabricator high medium . 58 (. 50) truck operator assembler . 51 (. 57) low . 40 (. 54) DATA (information) precision . 56 (. 60) shrimp picker cannery worker feeding . 23 THINGS (objects) Note. All numbers are correlation coefficients; numbers in brackets refer to training performance; numbers outside brackets refer to job performance.
Figure #12. 1: Trait complexes (based on Ackerman & Heggestad, 1997) Mathematical reasoning Visual perception Realistic Investigative Gc Creative thinking Artistic OPENNESS Perceptual Speed CONSCIENTIOUSNESS Conventional Abilities PERSONALITY Interests EXTRAVERSION Enterprising Social