
Individual differences in statistics anxiety Donncha Hanna School
- Slides: 22
Individual differences in statistics anxiety Donncha Hanna School of Psychology QUB
Aims n Introduce statistical anxiety & relevance n Outline the potential antecedents of SA n Describe the on-line study & measures n Present the main findings
Statistics anxiety n Originally related to Maths Anxiety n The feelings of anxiety students experience when they encounter statistics n Experienced by 80%of students (Onwuegbuzie & Wilson, 2003)
Statistics anxiety & Psychology Its important because: n It is detrimental to performance (Reviews: Baloglu & Zelhart, 2003; Onwuegbuzie & Wilson, 2000) n Psychology students must complete statistics component for accreditation
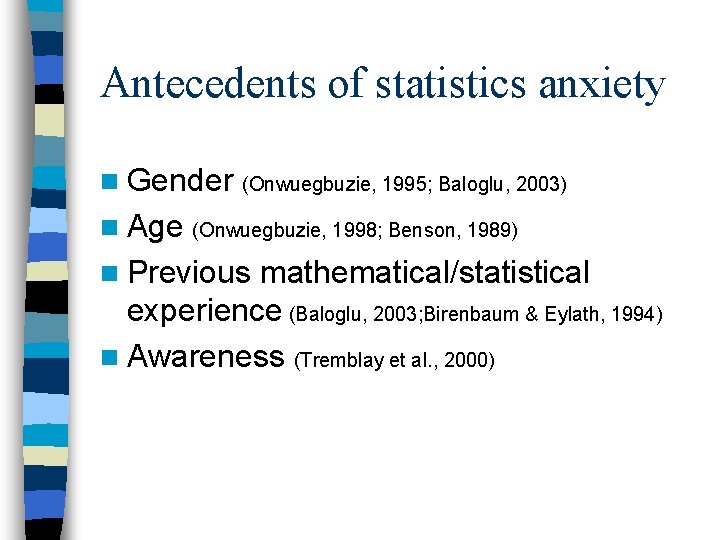
Antecedents of statistics anxiety n Gender (Onwuegbuzie, 1995; Baloglu, 2003) n Age (Onwuegbuzie, 1998; Benson, 1989) n Previous mathematical/statistical experience (Baloglu, 2003; Birenbaum & Eylath, 1994) n Awareness (Tremblay et al. , 2000)
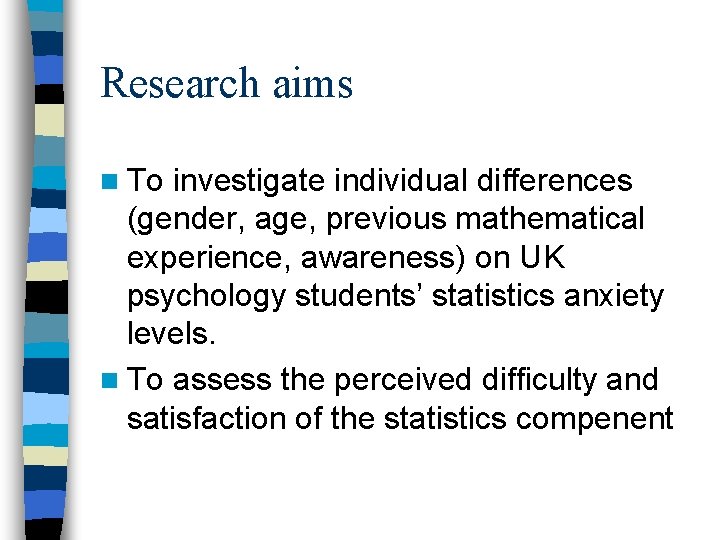
Research aims n To investigate individual differences (gender, age, previous mathematical experience, awareness) on UK psychology students’ statistics anxiety levels. n To assess the perceived difficulty and satisfaction of the statistics compenent
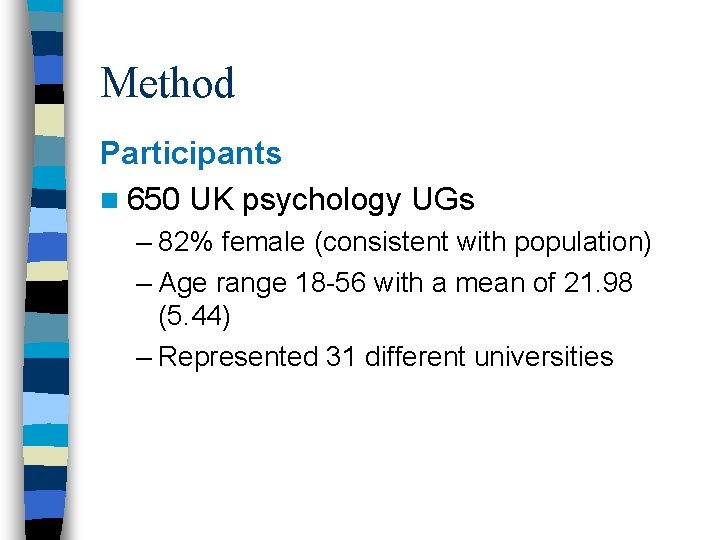
Method Participants n 650 UK psychology UGs – 82% female (consistent with population) – Age range 18 -56 with a mean of 21. 98 (5. 44) – Represented 31 different universities
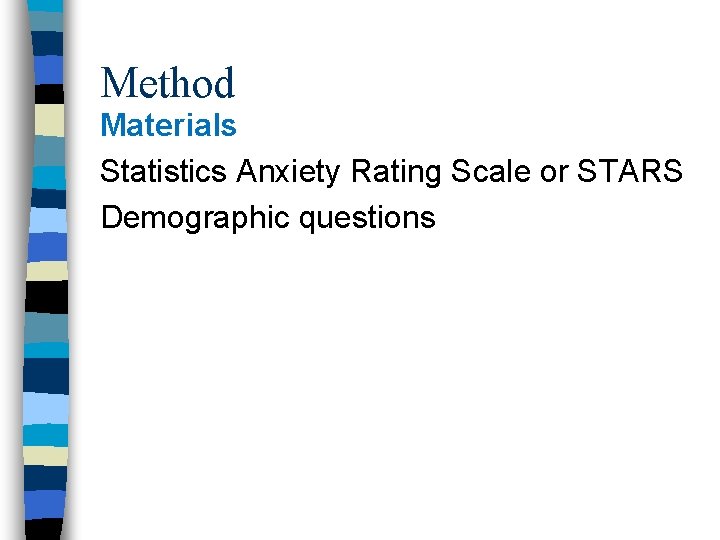
Method Materials Statistics Anxiety Rating Scale or STARS Demographic questions
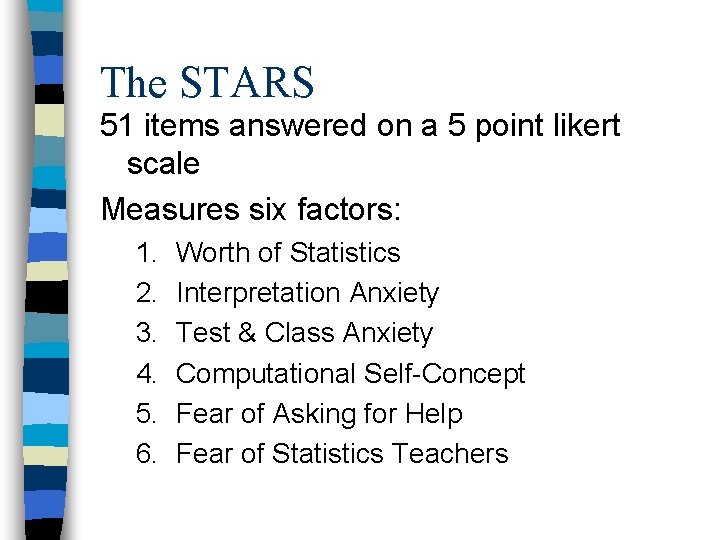
The STARS 51 items answered on a 5 point likert scale Measures six factors: 1. 2. 3. 4. 5. 6. Worth of Statistics Interpretation Anxiety Test & Class Anxiety Computational Self-Concept Fear of Asking for Help Fear of Statistics Teachers
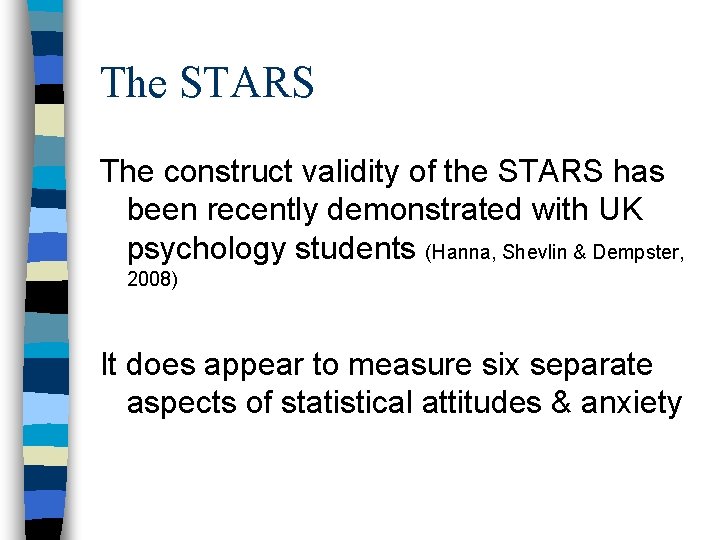
The STARS The construct validity of the STARS has been recently demonstrated with UK psychology students (Hanna, Shevlin & Dempster, 2008) It does appear to measure six separate aspects of statistical attitudes & anxiety
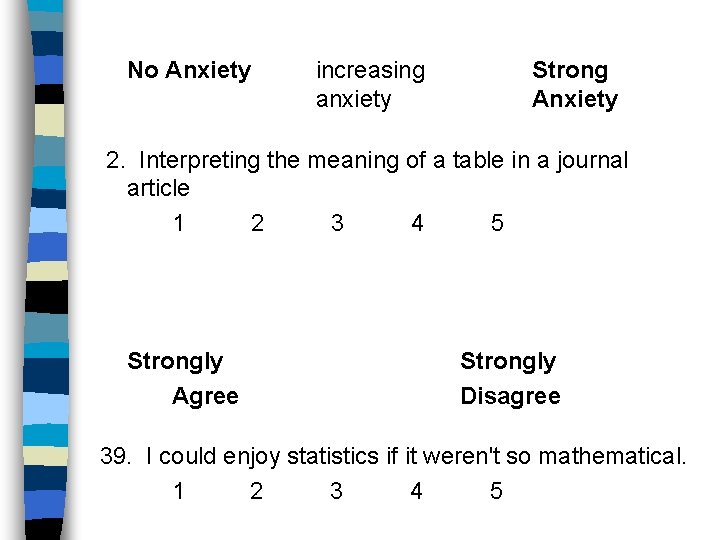
No Anxiety increasing anxiety Strong Anxiety 2. Interpreting the meaning of a table in a journal article 1 2 3 4 5 Strongly Agree Strongly Disagree 39. I could enjoy statistics if it weren't so mathematical. 1 2 3 4 5
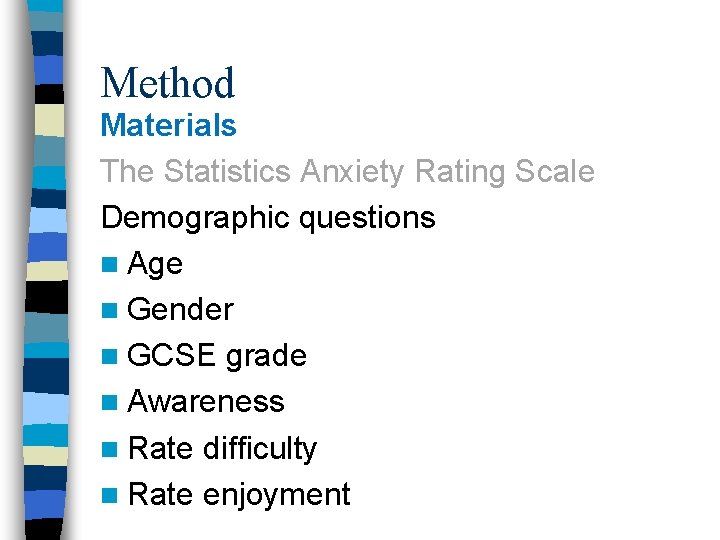
Method Materials The Statistics Anxiety Rating Scale Demographic questions n Age n Gender n GCSE grade n Awareness n Rate difficulty n Rate enjoyment
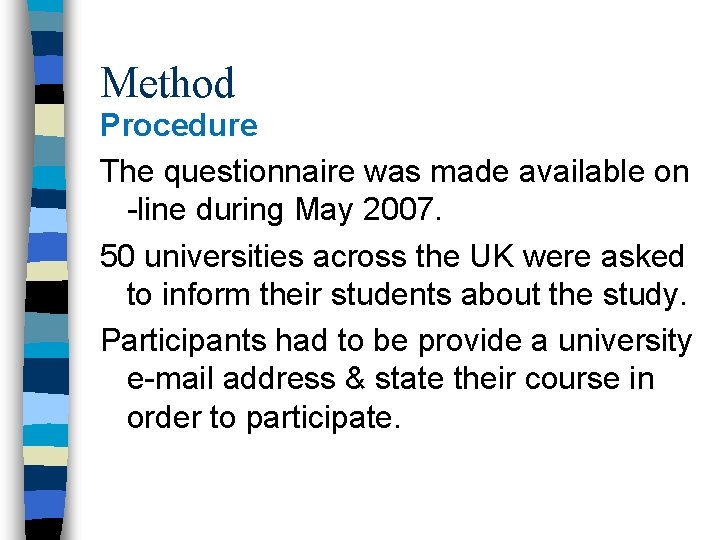
Method Procedure The questionnaire was made available on -line during May 2007. 50 universities across the UK were asked to inform their students about the study. Participants had to be provide a university e-mail address & state their course in order to participate.
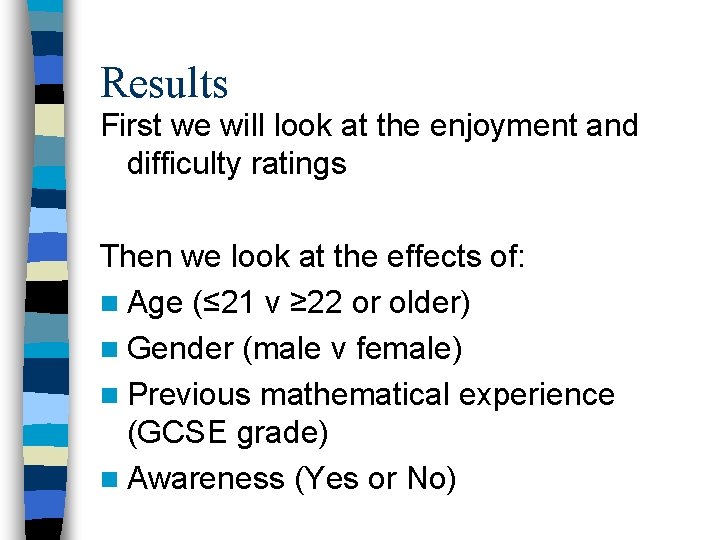
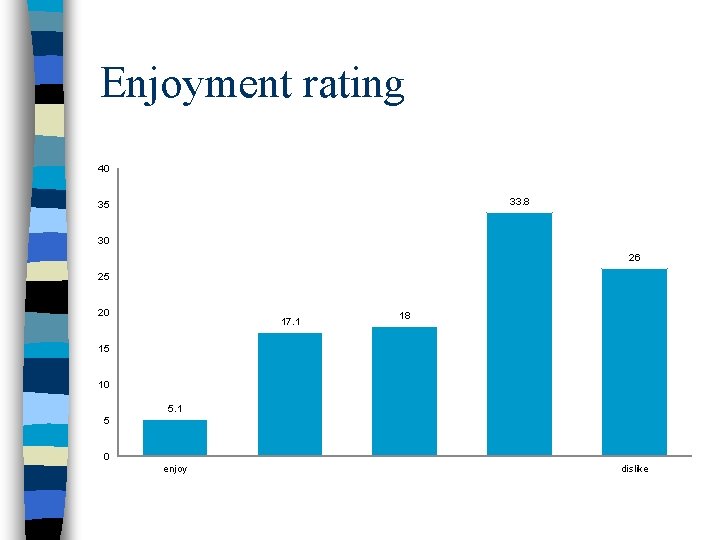
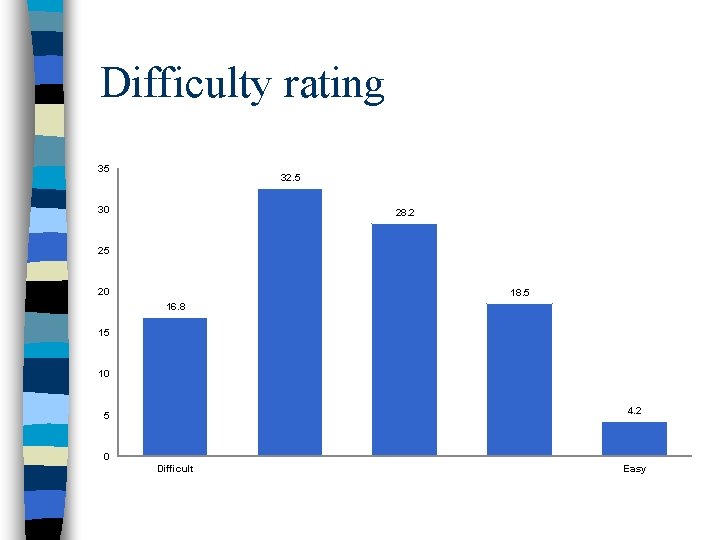
Results First we will look at the enjoyment and difficulty ratings Then we look at the effects of: n Age (≤ 21 v ≥ 22 or older) n Gender (male v female) n Previous mathematical experience (GCSE grade) n Awareness (Yes or No)
Enjoyment rating 40 33. 8 35 30 26 25 20 17. 1 18 15 10 5. 1 5 0 enjoy dislike
Difficulty rating 35 32. 5 30 28. 2 25 20 18. 5 16. 8 15 10 4. 2 5 0 Difficult Easy
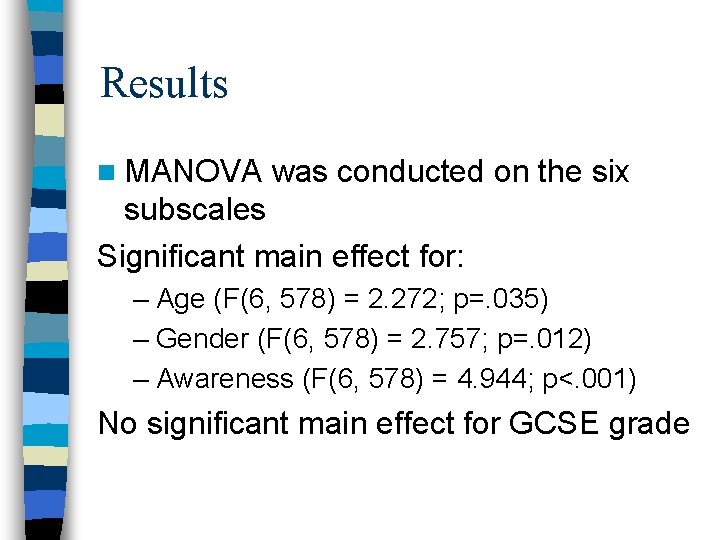
Results n MANOVA was conducted on the six subscales Significant main effect for: – Age (F(6, 578) = 2. 272; p=. 035) – Gender (F(6, 578) = 2. 757; p=. 012) – Awareness (F(6, 578) = 4. 944; p<. 001) No significant main effect for GCSE grade
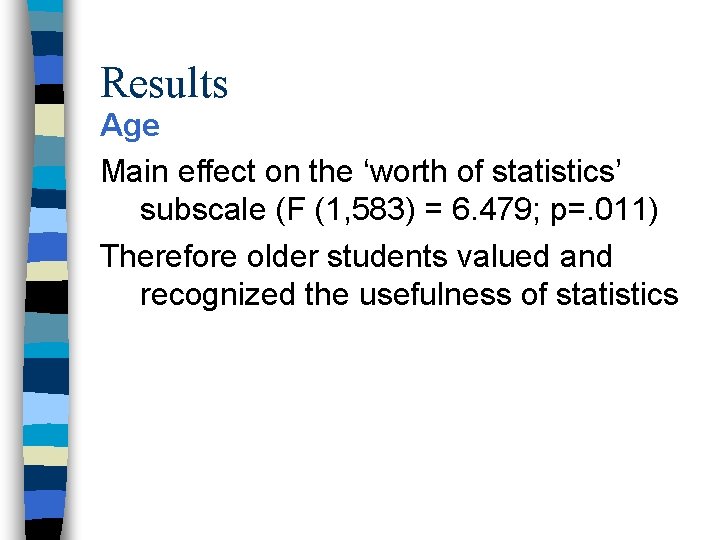
Results Age Main effect on the ‘worth of statistics’ subscale (F (1, 583) = 6. 479; p=. 011) Therefore older students valued and recognized the usefulness of statistics
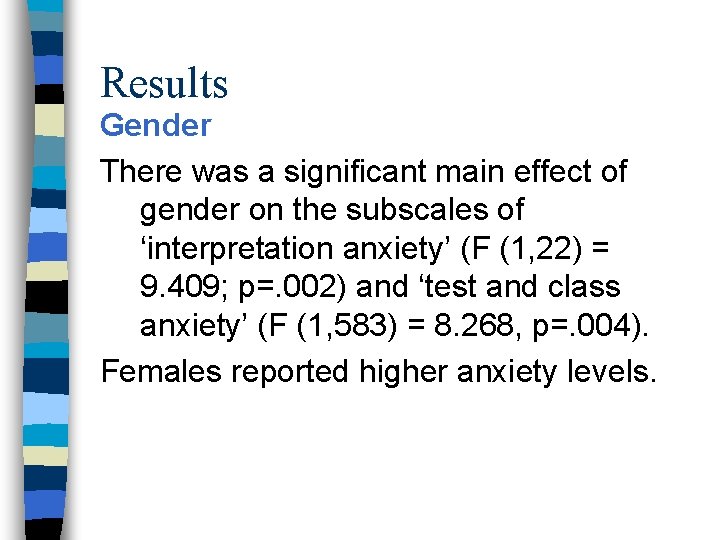
Results Gender There was a significant main effect of gender on the subscales of ‘interpretation anxiety’ (F (1, 22) = 9. 409; p=. 002) and ‘test and class anxiety’ (F (1, 583) = 8. 268, p=. 004). Females reported higher anxiety levels.
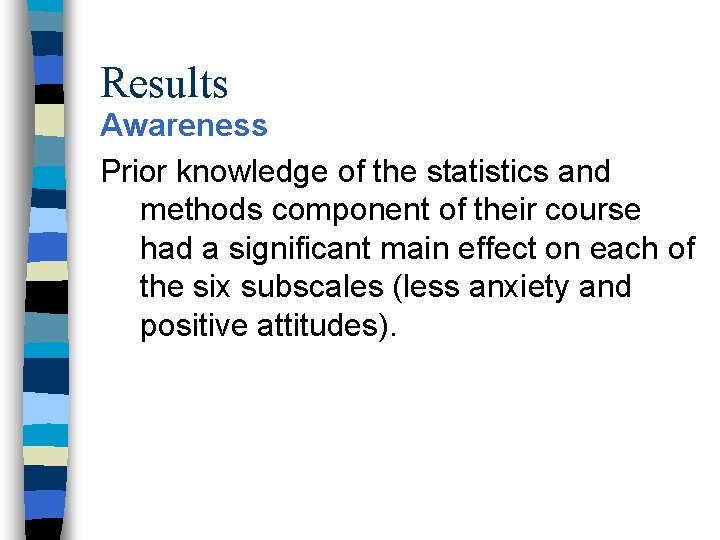
Results Awareness Prior knowledge of the statistics and methods component of their course had a significant main effect on each of the six subscales (less anxiety and positive attitudes).
Results Awareness Furthermore, those students that reported prior knowledge demonstrated lower perceived difficulty (χ2 = 36. 41; df=4; p<0. 001) and increased enjoyment (χ2 = 42. 50; df=4; p<0. 001) compared to colleagues.
Conclusions n Older students do not demonstrate more anxiety but may have more positive attitudes n Females n 50% experience more anxiety of students are unaware of the statistical component of the degree; this is related to higher anxieties & negative attitudes