
Indicators to Monitor Sustainable Development Challenges and Recent
Indicators to Monitor Sustainable Development: Challenges and Recent Developments Enrico Giovannini University of Roma “Tor Vergata” Spokeperson of the Italian Alliance for Sustainable Development (ASvi. S) www. asvis. it
“If you don’t know where you’re going, you end up somewhere else. ” Yogi Berra
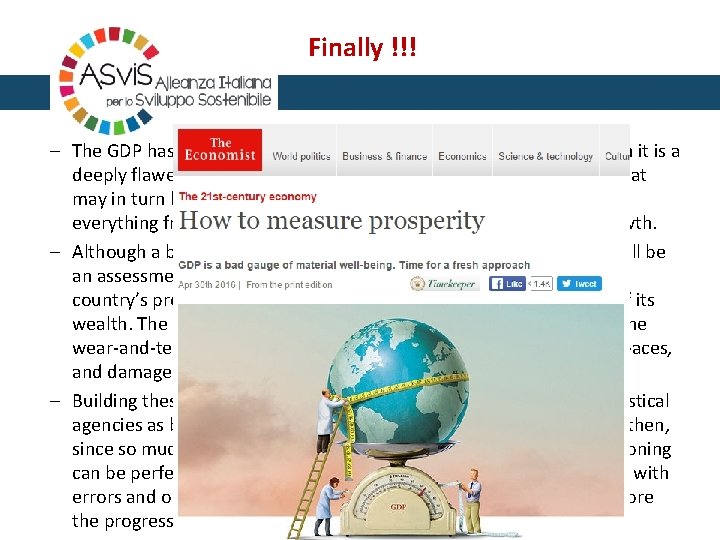
Finally !!! – The GDP has become shorthand for material well-being, even though it is a deeply flawed gauge of prosperity, and getting worse all the time. That may in turn be distorting levels of anxiety in the rich world about everything from stagnant incomes to disappointing productivity growth. – Although a big improvement on today’s measure, GDP-plus would still be an assessment of the flow of income. To provide a cross-check on a country’s prosperity, a third gauge would take stock, each decade, of its wealth. The ledger should also account for the depletion of capital: the wear-and-tear of machinery, the deterioration of roads and public spaces, and damage to the environment. – Building these benchmarks will demand a revolution in national statistical agencies as bold as the one that created GDP in the first place. Even then, since so much of what people value is a matter of judgment, no reckoning can be perfect. But the current measurement of prosperity is riddled with errors and omissions. Better to embrace a new approach than to ignore the progress that pervades modern life.
Obstacles to use the “Beyond GDP” approach • Lack of democratic legitimacy. The indicators being put forward have not been agreed democratically and lack public support. • Lack of underpinning theory and narrative. The indicators, unlike GDP, are not underpinned by a consistently articulated theory or ideology, summarised in a politically compelling narrative. • Lack of a clear political imperative. The economic crisis has meant the priority has been to fix the economy in the traditional way. • Technical questions with indicators. There remain disagreements about defining indicators, particularly on whether and how to create a single one. • The need for organisational change. An integrated approach requires working across departmental boundaries or reforming economics departments. • Institutional resistance to change. This always exists and as always reflects the fact that the power and/or success of institutions often depends on traditional objectives and models. • No widely used analytical tools for integrated and innovative economic policy making. The tools needed are still in development. Innovation in civil services is always difficult. BRAINPOo. L Report
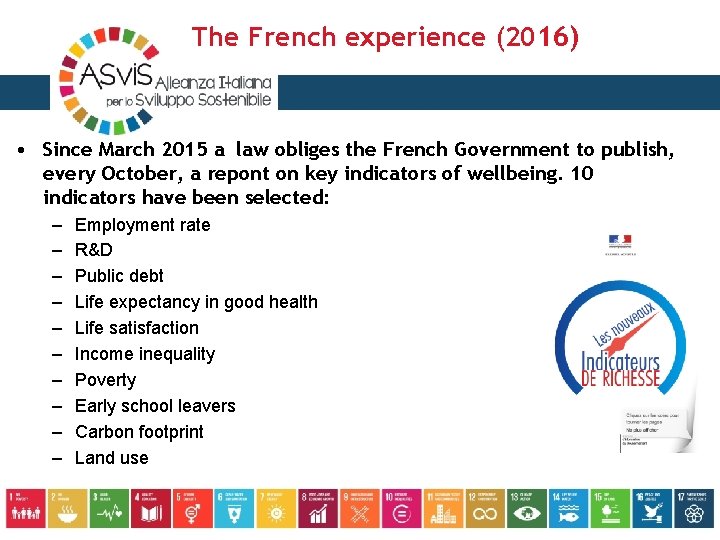
The French experience (2016) • Since March 2015 a law obliges the French Government to publish, every October, a repont on key indicators of wellbeing. 10 indicators have been selected: – – – – – Employment rate R&D Public debt Life expectancy in good health Life satisfaction Income inequality Poverty Early school leavers Carbon footprint Land use
The British experience (2016) • Since 2011 the ONS launched an initiative on measuring wellbeing upon request of the Prime Minister. 9 key domains have been selected: – health – our relationships – what we do – where we live – personal finance – education and skills – the economy – the environment – governance
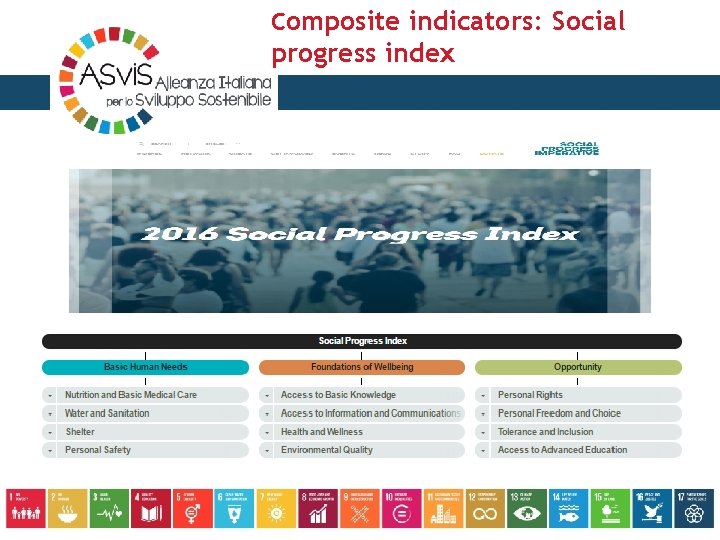
Composite indicators: Social progress index
The Istat initiative on Equitable and Sustainable Well-Being (BES) • The project was deisgned to produce a dashboard of indicators able to provide a shared view of the progress of the Italian society. • It was built on a process that involved: a) Steering Comittee: with the participation of stakeholders and Istat experts, to identify the domains and to agree on the final list of indicators; b) Scientific Commission: with the participation of experts in different fields, to select potential indicators based on quality concerns; c) Public consultation. • Biennial reports. • Widely quoted, especially by media and civil society.
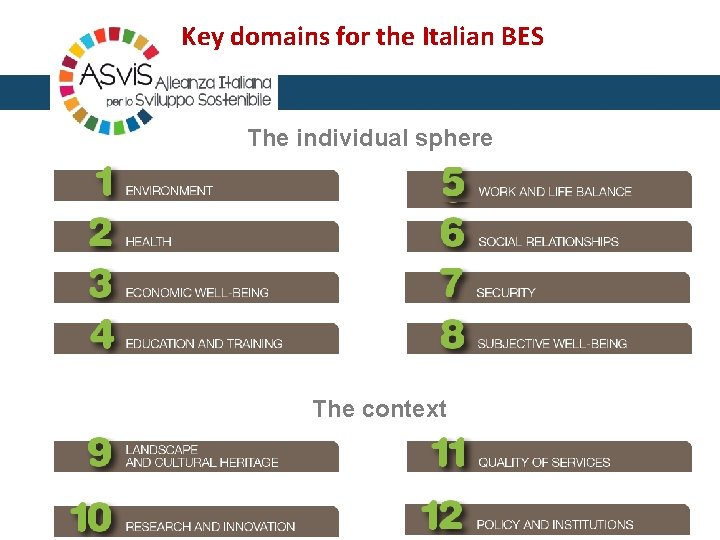
Key domains for the Italian BES The individual sphere The context
Lessons learned • Need for a broad discussion with different actors: • The deliberative process led to a 360°discussion over each theme, taking advantage of available information and analytical models; • The debate made reached an agreement over a number of difficult and new issues, such as Landscape and cultural heritage, soil use, quality of services, research and innovation; • It granted strong legitimacy to the final output. • Increasing interest at local level and chance for convergence: several local institutions are following closely the process, in order to apply the set of indicators in their territories. • Important tool to strengthen the position of the NSI vis-à-vis users, researchers and the society as a whole. • It is a long and delicate process. After nearly two years, the scientific part hasn’t ended yet; its policy application is just beginning. • Evidence-based decision making is the real challenge, and we have to better understand how it works.
Obstacles to use the “Beyond GDP” approach The BES initiative (2010) • Lack of democratic legitimacy. The indicators being put forward have not been agreed democratically and lack public support. • Lack of underpinning theory and narrative. The indicators, unlike GDP, are not underpinned by a consistently articulated theory or ideology, summarised in a politically compelling narrative. • Lack of a clear political imperative. The economic crisis has meant the priority has been to fix the economy in the traditional way. • Technical questions with indicators. There remain disagreements about defining indicators, particularly on whether and how to create a single one. • The need for organisational change. An integrated approach requires working across departmental boundaries or reforming economics departments. • Institutional resistance to change. This always exists and as always reflects the fact that the power and/or success of institutions often depends on traditional objectives and models. • No widely used analytical tools for integrated and innovative economic policy making. The tools needed are still in development. Innovation in civil services is always difficult.
BES in the public budget cycle (2016) Reform of the Budget Law • In April, when the Government presents to the Parliament the three-year Economic and Financial Plan, an analysis of BES indicators over the last three years and the forecasts for the following three years, based on planned policies, has to be included • In February, after the adoption of the Budget Law, the Government has to evaluate its impact on the BES indicators
Obstacles to use the “Beyond GDP” approach The BES initiative (2016) • Lack of democratic legitimacy. The indicators being put forward have not been agreed democratically and lack public support. • Lack of underpinning theory and narrative. The indicators, unlike GDP, are not underpinned by a consistently articulated theory or ideology, summarised in a politically compelling narrative. • Lack of a clear political imperative. The economic crisis has meant the priority has been to fix the economy in the traditional way. • Technical questions with indicators. There remain disagreements about defining indicators, particularly on whether and how to create a single one. • The need for organisational change. An integrated approach requires working across departmental boundaries or reforming economics departments. • Institutional resistance to change. This always exists and as always reflects the fact that the power and/or success of institutions often depends on traditional objectives and models. • No widely used analytical tools for integrated and innovative economic policy making. The tools needed are still in development. Innovation in civil services is always difficult.
Obstacles to use the “Beyond GDP” approach The BES initiative (2016) Two reports on well-being have been published in the UK: Wellbeing and Policy by Gus O’Donnell et al. for the Legatum Institute and Wellbeing in four policy areas, by the UK All-Party Parliamentary Group on Wellbeing Economics. In particular, the second Report recommends that all political parties should set out their approach to well-being in their manifestos and that the Government set out a well -being strategy, including: • objectives and how it intends to achieve them; • the use of a well-being based policy assessment and the development of new tools to support it; • the incorporation of a well-being assessment into budget allocations between and within departments • tools to facilitate the cross-departmental work needed to increase the well-being benefits of policy.
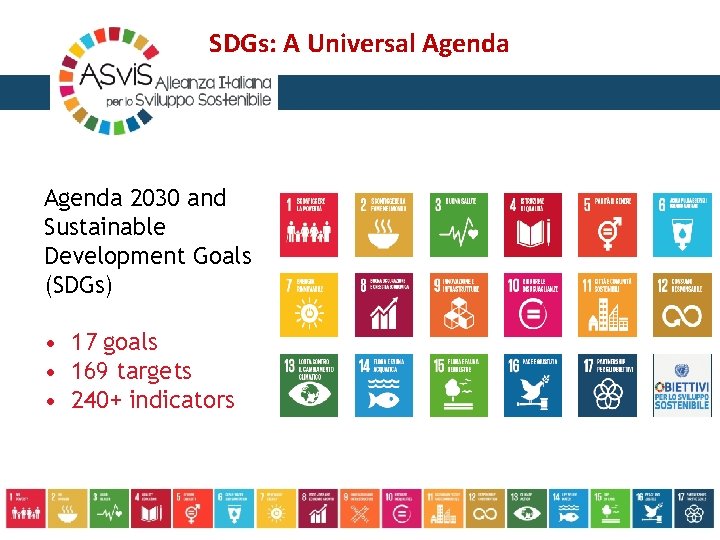
SDGs: A Universal Agenda 2030 and Sustainable Development Goals (SDGs) • 17 goals • 169 targets • 240+ indicators
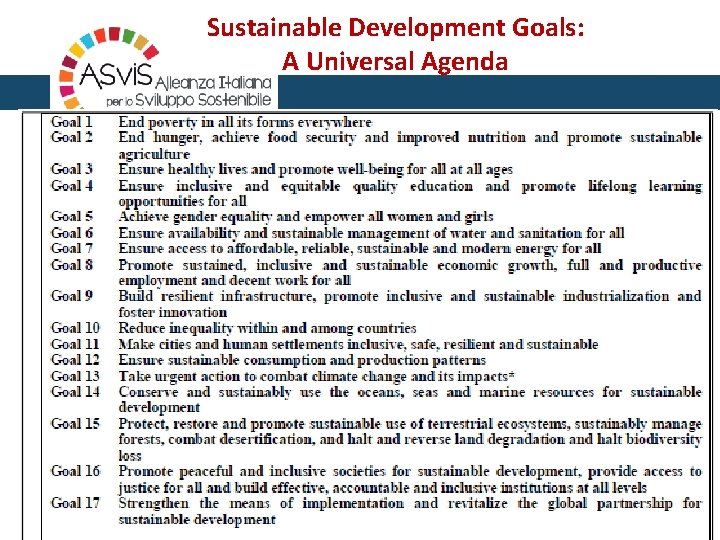
Sustainable Development Goals: A Universal Agenda
SDGs: A Universal Agenda Finally a fully integrated vision of sustainable development, based on four pillars: • Economy • Society • Environment • Istitutions Three principles: • Integration • Universality • Partecipation
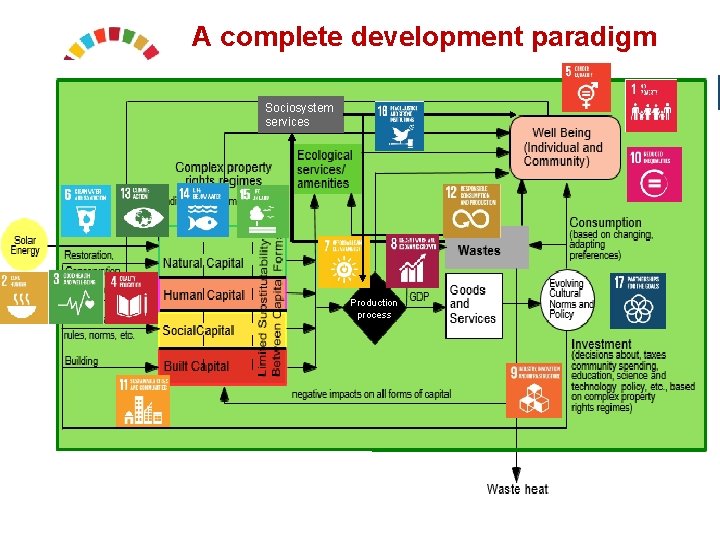
A complete development paradigm Sociosystem services Production process
The “Data Revolution for Sustainable Development” A World that Counts: Mobilising the Data Revolution for Sustainable Development (www. datarevolution. org)
Lessons learned The data revolution is already happening: - New technologies leading to exponential increase in volume and types of data available - Much greater demand for data from all sides - Governments, companies, researchers and citizen groups are in a ferment of experimentation, innovation and adaptation A huge opportunity, with several risks: Privacy, Human rights, Poor quality data, Breakdown of trust Data are not only necessary for monitoring, but also for achieving SDGs Monitoring will require substantial additional investment to: - develop reliable, high-quality data on a range of new subjects, - ensure that no groups are excluded - with an unprecedented level of detail and timeliness
The integrated reporting systems for enterprises
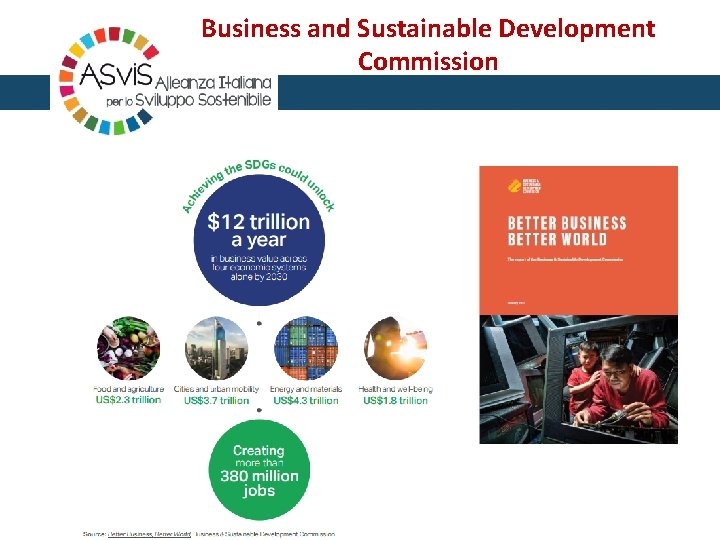
Business and Sustainable Development Commission
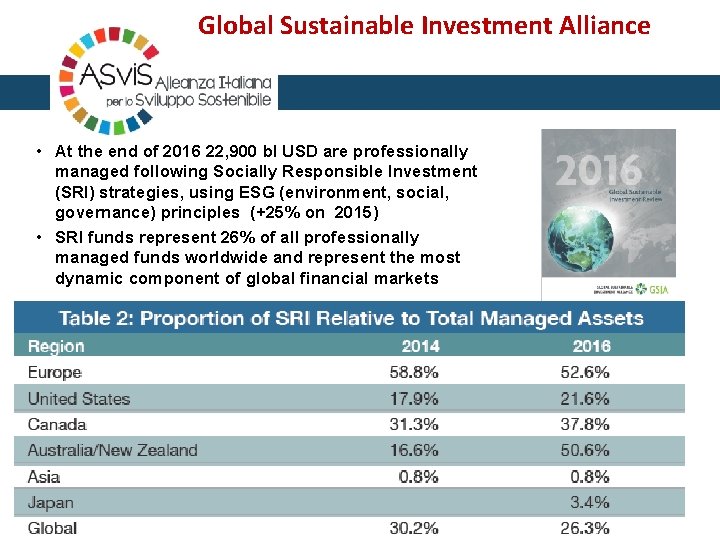
Global Sustainable Investment Alliance • At the end of 2016 22, 900 bl USD are professionally managed following Socially Responsible Investment (SRI) strategies, using ESG (environment, social, governance) principles (+25% on 2015) • SRI funds represent 26% of all professionally managed funds worldwide and represent the most dynamic component of global financial markets
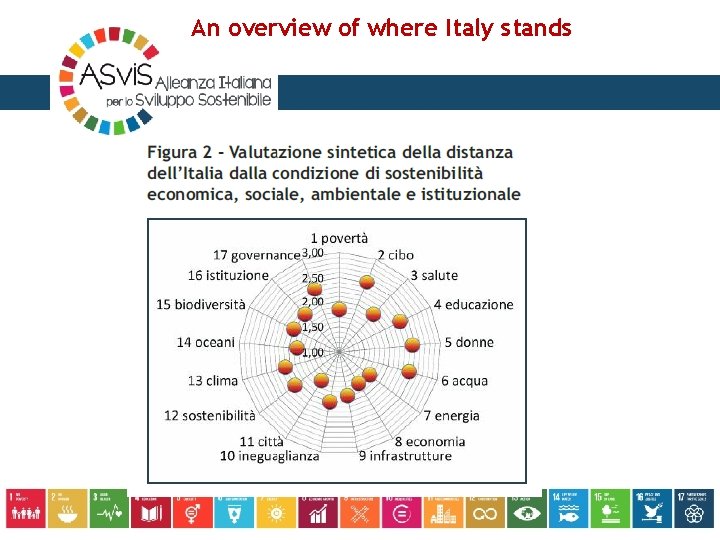
An overview of where Italy stands
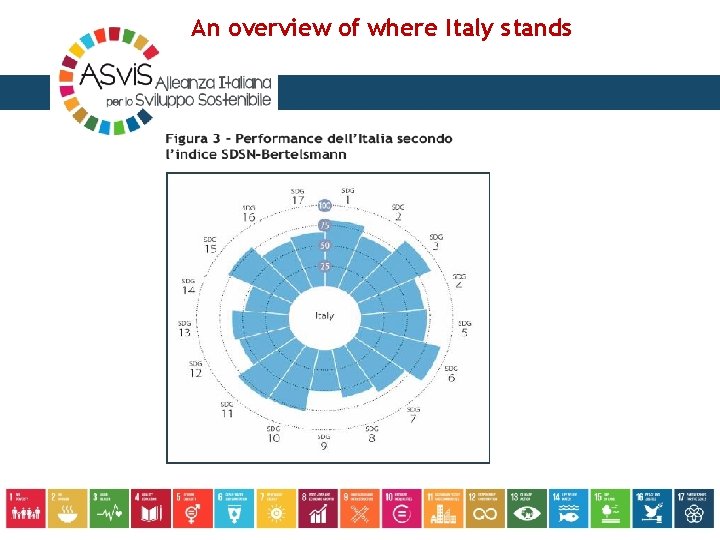
An overview of where Italy stands
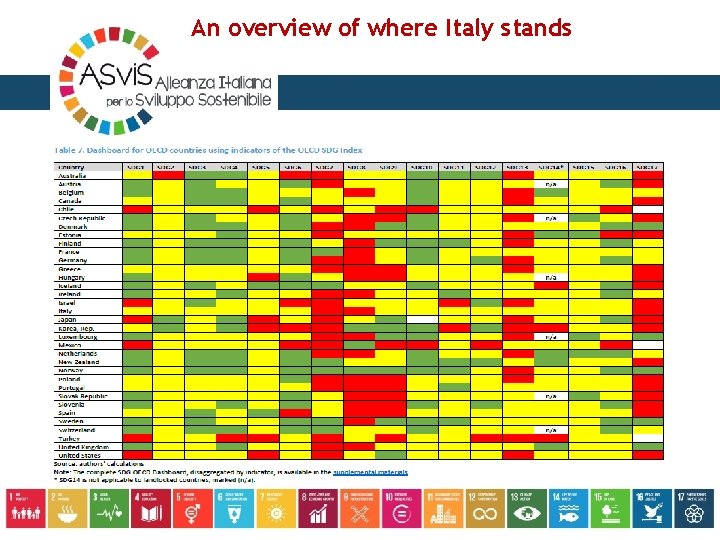
An overview of where Italy stands
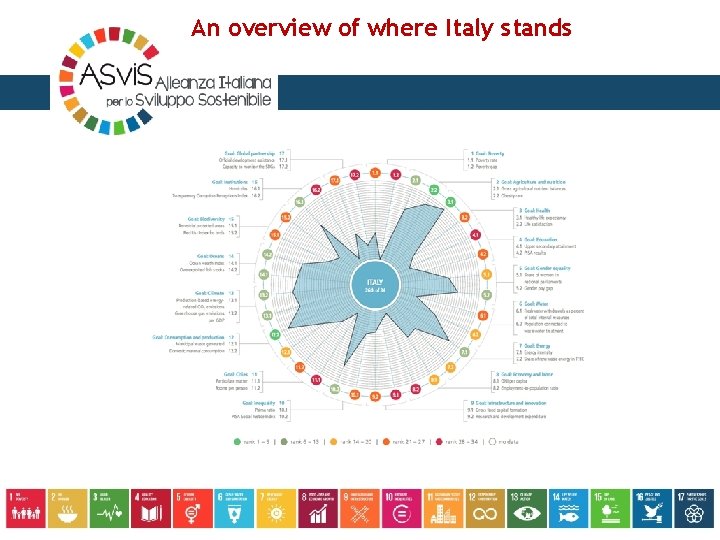
An overview of where Italy stands
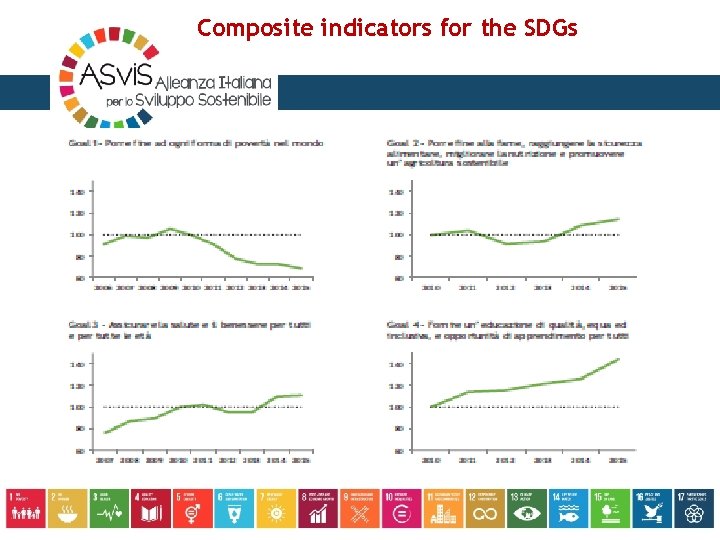
Composite indicators for the SDGs
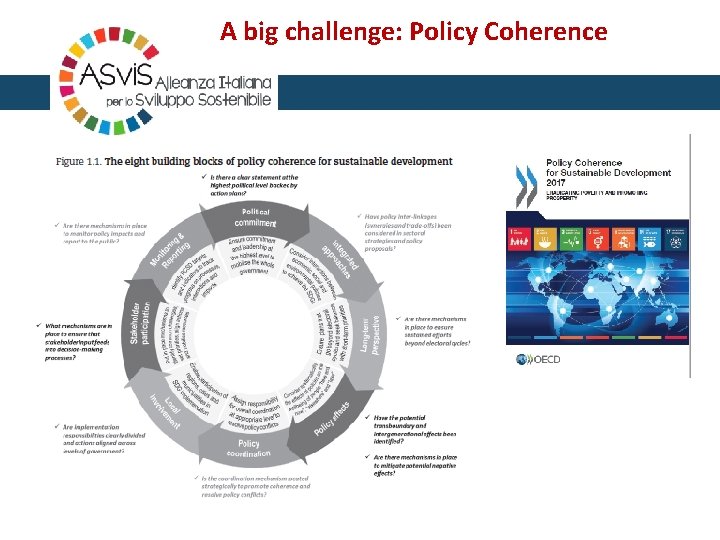
A big challenge: Policy Coherence
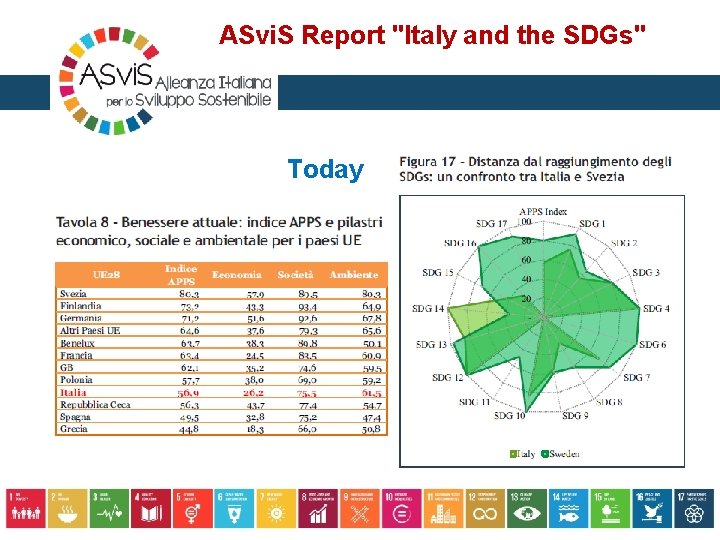
ASvi. S Report "Italy and the SDGs" Today
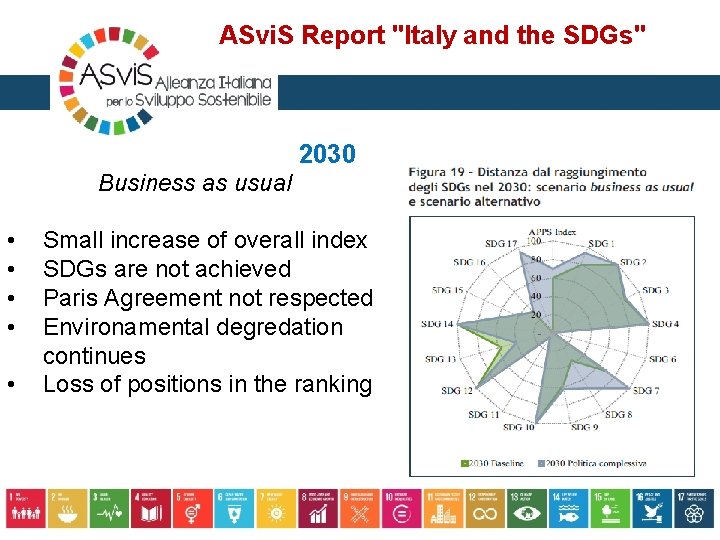
ASvi. S Report "Italy and the SDGs" 2030 Business as usual • • • Small increase of overall index SDGs are not achieved Paris Agreement not respected Environamental degredation continues Loss of positions in the ranking
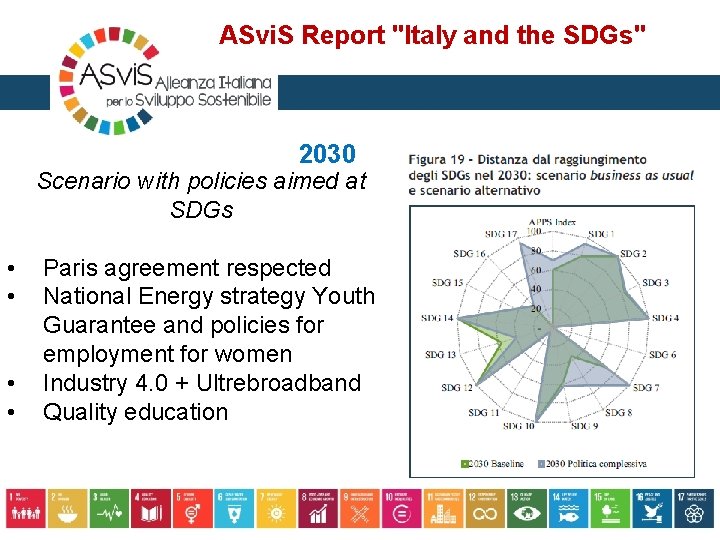
ASvi. S Report "Italy and the SDGs" 2030 Scenario with policies aimed at SDGs • • Paris agreement respected National Energy strategy Youth Guarantee and policies for employment for women Industry 4. 0 + Ultrebroadband Quality education
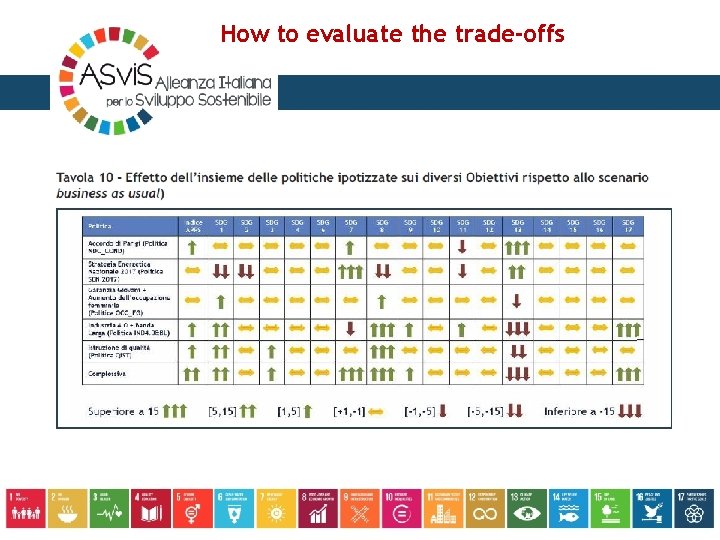
How to evaluate the trade-offs
- Slides: 33