
Indicators for ACSM Objectives Explain the role of
Indicators for ACSM
Objectives • Explain the role of indicators in monitoring and evaluation for ACSM. • Describe the characteristics of well-defined indicators. • Demonstrate how to develop indicator descriptions.

Creating a Framework
What Is an Indicator? • • Clues, signs, or markers. Used to: 1. Track inputs, activities, outputs, and outcomes. 2. Measure progress toward the goal and objectives. Crow and the Pitcher!
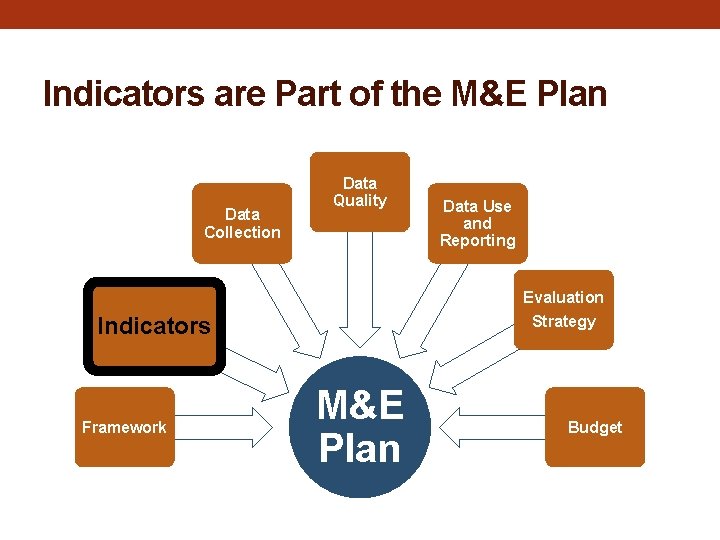
Indicators are Part of the M&E Plan Data Collection Data Quality Data Use and Reporting Evaluation Strategy Indicators Framework M&E Plan Budget
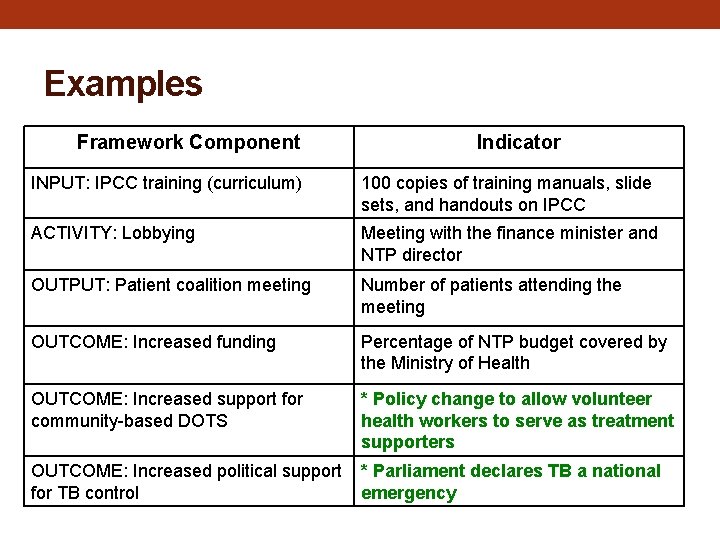
Examples Framework Component Indicator INPUT: IPCC training (curriculum) 100 copies of training manuals, slide sets, and handouts on IPCC ACTIVITY: Lobbying Meeting with the finance minister and NTP director OUTPUT: Patient coalition meeting Number of patients attending the meeting OUTCOME: Increased funding Percentage of NTP budget covered by the Ministry of Health OUTCOME: Increased support for community-based DOTS * Policy change to allow volunteer health workers to serve as treatment supporters OUTCOME: Increased political support for TB control * Parliament declares TB a national emergency
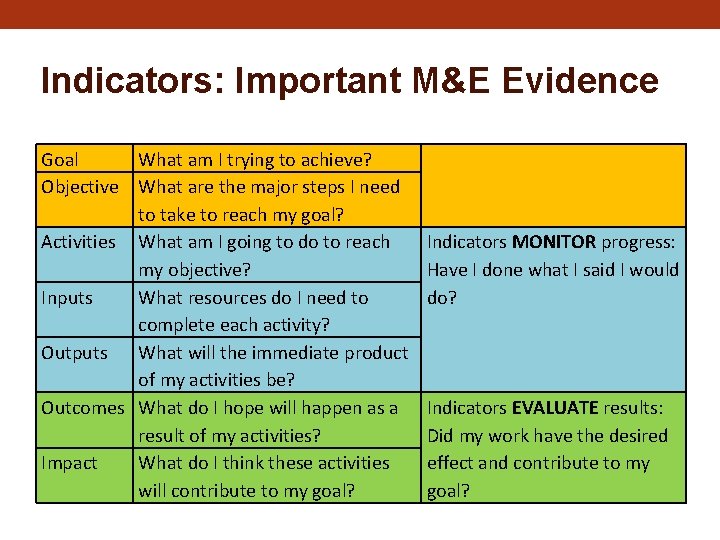
Indicators: Important M&E Evidence Goal What am I trying to achieve? Objective What are the major steps I need to take to reach my goal? Activities What am I going to do to reach my objective? Inputs What resources do I need to complete each activity? Outputs What will the immediate product of my activities be? Outcomes What do I hope will happen as a result of my activities? Impact What do I think these activities will contribute to my goal? Indicators MONITOR progress: Have I done what I said I would do? Indicators EVALUATE results: Did my work have the desired effect and contribute to my goal?
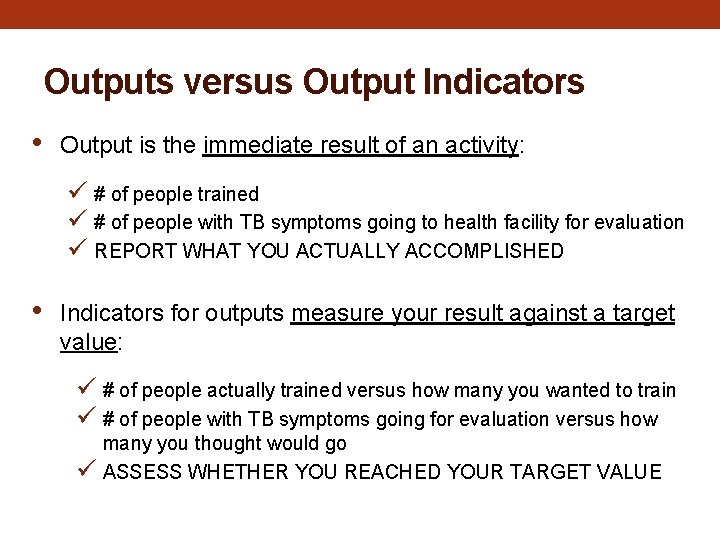
Outputs versus Output Indicators • Output is the immediate result of an activity: ü # of people trained ü # of people with TB symptoms going to health facility for evaluation ü REPORT WHAT YOU ACTUALLY ACCOMPLISHED • Indicators for outputs measure your result against a target value: ü # of people actually trained versus how many you wanted to train ü # of people with TB symptoms going for evaluation versus how ü many you thought would go ASSESS WHETHER YOU REACHED YOUR TARGET VALUE
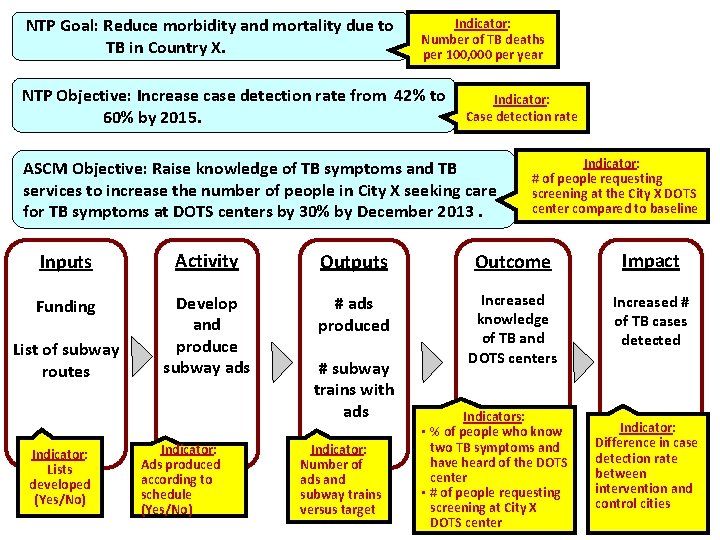
NTP Goal: Reduce morbidity and mortality due to TB in Country X. Indicator: Number of TB deaths per 100, 000 per year NTP Objective: Increase case detection rate from 42% to 60% by 2015. Indicator: Case detection rate ASCM Objective: Raise knowledge of TB symptoms and TB services to increase the number of people in City X seeking care for TB symptoms at DOTS centers by 30% by December 2013. Indicator: # of people requesting screening at the City X DOTS center compared to baseline Inputs Activity Outputs Outcome Impact Funding Develop and produce subway ads # ads produced Increased knowledge of TB and DOTS centers Increased # of TB cases detected List of subway routes Indicator: Lists developed (Yes/No) Indicator: Ads produced according to schedule (Yes/No) # subway trains with ads Indicator: Number of ads and subway trains versus target Indicators: • % of people who know two TB symptoms and have heard of the DOTS center • # of people requesting screening at City X DOTS center Indicator: Difference in case detection rate between intervention and control cities
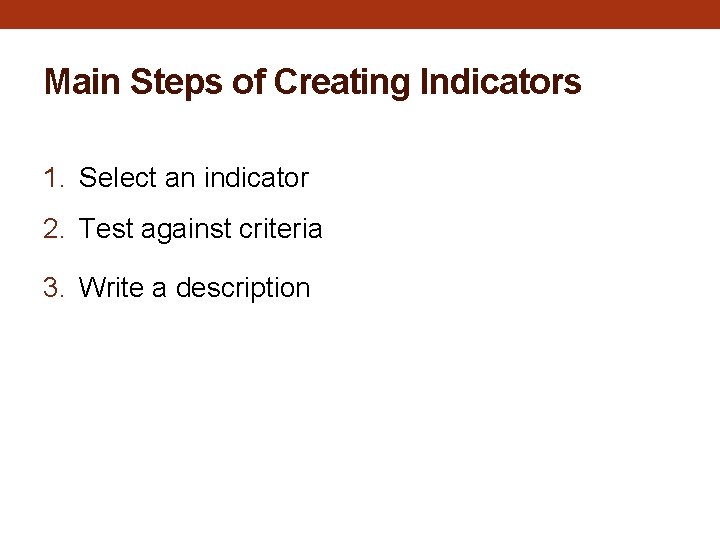
Main Steps of Creating Indicators 1. Select an indicator 2. Test against criteria 3. Write a description
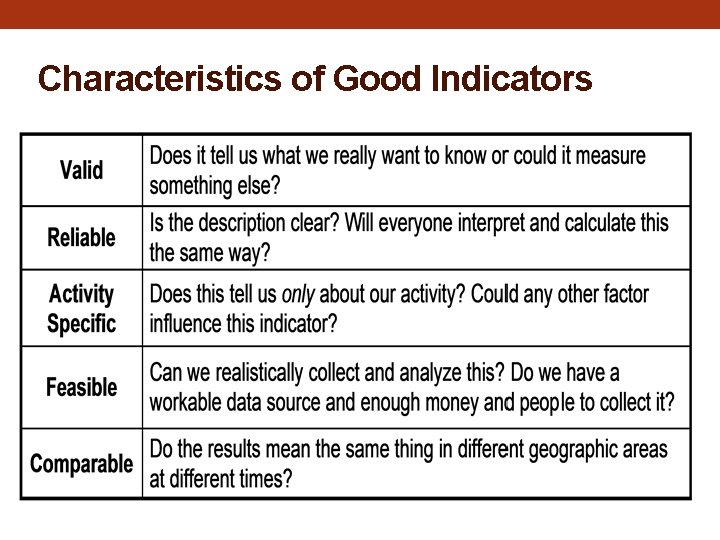
Characteristics of Good Indicators
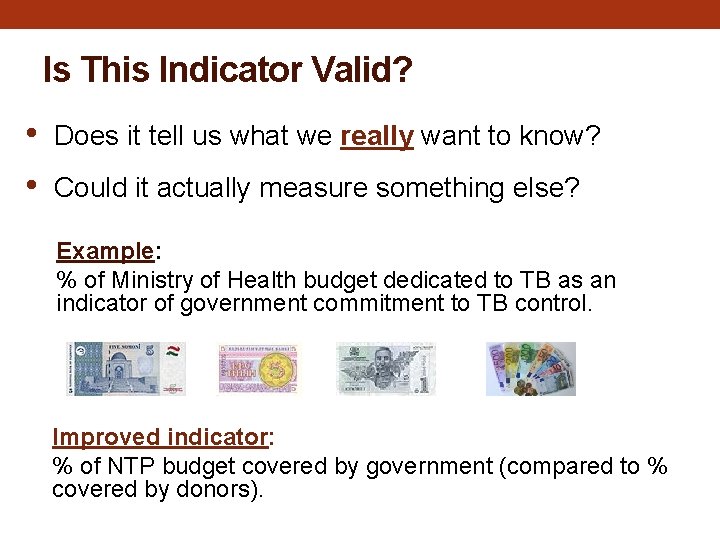
Is This Indicator Valid? • • Does it tell us what we really want to know? Could it actually measure something else? Example: % of Ministry of Health budget dedicated to TB as an indicator of government commitment to TB control. Improved indicator: % of NTP budget covered by government (compared to % covered by donors).
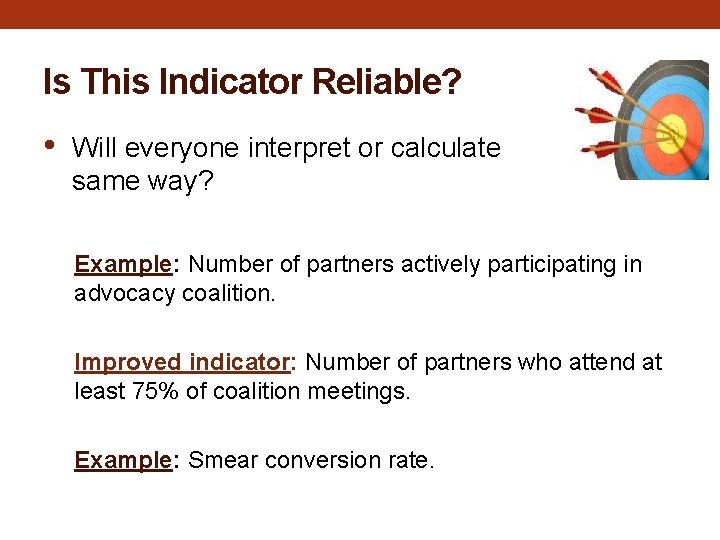
Is This Indicator Reliable? • Will everyone interpret or calculate same way? it the Example: Number of partners actively participating in advocacy coalition. Improved indicator: Number of partners who attend at least 75% of coalition meetings. Example: Smear conversion rate.
Is This Indicator Activity Specific? • Does it tell us about our activity only? Could any other factor (ACSM or not) influence this indicator? Example: % of TB screening clients receiving a smear test as an indicator that providers from our training are referring TB suspects properly. Improved indicator: % of TB screening clients with documented referral for smear microscopy.
Is This Indicator Feasible? • Do we have a realistic data source? Do we have enough money and staff? Example: % of population with correct knowledge about TB symptoms, annually (indicator of a successful communication activity). Alternative indicator: Number of people with possible TB symptoms presenting for diagnosis at specified DOTS clinics.
Comparable • Do the results mean the same thing in different geographic areas at different times? Example: Number of nongovernmental organizations in each region mobilized to participate in World TB Day. Alternative indicator: % of nongovernmental organizations in each region mobilized to participate in World TB Day.
Indicator Descriptions • • • What is the complete definition? What is the data source for this indicator? How do we calculate the value of the indicator? ü Numerator, denominator ü Qualitative criteria
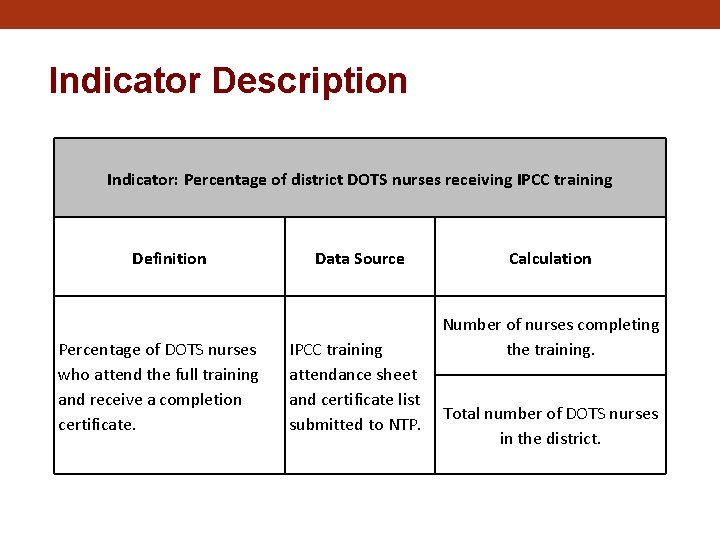
Indicator Description Indicator: Percentage of district DOTS nurses receiving IPCC training Definition Percentage of DOTS nurses who attend the full training and receive a completion certificate. Data Source IPCC training attendance sheet and certificate list submitted to NTP. Calculation Number of nurses completing the training. Total number of DOTS nurses in the district.

Questions?
- Slides: 19