
Indiana BMV Customer Service Enhancement Phase II September
Indiana BMV Customer Service Enhancement Phase II September 2011 Focusing on overall visit times in branch and contact center
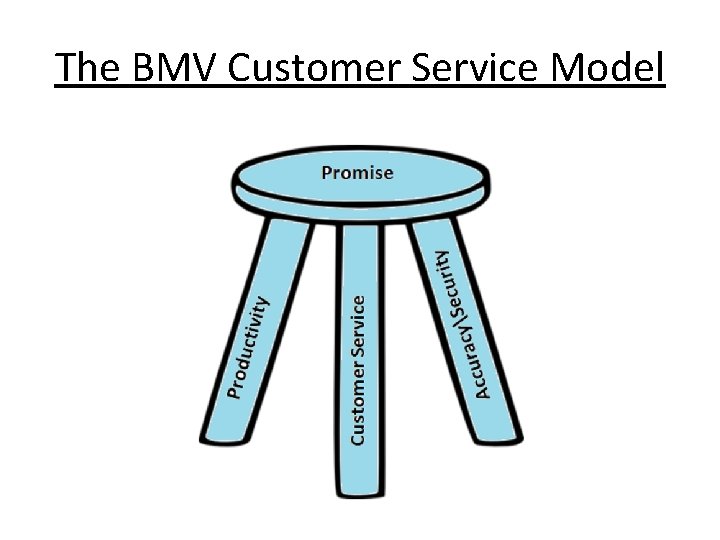
The BMV Customer Service Model
Branch Measurements • The historical “Visit time” measurement has been restricted by available technology and expense. – Thus, • Measurement only captured transaction time. • Branch staffing model was based on historical visit time data, resulting in a “rule of thumb” approach (12, 500 transactions/CSR/Year). • Branch process model (expediting vs. non-expediting) solely based on # of transactions at branch.
Intended &Unintended consequences • • • Critical security enhancements in the credential process, such as Secure. ID and Facial Recognition, have increased transaction times in branch. Creating “customer choice” convenient methods to transact business with the BMV has changed the mix and complexity of branch transactions. – 70% of all Registration renewals (our simplest transaction) are now conducted out of the branch, thus reducing overall volumes but leaving the more complex transactions to be done in the branch. – Overall, 55% of all transactions are conducted outside of the branch. Since visit times reflected only a “transaction” time, it was not “coordinated” effectively with our “productivity/efficiency” requirements. Because the productivity/efficiency metrics were the predominate aspect of the incentive plan, staffing levels were intentionally minimized by branch management to ensure better efficiency levels. – Operating at 50 positions below authorized levels. Finally recognized that Visit time truly equals customer satisfaction! – We are now actually concerned about the customer in the wait area too! Tuesdays & Saturdays are consistently our busiest days (shown in red on chart in 3 slides).
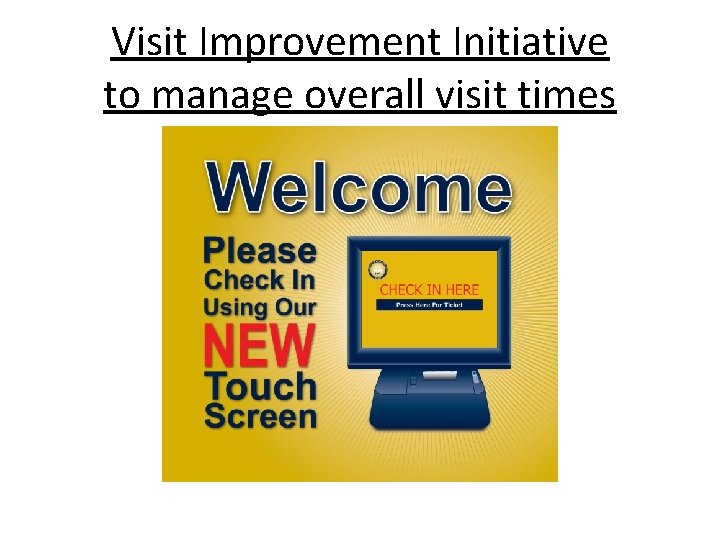
Visit Improvement Initiative to manage overall visit times
Stealth Touch Screens • • • Accurately captures overall visit time from minute customer walks in until the time they pay, allowing for high performance government services that deliver the desired outcomes. Removes the historical visit time veil and balances productivity. Provides outstanding data for management: – Que monitoring at CSR desktop (who’s next & how long they have been waiting). – Real time reporting for BM’s allowing them to respond to circumstances presented. – Real time monitoring for Regional Managers using new mgt tools. • Creates sophisticated model for: – Staffing formula. – Expediting procedures. – Process improvement / cost reduction opportunities. • • • Largest 69 branches deployed, 14 in process (represents 80% of all visits). Current Average Overall Visit Time – MTD September 14: 33 min. KPI: Less than 20 minutes
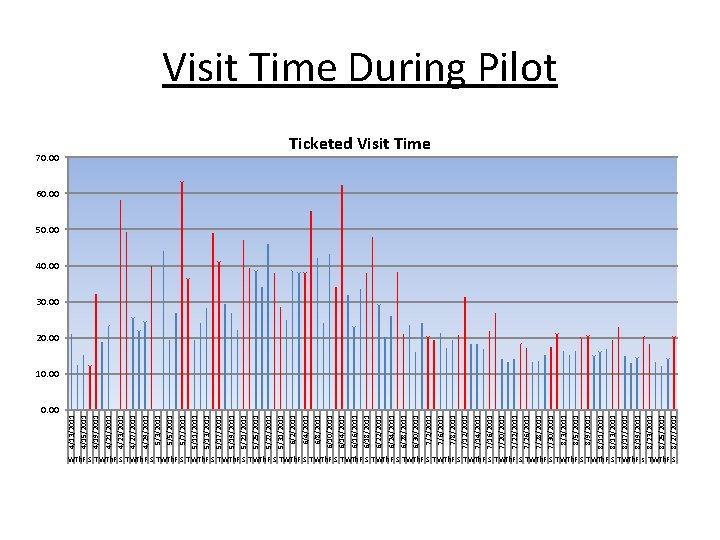
4/13/2011 0. 00 8/27/2011 8/25/2011 8/23/2011 8/19/2011 8/17/2011 8/13/2011 8/11/2011 8/9/2011 8/5/2011 8/3/2011 7/30/2011 7/28/2011 7/26/2011 7/22/2011 7/20/2011 7/16/2011 7/14/2011 7/12/2011 7/8/2011 7/6/2011 7/2/2011 6/30/2011 6/28/2011 6/24/2011 6/22/2011 6/18/2011 6/16/2011 6/14/2011 6/10/2011 6/8/2011 6/4/2011 70. 00 6/2/2011 5/31/2011 5/27/2011 5/25/2011 5/21/2011 5/19/2011 5/17/2011 5/13/2011 5/11/2011 5/7/2011 5/5/2011 5/3/2011 4/29/2011 4/27/2011 4/23/2011 4/21/2011 4/19/2011 4/15/2011 Visit Time During Pilot Ticketed Visit Time 60. 00 50. 00 40. 00 30. 00 20. 00 10. 00 WTh. F S T WTh. F S T WTh. F s T WTh. F S
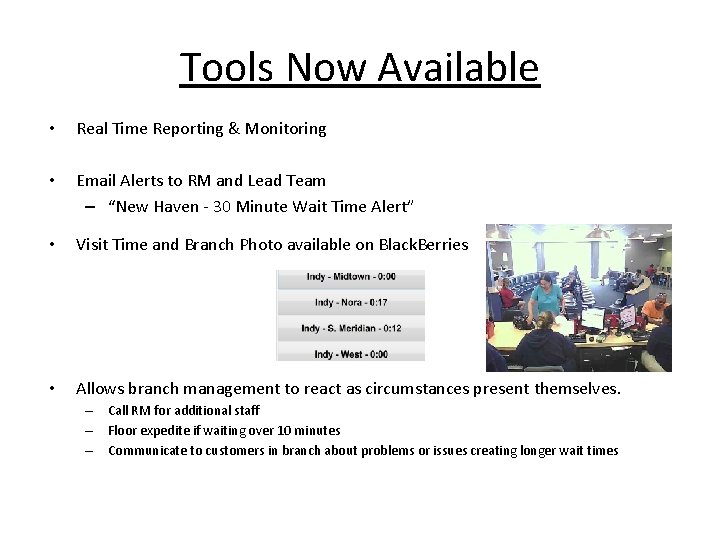
Tools Now Available • Real Time Reporting & Monitoring • Email Alerts to RM and Lead Team – “New Haven - 30 Minute Wait Time Alert” • Visit Time and Branch Photo available on Black. Berries • Allows branch management to react as circumstances present themselves. – Call RM for additional staff – Floor expedite if waiting over 10 minutes – Communicate to customers in branch about problems or issues creating longer wait times
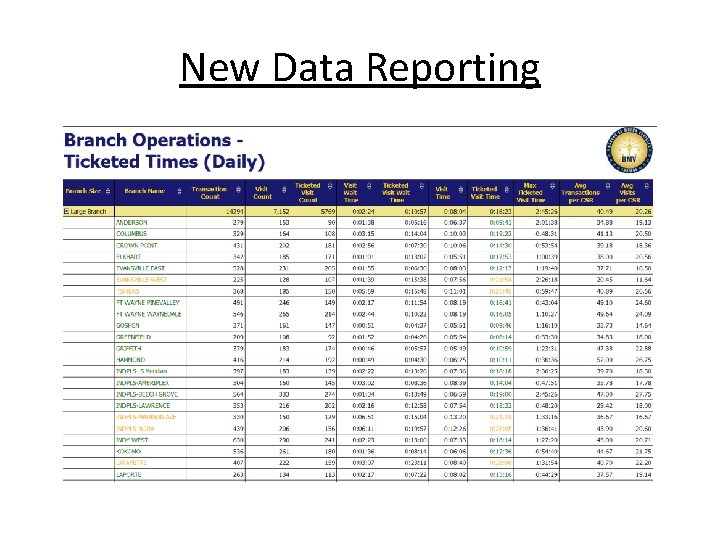
New Data Reporting
Branch Management Focus • Instill sense of urgency / React to circumstances • Enhance customer service Culture / Communicate with customers. • Optimize staffing (balance productivity with visit times). • Improve processes / Reduce costs • Simply allows BM to better manage their branch with a “common sense” management approach. • Revise KPI’s. • Update incentives to inspire outstanding performance.
Add’l Stealth Tools in Development • • As more data is captured, we will have a greater understanding of customer behavior through transaction distribution (hour by hour, day by day, etc), enhancing our ability to forecast as opposed to only reacting as we do today. This could possibly assist in the smoothing of customer flow. Currently programming system to collect number of customers that come to the branch, but don’t generate a “visit” because they didn’t have the proper documentation, forgot their credit card, etc. – Allows for a better staffing formula. Current formula doesn’t recognize this activity at all. Time is still invested with these customers, even though a formal “visit” has not been generated. Detailed view of all ticketed visits by branch and day; shows start time, wait time, end time and status of all visits, should we ever need to investigate a transaction in the future. The possibilities for improvement are endless with this management tool!
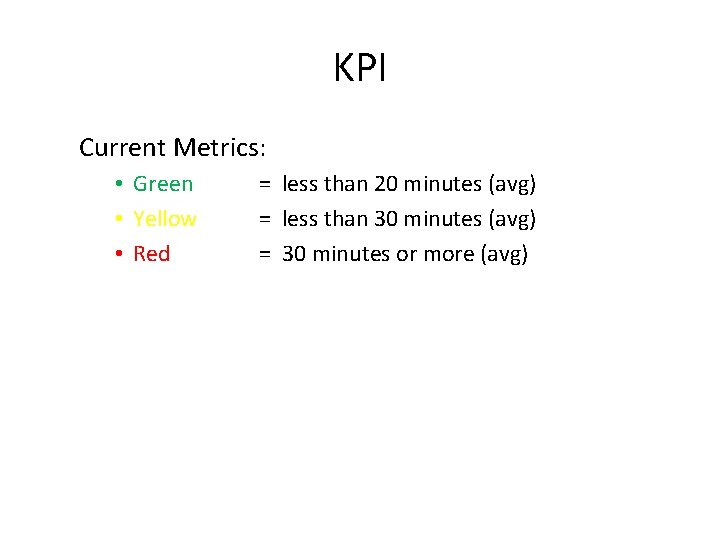
KPI Current Metrics: • Green • Yellow • Red = less than 20 minutes (avg) = less than 30 minutes (avg) = 30 minutes or more (avg)
Contact Center Enhancement • Customer-centric changes in the contact center have drastically reduced the number of complaints. – “one call, one resolution” results driven philosophy allows CSR the time to resolve the customers problem/issue on the first touch. – Realizing a true “culture change” as experienced in branches several years ago. – Another BMV success.
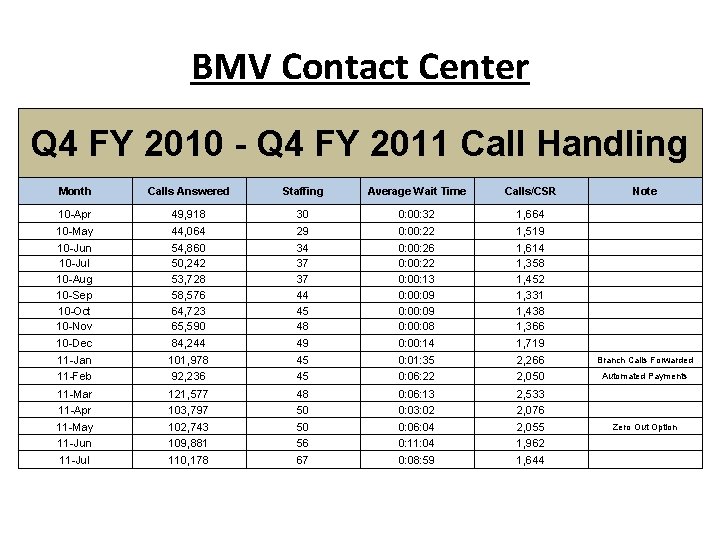
BMV Contact Center Q 4 FY 2010 - Q 4 FY 2011 Call Handling Month Calls Answered Staffing Average Wait Time Calls/CSR Note 10 -Apr 49, 918 30 0: 00: 32 1, 664 10 -May 44, 064 29 0: 00: 22 1, 519 10 -Jun 10 -Jul 10 -Aug 10 -Sep 10 -Oct 10 -Nov 54, 860 50, 242 53, 728 58, 576 64, 723 65, 590 34 37 37 44 45 48 0: 00: 26 0: 00: 22 0: 00: 13 0: 00: 09 0: 08 1, 614 1, 358 1, 452 1, 331 1, 438 1, 366 10 -Dec 84, 244 49 0: 00: 14 1, 719 11 -Jan 101, 978 45 0: 01: 35 2, 266 Branch Calls Forwarded 11 -Feb 92, 236 45 0: 06: 22 2, 050 Automated Payments 11 -Mar 121, 577 48 0: 06: 13 2, 533 11 -Apr 11 -May 11 -Jun 103, 797 102, 743 109, 881 50 50 56 0: 03: 02 0: 06: 04 0: 11: 04 2, 076 2, 055 1, 962 Zero Out Option 11 -Jul 110, 178 67 0: 08: 59 1, 644
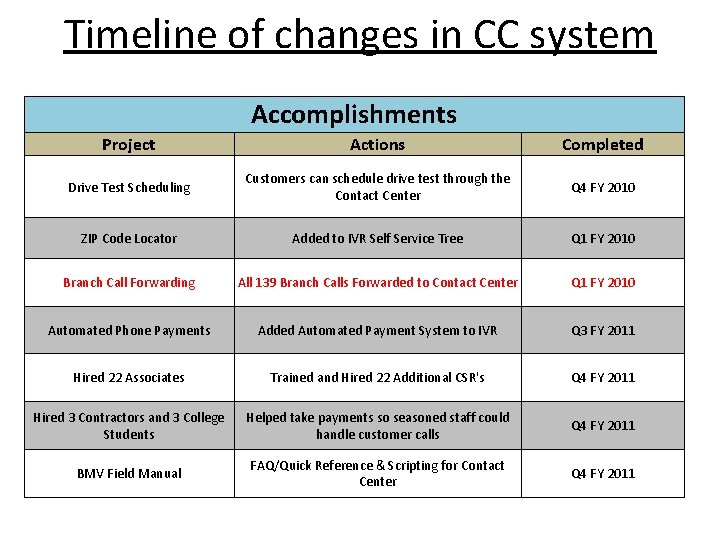
Timeline of changes in CC system Accomplishments Project Actions Completed Drive Test Scheduling Customers can schedule drive test through the Contact Center Q 4 FY 2010 ZIP Code Locator Added to IVR Self Service Tree Q 1 FY 2010 Branch Call Forwarding All 139 Branch Calls Forwarded to Contact Center Q 1 FY 2010 Automated Phone Payments Added Automated Payment System to IVR Q 3 FY 2011 Hired 22 Associates Trained and Hired 22 Additional CSR's Q 4 FY 2011 Hired 3 Contractors and 3 College Students Helped take payments so seasoned staff could handle customer calls Q 4 FY 2011 BMV Field Manual FAQ/Quick Reference & Scripting for Contact Center Q 4 FY 2011
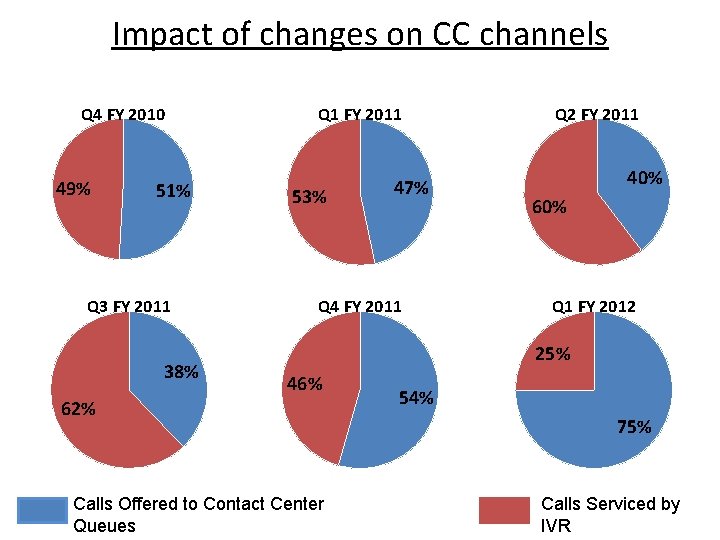
Impact of changes on CC channels Q 4 FY 2010 49% 51% Q 3 FY 2011 38% Q 1 FY 2011 53% 47% Q 4 FY 2011 Q 2 FY 2011 40% 60% Q 1 FY 2012 25% 46% 62% Calls Offered to Contact Center Queues 54% 75% Calls Serviced by IVR
Achievements • All Branch calls are received in the Contact center, freeing up branch staff to process transactions. • MTD August average CC wait time to speak with a CSR is = 6 min. and 46 sec. • Managing staffing levels to meet objectives. • Implemented Contact Center Dual Monitor Information System (CCDMIS) giving our CSR’s a 2 nd monitor so they can display the customer record and the BMV “Field Manual Help System” for faster and more consistent resolutions to inquiries. • Re-write of Self Service Tree to be more customer friendly and convenient. • Working toward conversational email inquiries, as well.
KPI • Current metrics: • Green • Yellow • Red = < 6 minute wait time = < 10 minute wait time = > 10 minute wait time
- Slides: 18