Increases in Endotracheal Tube Resistance Are Unpredictable Relative

Increases in Endotracheal Tube Resistance Are Unpredictable Relative to Duration of Intubation

Background n n Accumulated secretions after intubation can affect the resistance of an endotracheal tube (ETT). Our objective was to measure extubated patient tubes and size-matched controls to evaluate differences in resistance.

Materials and Methods n The West Virginia University Institutional Review Board approved this study and waived the need for consent. The purpose of the study was to evaluate random ETTs from extubated adult patients in the ICU and compare them to new size-matched control tubes for changes in resistance as measured by pressure drop. Pressure drop, a measurement in physics used to quantify the change in pressure across a system, reflects the degree of resistance to flow. 17 The pressure drop, as a function of flow rate, was measured. The primary end point was the pressure drop of an ETT when subjected to standardized conditions and flows. Secondary end points included identification of tubes that demonstrated a pressure drop that exceeded the maximum pressure drop in the next smaller control group. The relationship of duration of intubation and increase in pressure drop was evaluated. Intubation times as short as 1 h were included.

Setting n n n The measurements were performed in the Department of Pathology under a class II biological safety hood. The personnel performing the measurements were blinded to all patient information. Patient tubes were obtained from a medical-surgical adult ICU and were randomly selected. While intubated, patients are suctioned using a closed inline catheter as needed. A humidification system (MR 850 Respiratory Humidification System; Fisher & Paykel; Auckland, New Zealand) was used to maintain 100% relative humidity at 37°C at the carina. Circuits were checked every 3 h and changed every 7 days.

Testing Design and Calibration n n We used a mass flowmeter and pressure transducer (PTS 2000; Mallinckrodt, Inc; St. Louis, MO) with an attached computer using specialized software (“Breath. Lab” PTS, version 2. 0; Mallinckrodt, Inc) for testing. The pressure drop at a given mass flow rate was logged analyzed over an incremental range of flow rates. Pressure drop was measured by opening a needle valve flow controller attached to compressed air set to a pressure of 30 ± 5 lb per square inch at a controlled rate from 0 to 100 L/min in 30 s. The system was calibrated by setting the auto zero for the high and low pressure. After calibration, the instrument was attached to the pressurized air source, and the regulator was set to 30 ± 5 lb per square inch.

n n To minimize the possibility of exposure to biohazard material, a high-efficiency particulate air (HEPA) breathing filter (Iso-Gard HEPA Light Filter 28022; Hudson RCI; Durham, NC) was attached to the proximal end of the ETT to collect any material expelled. To evaluate the contribution of the HEPA filter to the total pressure drop, 20 filters were tested, and the average for the filter alone was established for each flow rate. The values were as follows: 1. 11 cm H 2 O at 30 L/min; 2. 67 cm H 2 O at 60 L/min; and 4. 59 cm H 2 O at 90 L/min. Because pressure resistances in series are additive, these numbers were subtracted from the measured pressure drop.
 standard ETTs")
Control Tubes n n 9 or 10 new (based on statistical relevance) standard ETTs (Hi-Lo; Mallinckrodt, Inc), with ID sizes 7. 0 mm through 8. 5 mm, were evaluated. Each ETT was placed in a fixed plastic curved mold that matched International Organization for Standardization standard 4. 716 and approximated anatomic positioning in vivo. The distal end of the ETT was then connected using the cuff to secure the tube in place. A HEPA filter was placed on the proximal end of the tube to provide consistency when comparing them to the patient tubes.

n n n Figure 1 shows a schematic of the apparatus setup. The valve was opened at a controlled rate from 0 to 100 L/min over 30 s. The data acquisition rate was set to 72 measurements per second. Data collected included sample time, air temperature, barometric pressure, sample flow, and oxygen concentration. Data were organized by tube size and evaluated to determine the pressure drop (in centimeters of H 2 O) at 30, 60, and 90 L/min.

Schematic drawing of the pressure drop test apparatus. Wilson A M et al. Chest 2009; 136: 1006 -1013 © 2009 by American College of Chest Physicians

Extubated Tubes n n n ETTs were randomly collected from 71 adult patients at the time of extubation. Extubation was performed in a standardized way that includes suctioning to remove mobile secretions in the airway. Each tube was immediately placed in a biohazard bag with sterile gauze wetted with 4 m. L of saline solution and sealed to avoid dehumidification during transportation to the laboratory. The date and time of intubation and extubation were documented. Each tube was connected to the pressure measurement apparatus, and measurements were obtained using the same method as for the controls.

n n n Data collected for each tube included size, duration of intubation, and the measured pressure drop at 30, 60, and 90 L/min. Data were organized by tube size, and pressure drops were tabulated and compared with size-matched controls. The data were reviewed analyzed by a statistician. Specific software (JMP; SAS Institute Inc; Cary, NC) was used to perform an analysis of variance approach in a repeated measures design, where the repeat factors were 30, 60, and 90 L/min flow. The Mann-Whitney U test was used to evaluate for significance.

Results Control Tubes n The measured pressure drop of a tube was directly related to diameter and flow. n This association to tube size was consistent with all three flow rates. n For each size, there was an increase in pressure drop that was dependent on flow, and the measured pressure drop at each flow level had a very small degree of variability. n These results are shown in Figure 2.
 for control tube sizes")
Individual pressure drop measurements (in centimeters of H 2 O) for control tube sizes 7. 0 mm through 8. 5 mm ID measured at flow rates of 30 L/min (top), 60 L/min (middle), and 90 L/min (bottom). © 2009 by American College of Chest Physicians Wilson A M et al. Chest 2009; 136: 1006 -1013

Extubated Patient Tubes n Figure 3 demonstrates the differences in the pressure drop of extubated patient tubes compared with sizematched controls at flow rates of 30, 60, and 90 L/min. n There was no interaction between tube size and pressure drop. n There was a significant difference among the three flow rates from the patient tubes. n Within each size, there was a significant degree of variation in pressure drop.

n n In all sizes, a difference in the pressure drop was noted between controls and extubated tubes at each flow rate. As the flows increased, the amount of the pressure drop increased. At each flow rate, the extubated tubes were compared with the controls of equivalent size to evaluate the frequency with which the pressure drop in the 71 patient tubes exceeded 3 SDs of the normal range of pressure drop in the control group. Results revealed a change of > 3 SDs in 53 of 71 tubes (75%) at 30 L/min, 52 of 71 tubes (73%) at 60 L/min, and 56 of 71 tubes (79%) at 90 L/min.

Measured pressure drop in size-matched control tubes compared with extubated patient tubes evaluated at flow rates of 30 L/min (top), 60 L/min (middle), and 90 L/min (bottom) Wilson A M et al. Chest 2009; 136: 1006 -1013 © 2009 by American College of Chest Physicians

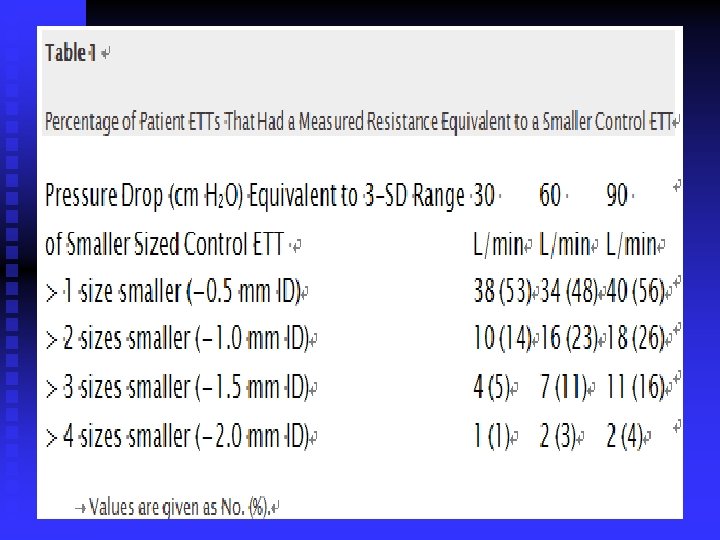
n The pressure drop of the patient tubes was compared with that of the control group in the next smaller tube size at each flow rate to evaluate the frequency with which the measured pressure drop in the patient tubes was equivalent to 3 SDs of the pressure drop of tubes of the smaller size.

n n Table 1 shows the percentage of patient tubes in which the pressure drop was equivalent to the smaller sized control tubes. At 60 L/min, 34 of 71 extubated tubes (48%) had a pressure drop equivalent to the next smaller size of control tubes; 16 of 71 tubes (23%) had a pressure drop equal to an ETT two sizes smaller. This trend was seen for all tube sizes and all flow rates.

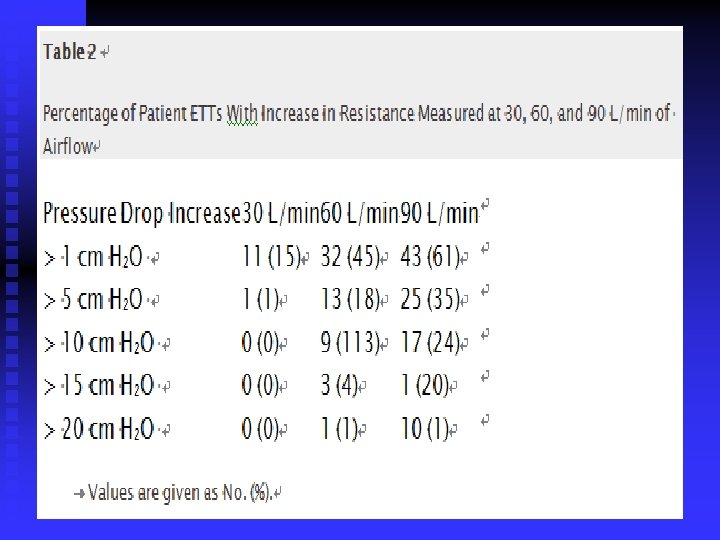
n n Table 2 shows the change in pressure drop for all patient tubes. This demonstrates the measured change in pressure in each patient tube in increments of 5 cm H 2 O relative to the three flow rates. At 60 L/min, 18% of all patient ETTs had a change in pressure drop of at least 5 cm H 2 O, and at 90 L/min, 35% had at least a gradient of 5 cm H 2 O.

n n The relationship between the duration of intubation and the increase in pressure drop, or resistance, was evaluated. Figure 4 shows the duration of intubation in hours relative to the pressure drop in the patient tube at each flow rate. The difference in pressure drop among tubes at different flow rates was an unpredictable event.
,")
Relationship of the duration of intubation to pressure drop measured at 30 L/min (top), 60 L/min (middle), and 90 L/min (bottom). Wilson A M et al. Chest 2009; 136: 1006 -1013 © 2009 by American College of Chest Physicians

Discussion n n ETT size is a critical factor of airway resistance. Clinicians often must make adjustments in the amount of support to help the patient overcome the resistance of the system and the ETT. Clinicians assume this resistance is minimized with a properly sized ETT. In 73 to 79% of the extubated tubes, the measured pressure drop exceeded 3 SDs of that in size-matched controls across the three flow rates. This demonstrates that once placed in a patient, the ID of the tube cannot be consistently predicted based on manufacturing size, and performance of the ETT may be reduced.

n n Approximately 50% of patient tubes had a pressure drop equal to one tube size smaller. Patient tubes had a pressure drop equivalent to a control that was two sizes smaller in 23% of tubes at 60 L/min, and in 25% of tubes at 90 L/min. A patient intubated with a tube with an ID of 7. 5 mm may have the resistance of a tube with an ID of 6. 5 mm about 25% of the time. It is striking that in approximately 20 to 35% of patient tubes, the increase in pressure drop was > 5 cm H 2 O. At 90 L/min, 14% of the ETTs had an increase of > 20 cm H 2 O.
 have become a common method for evaluating suitability for")
n Spontaneous breathing trials (SBTs) have become a common method for evaluating suitability for extubation. One method for performing an SBT is to place the patient on an aerosolized T-piece. According to our data, this method may not provide the 5 cm H 2 O pressure to compensate for the likely increased resistance in many patients. This may cause a patient to fatigue prematurely.

n n Increased ETT resistance is associated with a longer period of intubation (> 7 days). The purpose of this study was to quantify the amount of pressure drop or resistance that developed in an ETT after being placed in a patient. The data demonstrate that there is an accumulation of secretions that causes a highly variable, unpredictable increase in ETT resistance. Because this was a quantification study, no data were collected relative to patient disease acuity or comorbidities, which is another limitation of our study.

Conclusions n n n ETTs are manufactured in strict accordance to regulation of size. Once placed in the patient, organized secretions accumulate that impact the resistance of the ETT. This change in the tube can be highly variable and occurs for all sizes. The extent of increased resistance in any one patient may be unpredictable. This is clinically important because approximately 50% of the ETTs have a pressure drop of at least 5 cm H 2 O and can be > 20 cm H 2 O. In 70 to 80% of cases, the resistance is > 3 SDs above the size-matched controls. Although industry standards very tightly regulate the ID, this becomes irrelevant once the tube is used in patient care. This effect is independent of time, is unpredictable, and begins to occur immediately in some patients.
- Slides: 28