Income Distribution How free markets create divide wealth

Income Distribution How free markets create & divide wealth

Distribution of Income • Egalitarian Society– equal society – Free markets focus on efficiency not equality • Free markets produce tremendous wealth but also a large gap between rich & poor – record gap between the rich and poor in USA today – Globalization has exacerbated this trend

The Rich get Richer
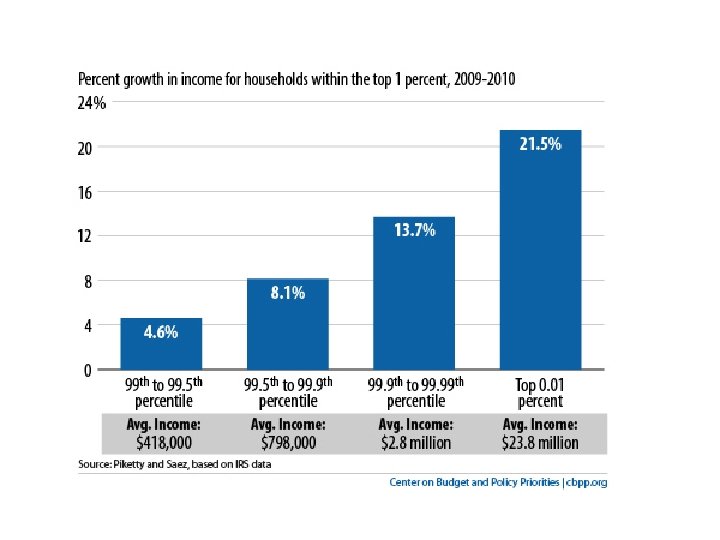

Wealth vs. Income • Top 1% has 21% of Income • Top 1% has 40% of Wealth Bottom 40% has less than 1% of wealth

Do we need a more Progressive Income Tax? Tax Rate Single 10% $0 – $8, 350 15% $8, 351– $33, 950 25% $33, 951 – $82, 250 28% $82, 251 – $171, 550 33% $171, 551 – $372, 950 35% $372, 951+

Where do YOU want to live? Country A Country B GDP per capita = $20, 000 per year GDP per capita = $60, 000 per year Which country do YOU want to live in? Population = 100, 000 Each person earns $20, 000 GDP = 2 billion or $20, 000 per capita 400 people earn $15 million 99, 600 earn $1, 000 per year GDP = 6 billion or $60, 000 per capita

Measuring Income Inequality • How do you best measure income inequality? – Average income – Median income Flawed measures of income gap • Lorenz curve precisely measures income inequality. – Straight line represents “perfect” income equality

Lorenz Curve

Gini Index Summary • • Measures the distance from line of “perfect equality” to Lorenz Curve Gini Index ranges from Zero to 1 An index of 0 (zero) means perfect EQUALITY (on line) As the Gini Index moves from 0 1 inequality increases

Lorenz Curve Review France: . 34 Line of Income equality Gini Coefficient 0 -1 USA: . 46

Gini Index by Country Sweden =. 23 USA =. 46 England =. 36 Germany =. 28 France =. 32 Brazil =. 59 South Africa =. 58 Japan =. 25

Gini Coefficient of WEALTH =. 82

Income Distribution Rising • Why Now? http: //www. pbs. org/newshour/businessdesk/2012/03/author-charles-murray-on-bubbl. html
- Slides: 14