
In the past 20 years 4 4 billion
In the past 20 years, 4. 4 billion people – nearly two-thirds of the world’s population – have been caught up in natural disasters. Causing $2 trillion in damage, the equivalent of the world’s annual aid budget twenty-five times over. "As you put more and more people in harms way, you make a disaster out of something that before was just a natural event, " Klaus Jacob, senior research scientist at Columbia University's Lamont‐Doherty Earth Observatory. It’s far cheaper to prepare well for disasters than to try to pick up the pieces afterwards. More importantly, it can save a lot of lives. Photo: Marco di Lauro/GETTY
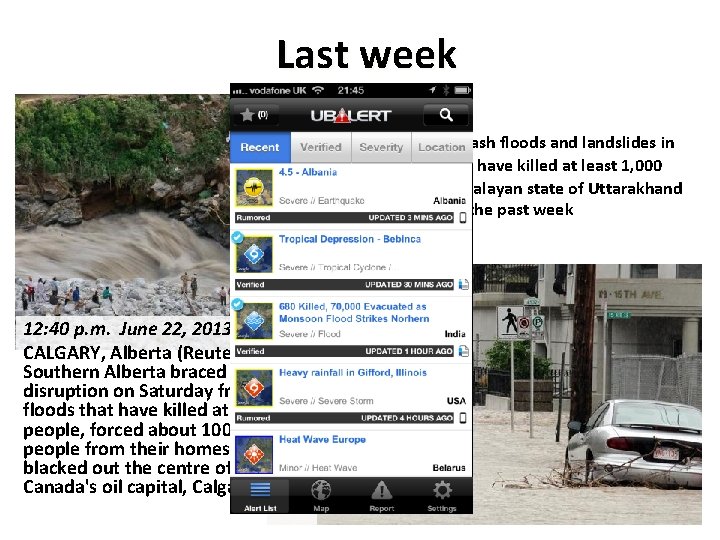
Last week NEW DELHI — Flash floods and landslides in northern India have killed at least 1, 000 people in the Himalayan state of Uttarakhand in the past week 12: 40 p. m. June 22, 2013 CALGARY, Alberta (Reuters) Southern Alberta braced for more disruption on Saturday from floods that have killed at least two people, forced about 100, 000 people from their homes and blacked out the centre of Canada's oil capital, Calgary.
Natural Hazards, Un. Natural Disasters Earthquakes, droughts, floods, and storms are natural hazards, but the unnatural disasters are deaths and damages that result from human acts of omission and commission. Natural Hazards, Un. Natural Disasters The Economics of Effective Prevention Published 2010 http: //www. gfdrr. org/sites/gfdrr. org/files/nhud/files/NHUD‐ Report_Full. pdf
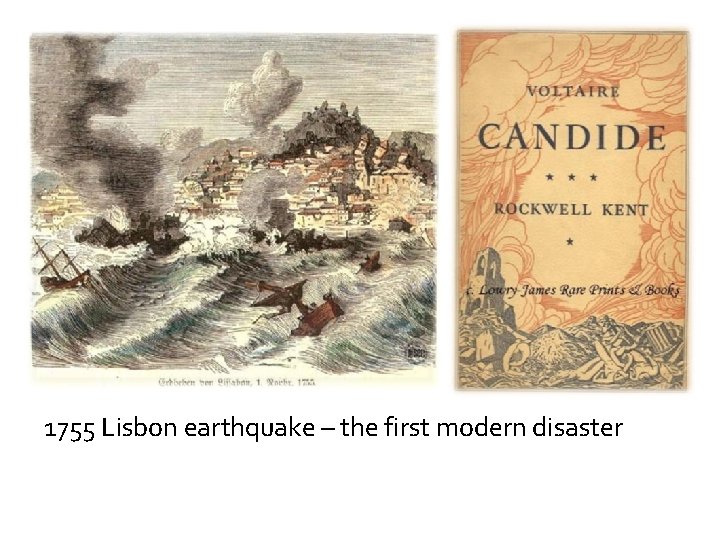
1755 Lisbon earthquake – the first modern disaster
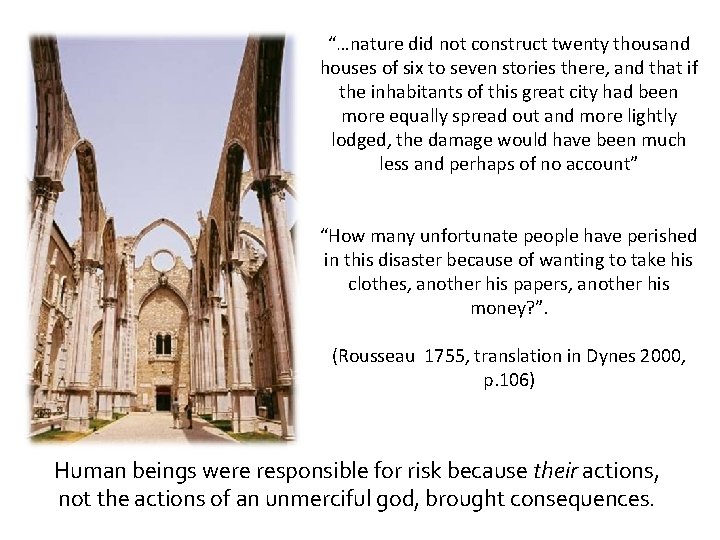
“…nature did not construct twenty thousand houses of six to seven stories there, and that if the inhabitants of this great city had been more equally spread out and more lightly lodged, the damage would have been much less and perhaps of no account” “How many unfortunate people have perished in this disaster because of wanting to take his clothes, another his papers, another his money? ”. (Rousseau 1755, translation in Dynes 2000, p. 106) Human beings were responsible for risk because their actions, not the actions of an unmerciful god, brought consequences.
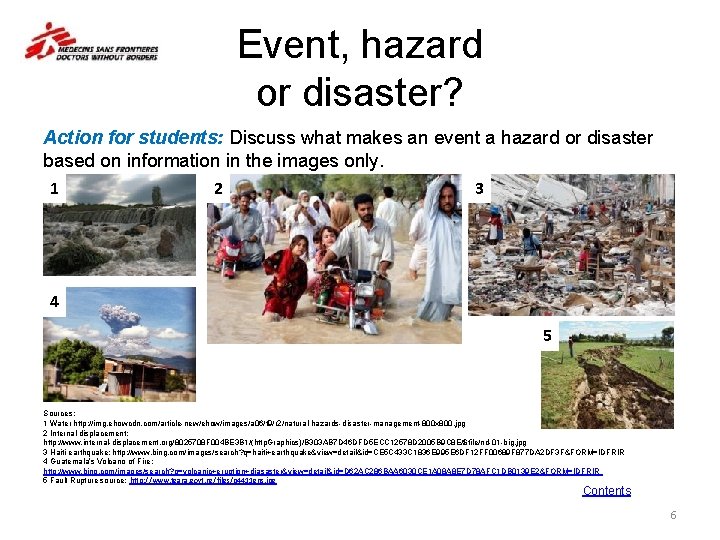
Event, hazard or disaster? Action for students: Discuss what makes an event a hazard or disaster based on information in the images only. 1 2 3 4 5 Sources: 1 Water http: //img. ehowcdn. com/article-new/ehow/images/a 06/f 9/r 2/natural-hazards-disaster-management-800 x 800. jpg 2 Internal displacement: http: //www. internal-displacement. org/8025708 F 004 BE 3 B 1/(http. Graphics)/B 303 AB 7 D 46 DFD 5 ECC 12578 D 2005 B 9 C 8 E/$file/nd-01 -big. jpg 3 Haiti earthquake: http: //www. bing. com/images/search? q=haiti+earthquake&view=detail&id=CE 5 C 433 C 1836 E 995 E 6 DF 12 FF 00689 F 877 DA 2 DF 3 F&FORM=IDFRIR 4 Guatemala’s Volcano of Fire: http: //www. bing. com/images/search? q=volcanic+eruption+diasaster&view=detail&id=D 62 AC 286 BAA 6030 CE 1 A 08 A 8 E 7 D 78 AFC 1 DB 0139 E 2&FORM=IDFRIR 5 Fault Rupture source: http: //www. teara. govt. nz/files/p 4411 gns. jpg Contents 6
Event, hazard or disaster definitions • What is a natural event in an uninhabited place becomes a hazard in a populated one. • A hazard is natural or human-made event that adversely affects human life, property or activity. A hazard involves people. • “A disaster is a sudden, calamitous event that causes serious disruption of the functioning of a community or a society causing widespread human, material, economic and/or environmental losses which exceed the ability of the affected community or society to cope using its own level of resources. (Source: UN/ISDR 2004); also used by ECHO • Capacity: A combination of all the strengths and resources available within a community, society or organization that can reduce the level of risk, or the effects of a disaster. Source: UN/ISDR, Words Into Action: A Guide for Implementing the Hyogo Framework, Switzerland, 2007 Source: WHO/EHA 2002, Disasters & Emergency definitions; http: //www. who. int/disasters/repo/7656. pdf Contents 7
Recording disasters For a disaster to be entered into the database of the UN's International Strategy for Disaster Reduction (ISDR), at least one of the following criteria must be met: • a report of 10 or more people killed • a report of 100 people affected • a declaration of a state of emergency by the relevant government • a request by the national government for international assistance
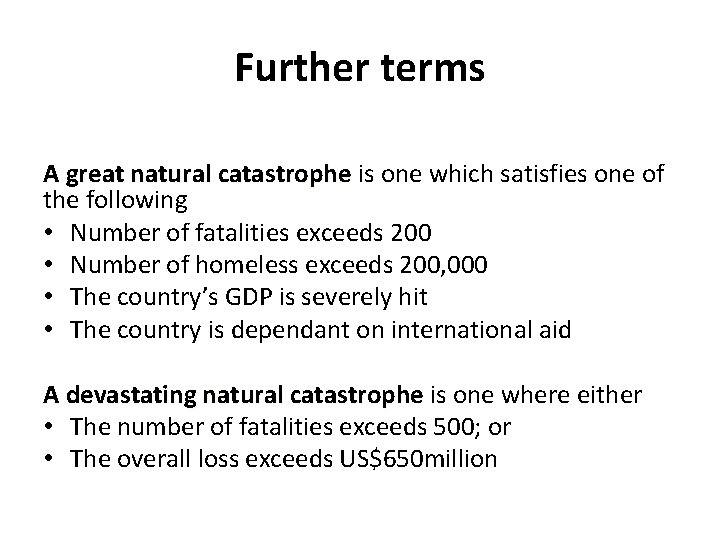
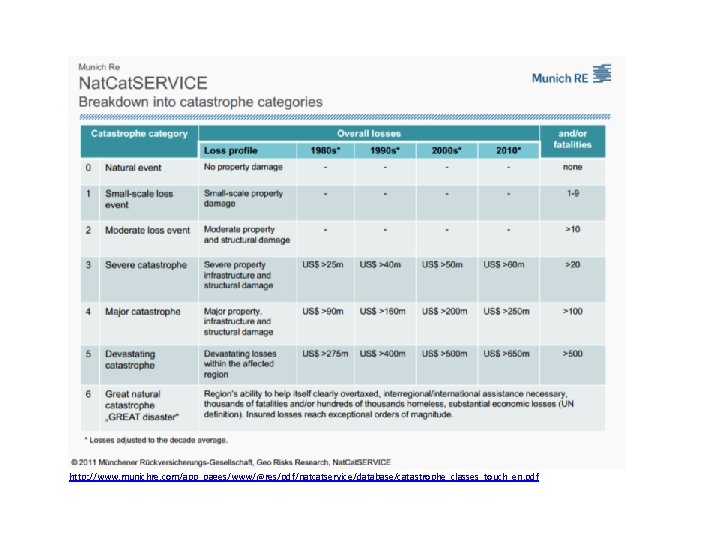
Further terms A great natural catastrophe is one which satisfies one of catastrophe the following • Number of fatalities exceeds 200 • Number of homeless exceeds 200, 000 • The country’s GDP is severely hit • The country is dependant on international aid A devastating natural catastrophe is one where either • The number of fatalities exceeds 500; or • The overall loss exceeds US$650 million
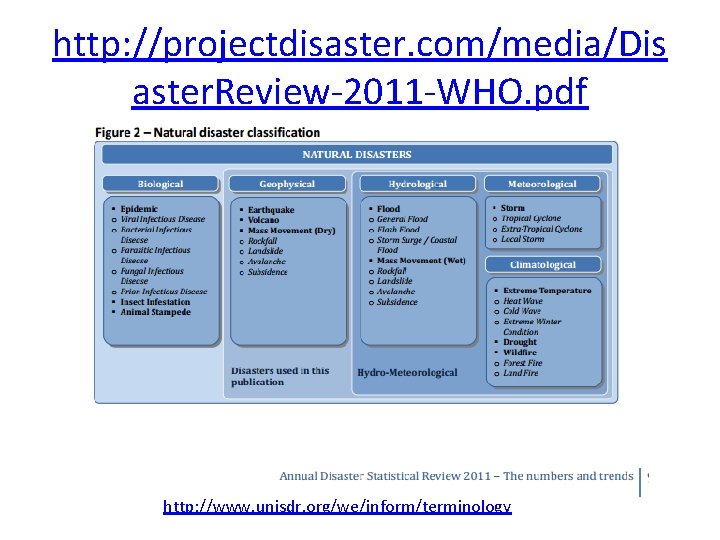
http: //projectdisaster. com/media/Dis aster. Review‐ 2011‐WHO. pdf http: //www. unisdr. org/we/inform/terminology
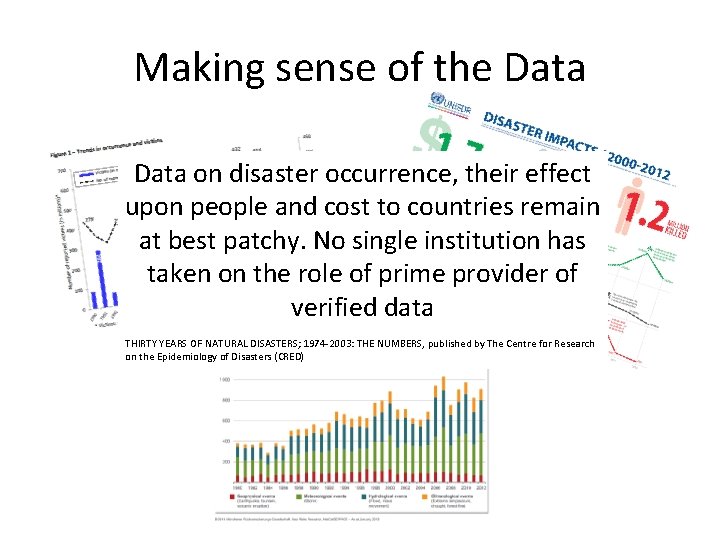
Making sense of the Data on disaster occurrence, their effect upon people and cost to countries remain at best patchy. No single institution has taken on the role of prime provider of verified data THIRTY YEARS OF NATURAL DISASTERS; 1974‐ 2003: THE NUMBERS, published by The Centre for Research on the Epidemiology of Disasters (CRED)
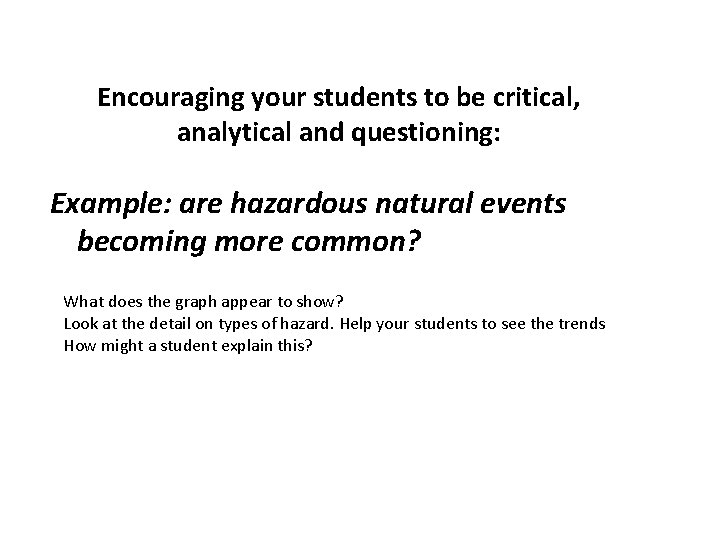
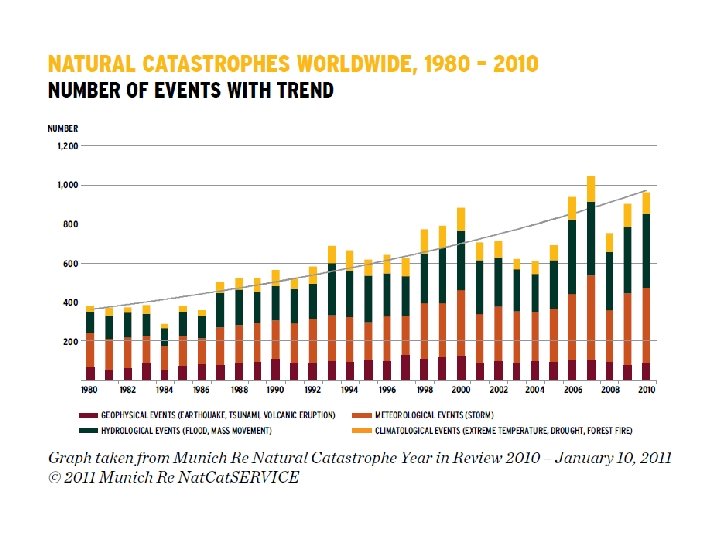
Encouraging your students to be critical, analytical and questioning: Example: are hazardous natural events becoming more common? What does the graph appear to show? Look at the detail on types of hazard. Help your students to see the trends How might a student explain this?
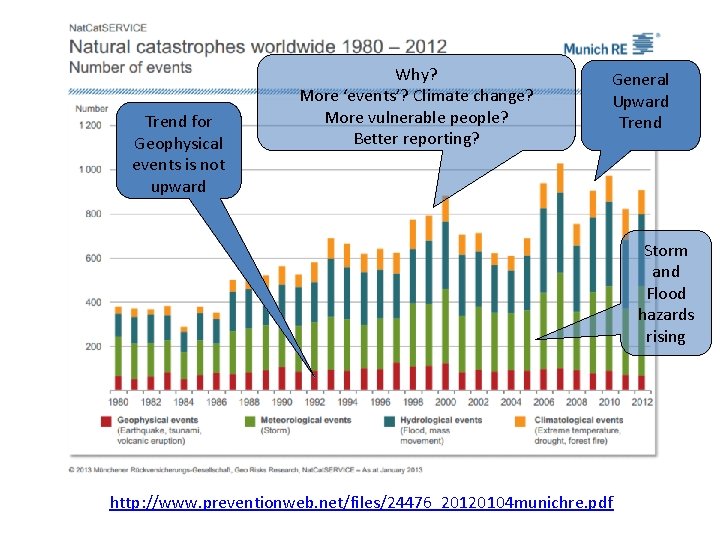
Trend for Geophysical events is not upward Why? More ‘events’? Climate change? More vulnerable people? Better reporting? General Upward Trend Storm and Flood hazards rising http: //www. preventionweb. net/files/24476_20120104 munichre. pdf
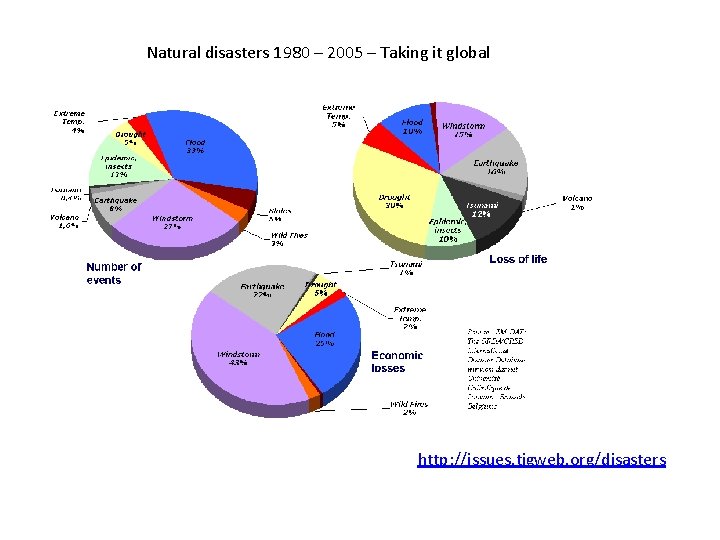
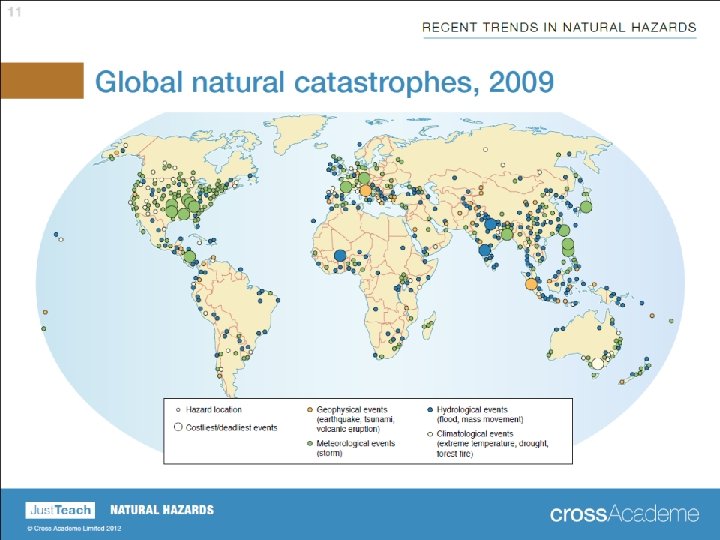
Natural disasters 1980 – 2005 – Taking it global http: //issues. tigweb. org/disasters
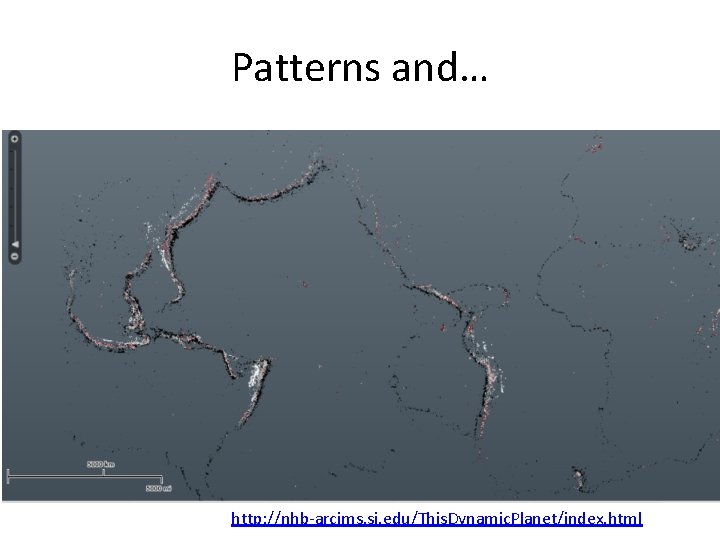
Patterns and… http: //nhb‐arcims. si. edu/This. Dynamic. Planet/index. html
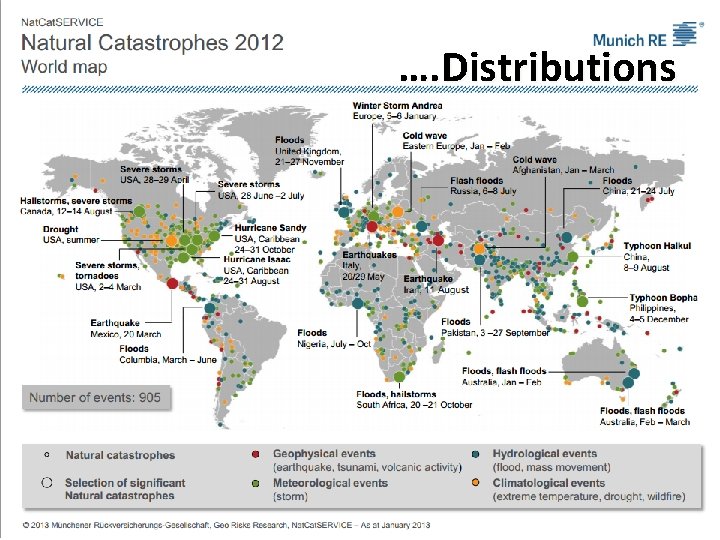
…. Distributions
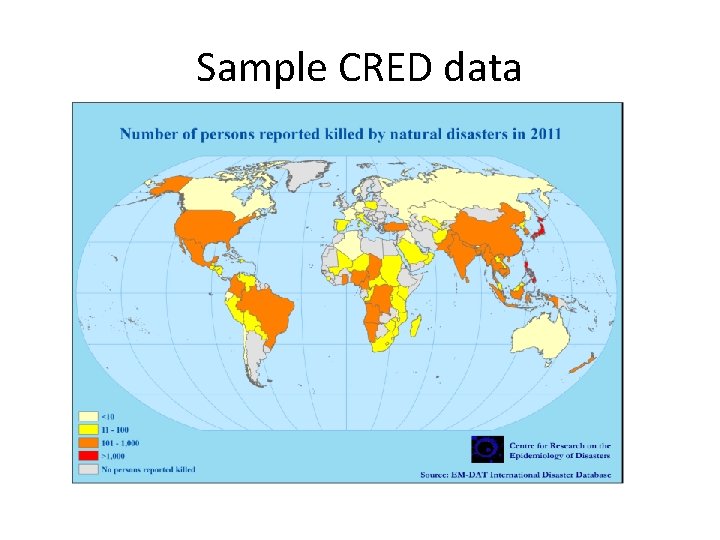
Sample CRED data
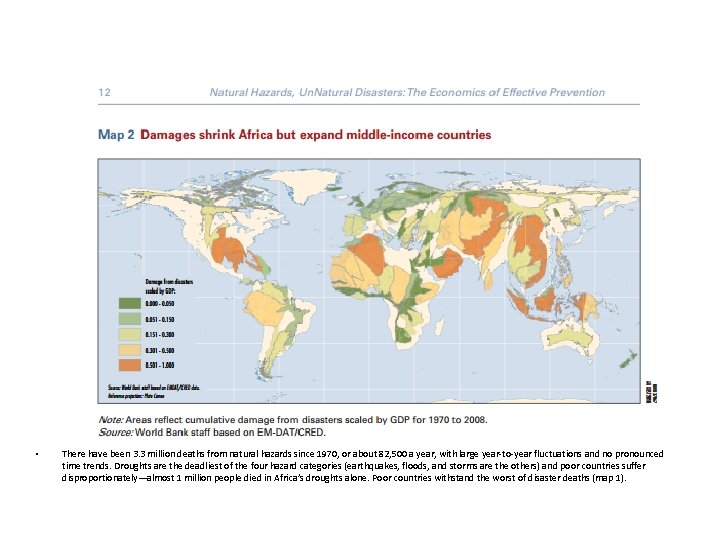
• There have been 3. 3 million deaths from natural hazards since 1970, or about 82, 500 a year, with large year‐to‐year fluctuations and no pronounced time trends. Droughts are the deadliest of the four hazard categories (earthquakes, floods, and storms are the others) and poor countries suffer disproportionately—almost 1 million people died in Africa’s droughts alone. Poor countries withstand the worst of disaster deaths (map 1).
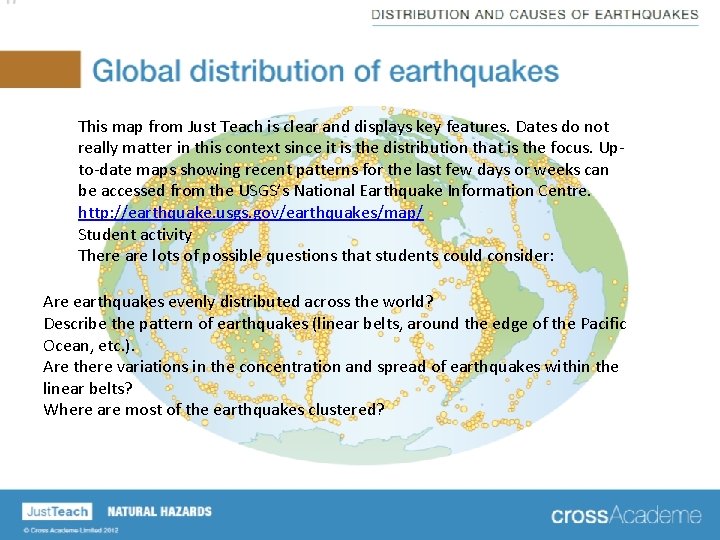
This map from Just Teach is clear and displays key features. Dates do not really matter in this context since it is the distribution that is the focus. Up‐ to‐date maps showing recent patterns for the last few days or weeks can be accessed from the USGS’s National Earthquake Information Centre. http: //earthquake. usgs. gov/earthquakes/map/ Student activity There are lots of possible questions that students could consider: Are earthquakes evenly distributed across the world? Describe the pattern of earthquakes (linear belts, around the edge of the Pacific Ocean, etc. ). Are there variations in the concentration and spread of earthquakes within the linear belts? Where are most of the earthquakes clustered?
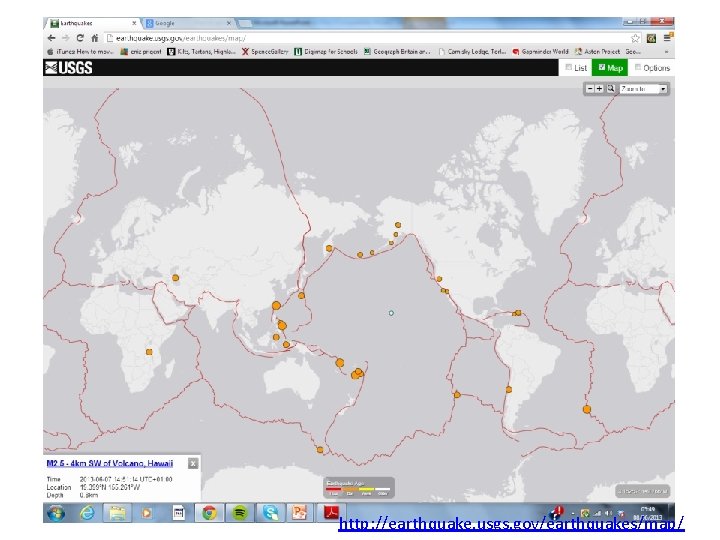
http: //earthquake. usgs. gov/earthquakes/map/
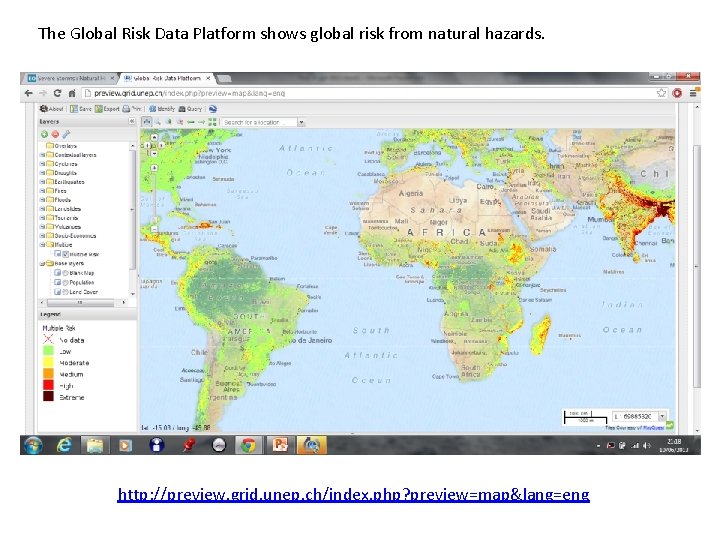
The Global Risk Data Platform shows global risk from natural hazards. http: //preview. grid. unep. ch/index. php? preview=map&lang=eng
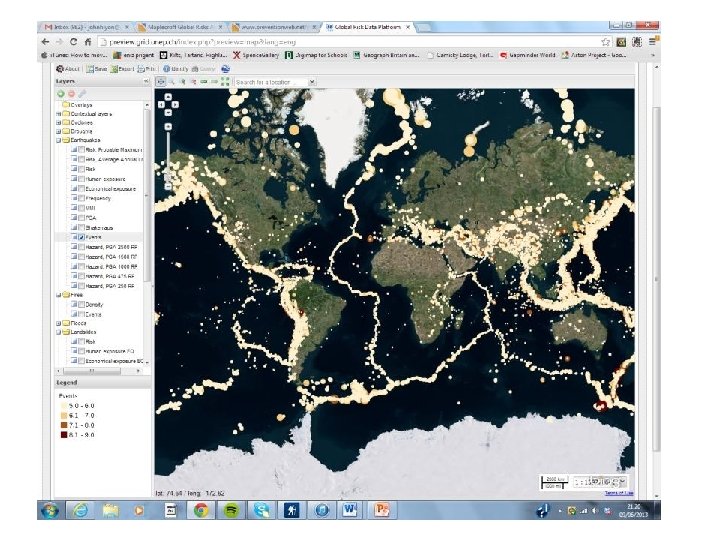
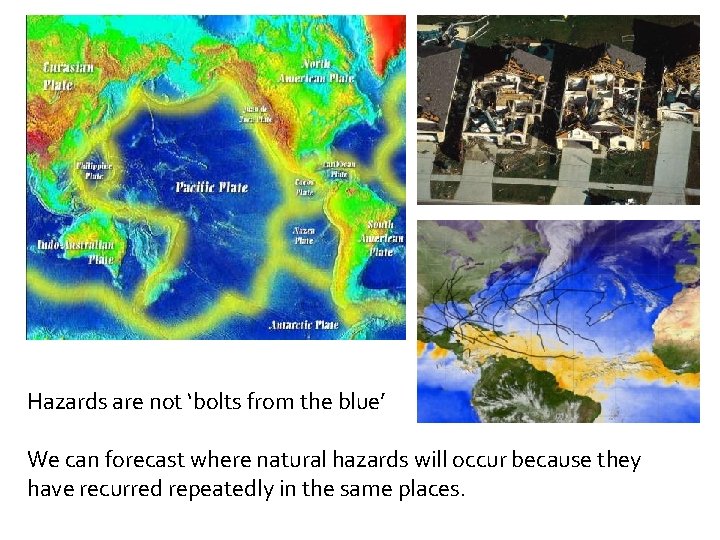
Hazards are not ‘bolts from the blue’ We can forecast where natural hazards will occur because they have recurred repeatedly in the same places.
Why are places vulnerable to natural hazards? Haiti is especially vulnerable to hydro meteorological events, such as, cyclones and geophysical hazards , such as earthquakes, because of: • Physical location • Climate change • Topography • Deforestation • Lack of infrastructure: roads, water and electricity network, sewage and drainage • Poverty • Frequent natural hazards Action for students: List reasons why Japan and Haiti are countries with the highest risk in the world to natural hazards. Why are they so susceptible, exposed to danger? Compare and contrast Haiti and Japan using disaster websites: • Prevention web for risk profile: http: //www. preventionweb. net/english/countries/statistics/risk. php? iso=hti • International Disaster Database EM-DAT (www. emdat. be) and • Centre for Research on the Epidemiology of Disasters, CRED (www. cred. be), for instance http: //cred. be/sites/default/files/Press. Conference 2010. pdf. 25
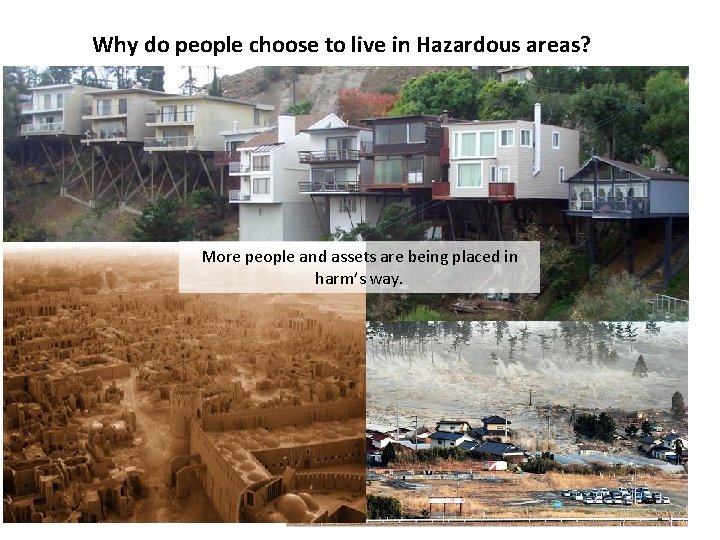
Why do people choose to live in Hazardous areas? More people and assets are being placed in harm’s way.
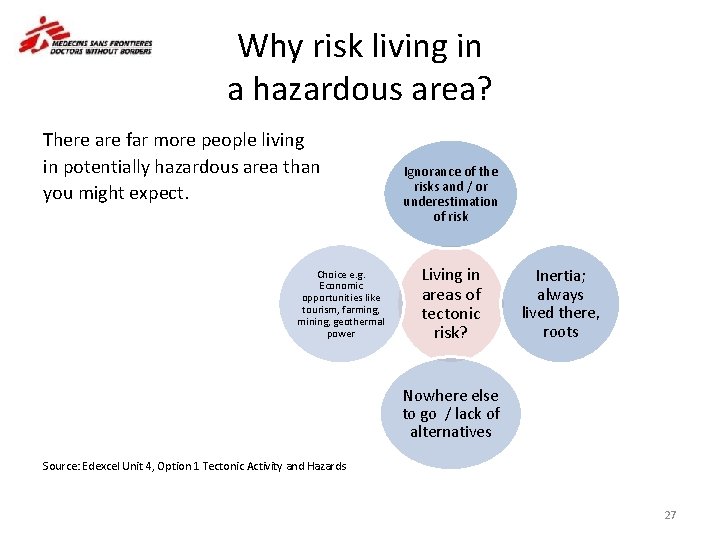
Why risk living in a hazardous area? There are far more people living in potentially hazardous area than you might expect. Choice e. g. Economic opportunities like tourism, farming, mining, geothermal power Ignorance of the risks and / or underestimation of risk Living in areas of tectonic risk? Inertia; always lived there, roots Nowhere else to go / lack of alternatives Source: Edexcel Unit 4, Option 1 Tectonic Activity and Hazards 27
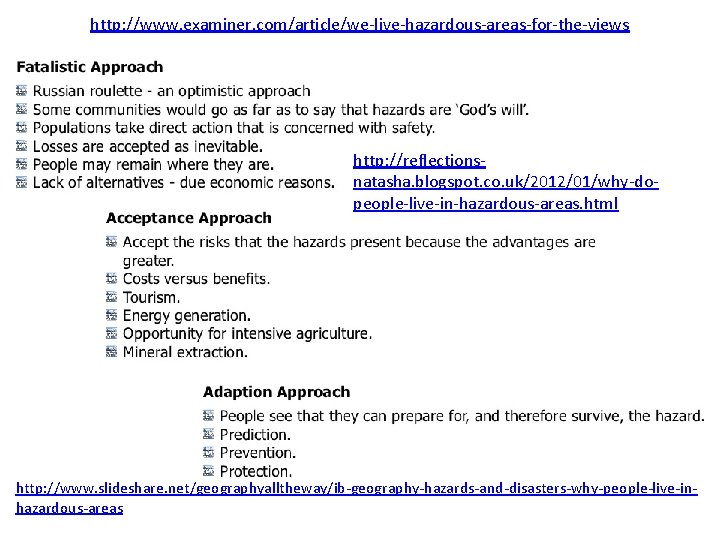
http: //www. examiner. com/article/we‐live‐hazardous‐areas‐for‐the‐views http: //reflections‐ natasha. blogspot. co. uk/2012/01/why‐do‐ people‐live‐in‐hazardous‐areas. html http: //www. slideshare. net/geographyalltheway/ib‐geography‐hazards‐and‐disasters‐why‐people‐live‐in‐ hazardous‐areas
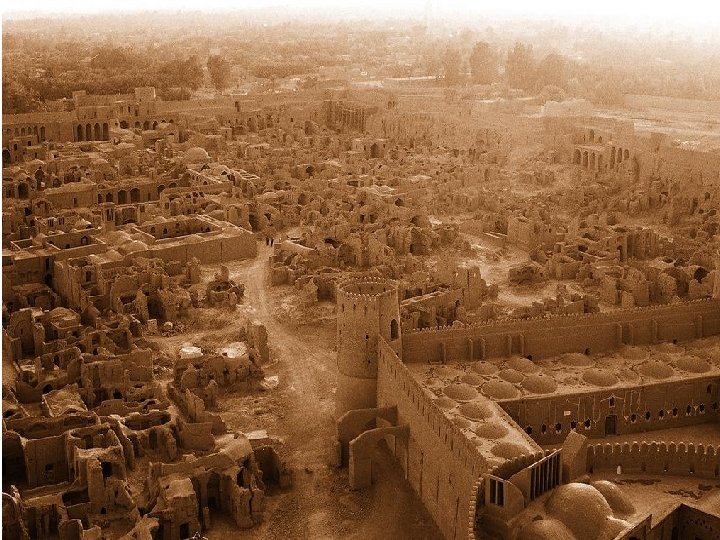
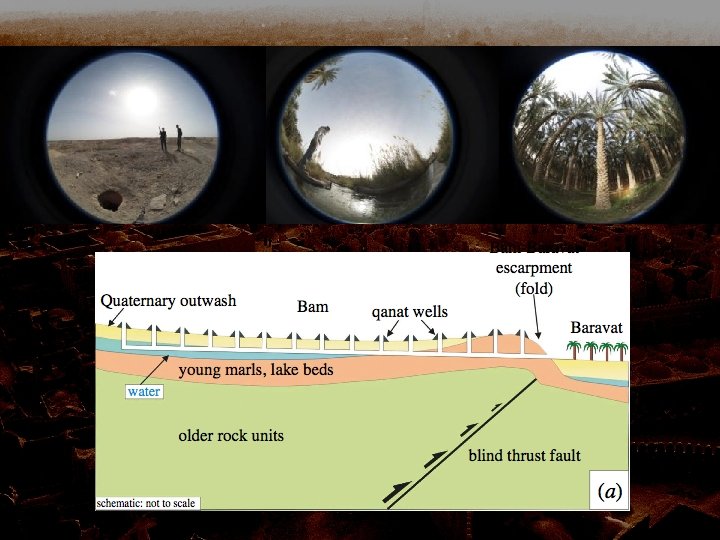
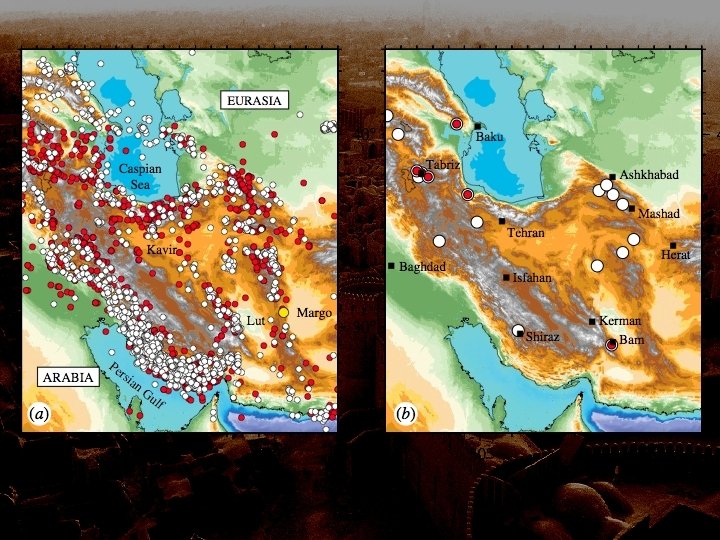
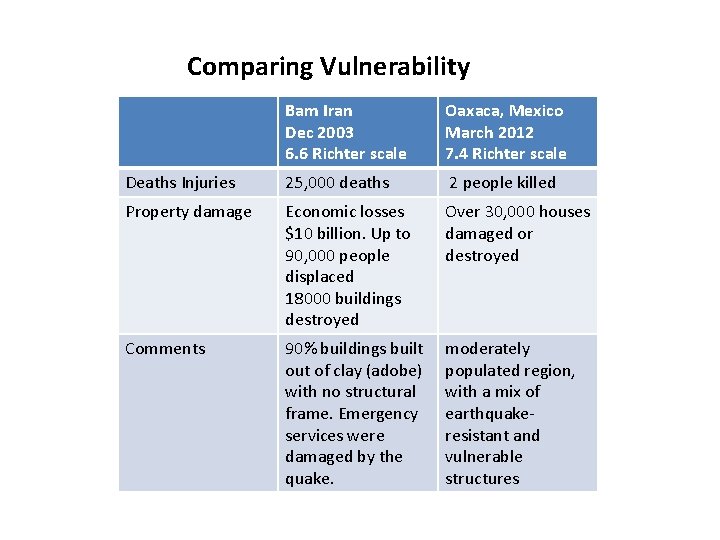
Comparing Vulnerability Bam Iran Dec 2003 6. 6 Richter scale Oaxaca, Mexico March 2012 7. 4 Richter scale Deaths Injuries 25, 000 deaths 2 people killed Property damage Economic losses $10 billion. Up to 90, 000 people displaced 18000 buildings destroyed Over 30, 000 houses damaged or destroyed Comments 90% buildings built out of clay (adobe) with no structural frame. Emergency services were damaged by the quake. moderately populated region, with a mix of earthquake‐ resistant and vulnerable structures
Physical factors affecting the impact of a tectonic event Physical Factors: • • • Distance from epicentre Richter Scale / Volcanic Explosivity Index (VEI): the higher on the scale, the more potentially devastating Duration of the hazard Scale of the hazard Frequency of the hazard Magnitude of the hazard Time of day Time of year and climate Geography of the area, accessibility 33
Human factors affecting the impact of a tectonic event Human factors: • Social, political and economic conditions / level of development. • Population density: rural or urban area • Frequency and severity of hazards affecting the area • Experience from previous hazards in the area • Methods of coping with hazards • Accuracy in predicting the hazards • Effectiveness and response of hazard warning and evacuation procedures • Speed and efficiency of local, national and international emergency response teams and long‐term reconstruction and development services • Coordination and perception of the services • Presence of other humanitarian crisis 34
Disaster risk • Disaster risk continues to increase globally, with more people and assets located in areas of high risk. Over the past 30 years, the world’s population has grown by 87 per cent. • The proportion of the population living in flood‐prone river basins increased by 114 per cent and on cyclone‐exposed coastlines by 192 per cent. • More than half of the world's large cities, with populations ranging from 2 to 15 million, are currently located in areas of high risk of seismic activity. • The continued growth in cities and urban areas presents a further challenge. Half of humanity now lives in urban centres, with 70 per cent of the world’s population expected to live in urban areas by 2050. This growth is largely driven in low‐ and middle‐income nations in locations already prone to earthquakes, droughts and floods.
http: //www. munichre. com/app_pages/www/@res/pdf/natcatservice/database/catastrophe_classes_touch_en. pdf
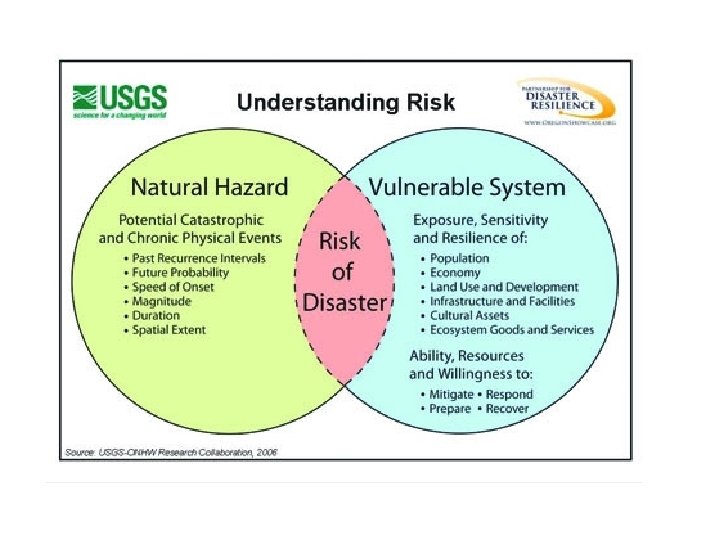
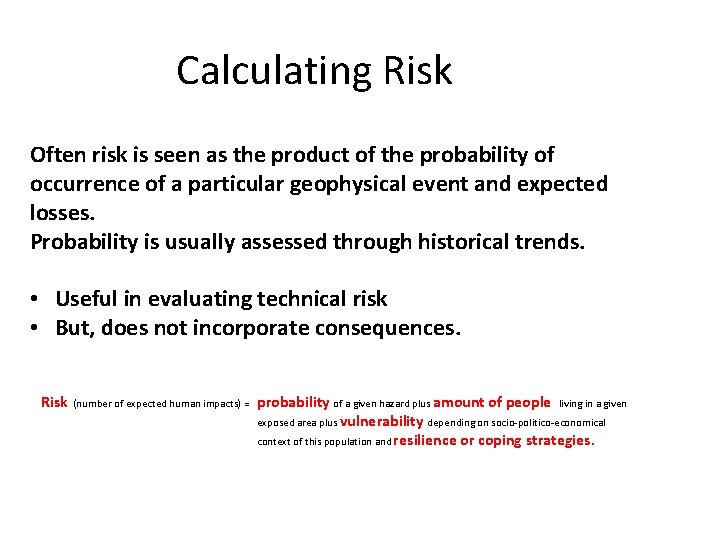
Calculating Risk Often risk is seen as the product of the probability of occurrence of a particular geophysical event and expected losses. Probability is usually assessed through historical trends. • Useful in evaluating technical risk • But, does not incorporate consequences. Risk (number of expected human impacts) = probability of a given hazard plus amount of people living in a given exposed area plus vulnerability depending on socio‐politico‐economical context of this population and resilience or coping strategies.
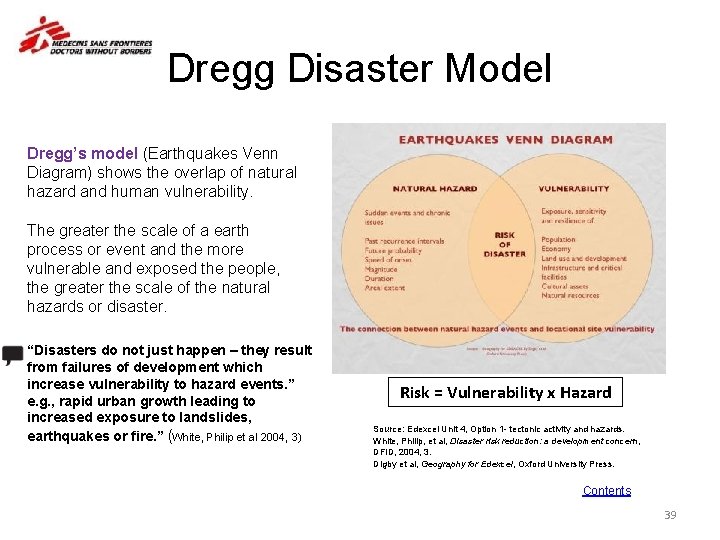
Dregg Disaster Model Dregg’s model (Earthquakes Venn Diagram) shows the overlap of natural hazard and human vulnerability. The greater the scale of a earth process or event and the more vulnerable and exposed the people, the greater the scale of the natural hazards or disaster. “Disasters do not just happen – they result from failures of development which increase vulnerability to hazard events. ” e. g. , rapid urban growth leading to increased exposure to landslides, earthquakes or fire. ” (White, Philip et al 2004, 3) Risk = Vulnerability x Hazard Source: Edexcel Unit 4, Option 1 - tectonic activity and hazards. White, Philip, et al, Disaster risk reduction: a development concern, DFID, 2004, 3. Digby et al, Geography for Edexcel, Oxford University Press. Contents 39
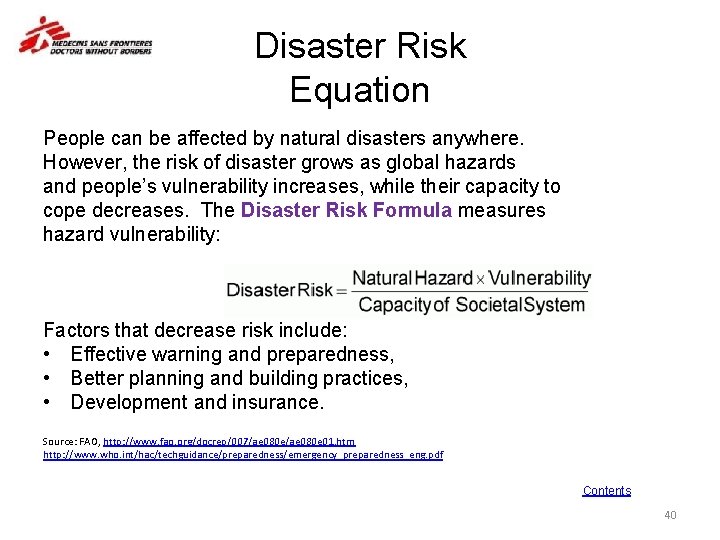
Disaster Risk Equation People can be affected by natural disasters anywhere. However, the risk of disaster grows as global hazards and people’s vulnerability increases, while their capacity to cope decreases. The Disaster Risk Formula measures hazard vulnerability: Factors that decrease risk include: • Effective warning and preparedness, • Better planning and building practices, • Development and insurance. Source: FAO, http: //www. fao. org/docrep/007/ae 080 e 01. htm http: //www. who. int/hac/techguidance/preparedness/emergency_preparedness_eng. pdf Contents 40
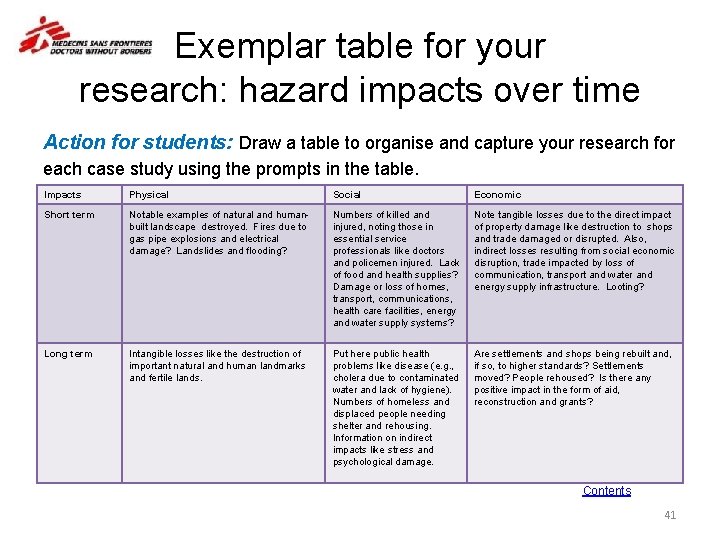
Exemplar table for your research: hazard impacts over time Action for students: Draw a table to organise and capture your research for each case study using the prompts in the table. Impacts Physical Social Economic Short term Notable examples of natural and humanbuilt landscape destroyed. Fires due to gas pipe explosions and electrical damage? Landslides and flooding? Numbers of killed and injured, noting those in essential service professionals like doctors and policemen injured. Lack of food and health supplies? Damage or loss of homes, transport, communications, health care facilities, energy and water supply systems? Note tangible losses due to the direct impact of property damage like destruction to shops and trade damaged or disrupted. Also, indirect losses resulting from social economic disruption, trade impacted by loss of communication, transport and water and energy supply infrastructure. Looting? Long term Intangible losses like the destruction of important natural and human landmarks and fertile lands. Put here public health problems like disease (e. g. , cholera due to contaminated water and lack of hygiene). Numbers of homeless and displaced people needing shelter and rehousing. Information on indirect impacts like stress and psychological damage. Are settlements and shops being rebuilt and, if so, to higher standards? Settlements moved? People rehoused? Is there any positive impact in the form of aid, reconstruction and grants? Contents 41
2013 Global Assessment Report on Disaster Risk Reduction The central message of the 2013 Global Assessment Report on Disaster Risk Reduction (GAR 13) is that, in the aftermath of the global economic crisis, the competitiveness, resilience and sustainability of businesses, cities and countries will increasingly be defined by their capacity to manage and reduce their disaster risks. Rather than being viewed as a cost, disaster risk management is increasingly being viewed as an opportunity to enhance competitiveness. http: //www. preventionweb. net/posthfa/documents/GA R 13%202‐PAGE%20 SUMMARY%20 final. . pdf
Millennium Development Goals and Disaster Risk Reduction Disaster risk must be part of new development goals ‐ global forum http: //www. preventionweb. net/english/profess ional/news/v. php? id=33337
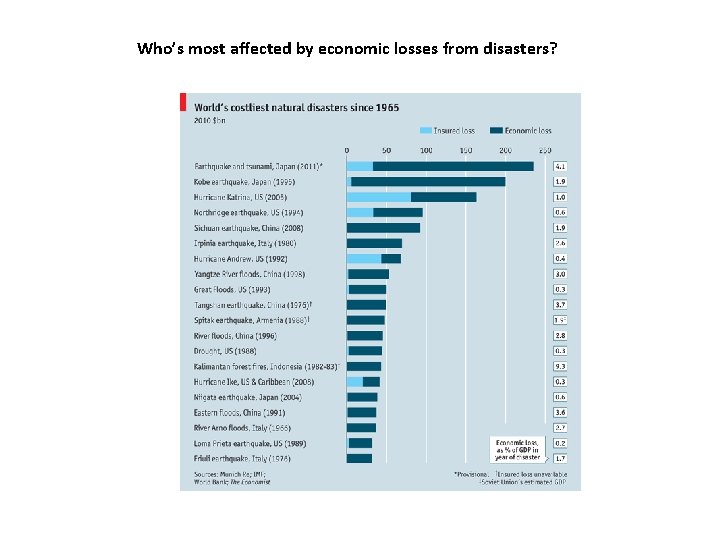
Who’s most affected by economic losses from disasters?
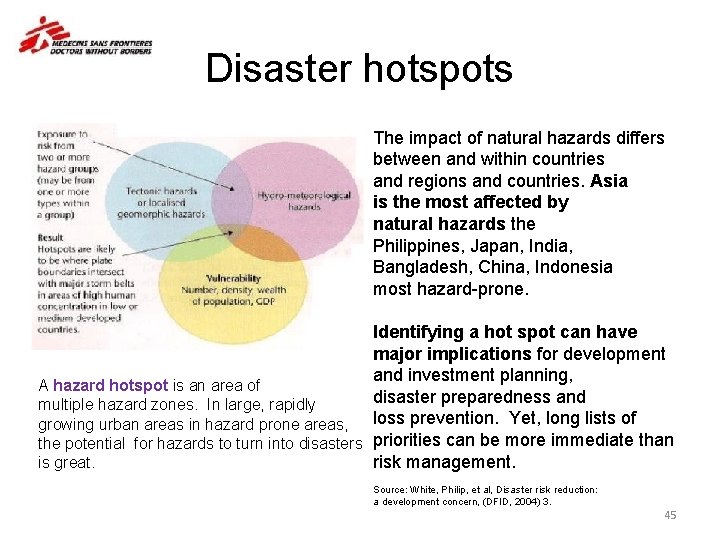
Disaster hotspots The impact of natural hazards differs between and within countries and regions and countries. Asia is the most affected by natural hazards the Philippines, Japan, India, Bangladesh, China, Indonesia most hazard-prone. Identifying a hot spot can have major implications for development and investment planning, A hazard hotspot is an area of disaster preparedness and multiple hazard zones. In large, rapidly growing urban areas in hazard prone areas, loss prevention. Yet, long lists of the potential for hazards to turn into disasters priorities can be more immediate than risk management. is great. Source: White, Philip, et al, Disaster risk reduction: a development concern, (DFID, 2004) 3. 45
The Insurance business • The world’s largest geographically‐driven business? • insured by reinsurance • And a geographical gambling industry How is risk be calculated?
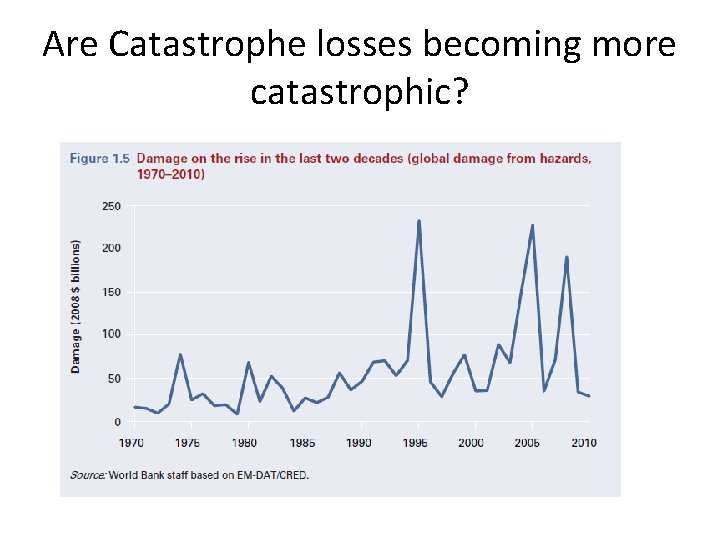
Are Catastrophe losses becoming more catastrophic?
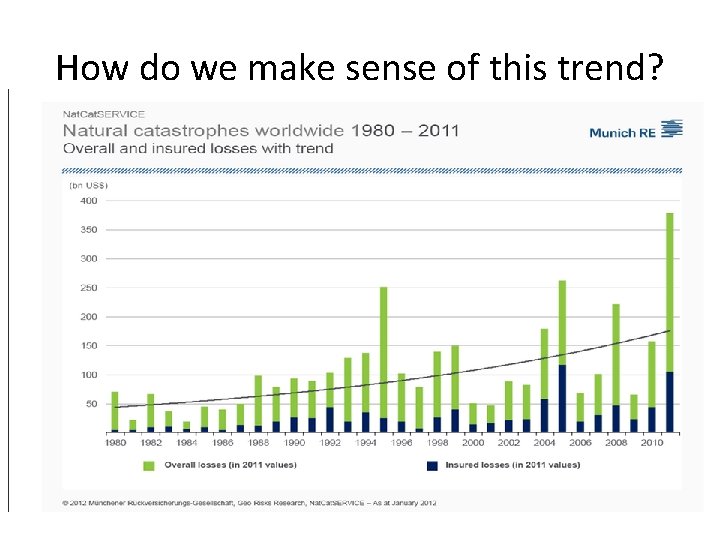
How do we make sense of this trend?
Resilience to global risks “Economic gains have yet to transform the resilience of the Which are the 10 countries most exposed and least resilient to global risks: BRICs to major risk events, ” Maplecroft CEO Alyson Warhurst. Somalia (1), DR Congo (2), South Sudan (3), Sudan (4), Afghanistan (5), Pakistan (6), “Improvements in basic social infrastructure, such as education, Central African Republic (7), Iraq (8), Myanmar (9) and Yemen (10). healthcare and sanitation for large sections of society, are vital in combating the impacts of global risks. Without these, and Which countries are of most concern for investors and business ? improvements in governance, the BRICs economies may not fully The BRICS economies of Brazil, Russia, India China and South Africa resilience to withstand global risks is increasingly important, as they become central to the fortunes realise their investment potential. ” of the global economy due to their increased economic might and integration with individual economies. http: //maplecroft. com/themes/gr/ None of BRICs have improved their performance in relation to their resilience to global http: //www. preventionweb. net/english/professional/news/v. ph risks over the course of the last four years. This is despite cumulative GDP growth p? id=25221 between 2009 and 2012 of 16% for Brazil, 13% for Russia, 28% for India and 32% for China.
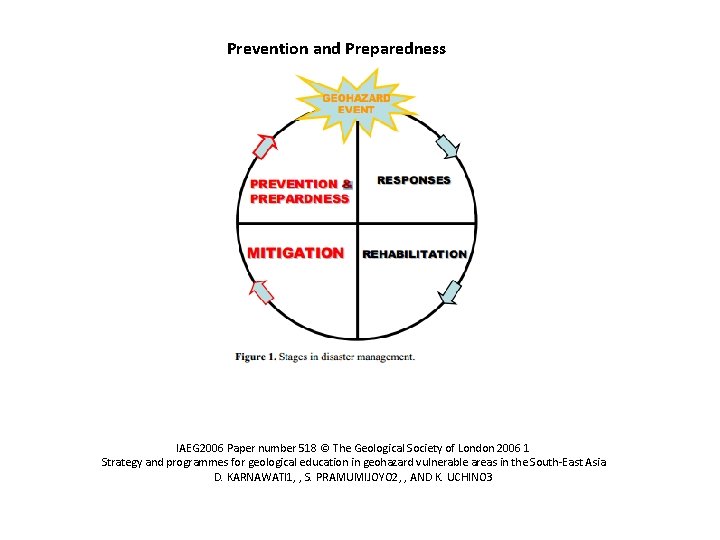
Prevention and Preparedness IAEG 2006 Paper number 518 © The Geological Society of London 2006 1 Strategy and programmes for geological education in geohazard vulnerable areas in the South‐East Asia D. KARNAWATI 1, , S. PRAMUMIJOYO 2, , AND K. UCHINO 3
A campaign for global safe schools and safe health structures? "Who can forget the shocking fact that 97 percent of the schools in Port‐au‐Prince collapsed in the 2010 earthquake? It is of huge concern that the lives and education of millions of children living in seismic zones and flood plains around the world are at risk, " Eliasson said. "Hazard risk assessments are essential before investing in critical infrastructure which can lead to loss of lives if not disaster‐proof. “ http: //www. preventionweb. net/english/professional/news/v. php? id=33337
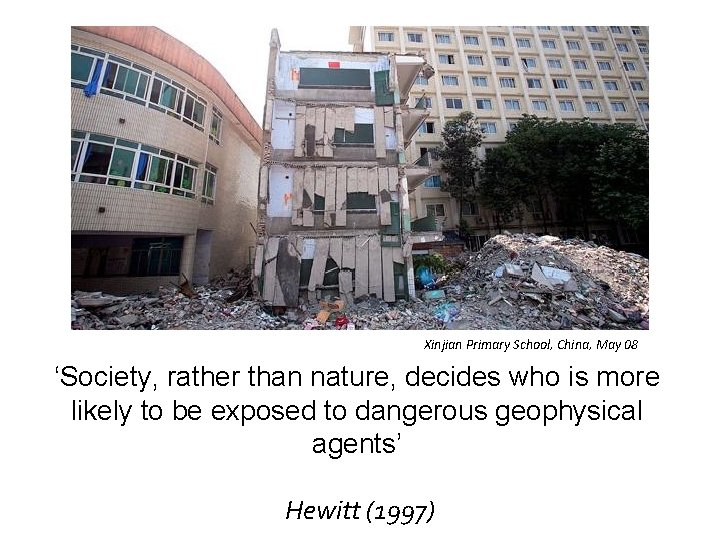
Xinjian Primary School, China, May 08 ‘Society, rather than nature, decides who is more likely to be exposed to dangerous geophysical agents’ Hewitt (1997)
Effective Prevention • The best way of dealing with natural disasters is often before they occur: early warning systems, advance planning, encouraging natural protections like minimizing deforestation or protecting wetlands, building codes, flood control, and more. For a nice overview of such efforts around the world, I recommend the 2010 report on "Natural Hazards, Un. Natural Disasters: The Economics of Effective Prevention, " from the World Bank. The report begins: "The adjective “Un. Natural” in the title of this report conveys its key message: earthquakes, droughts, floods, and storms are natural hazards, but the unnatural disasters are deaths and damages that result from human acts of omission and commission. Every disaster is unique, but each exposes actions—by individuals and governments at different levels—that, had they been different, would have resulted in fewer deaths and less damage. Prevention is possible, and this report examines what it takes to do this cost‐effectively. " http: //conversableeconomist. blogspot. co. uk/2012/11/economics‐and‐ natural‐disasters. html
• The U. N. is well aware that building resilience is the key to maintaining development and reducing loss from natural disasters. • An important goal for the U. N. is to offer advice and embed clear resilience and mitigation strategies into governmental policy and ensure that these policies are effectively enforced. • However much of the U. N. data on human exposure to natural disasters are not entirely accurate and often out of date. Worryingly there appears to be no clear procedure for updating this information. Improving resilience becomes much more difficult without knowing the nature of the hazards faced. It is clear that the U. N. needs to invest in resources to update key data tables such as exposure and vulnerability; combining information from industry, especially the re‐insurance sector, and outputs from the scientific community. http: //climateandgeohazards. wordpress. com/
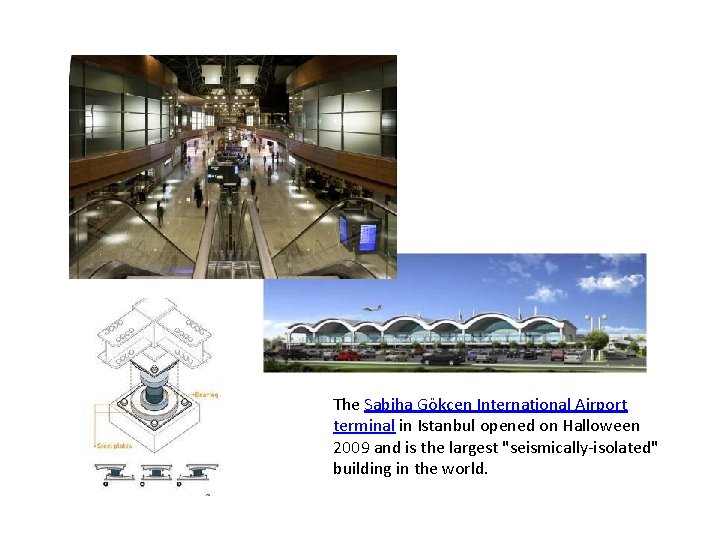
The Sabiha Gökçen International Airport terminal in Istanbul opened on Halloween 2009 and is the largest "seismically‐isolated" building in the world.
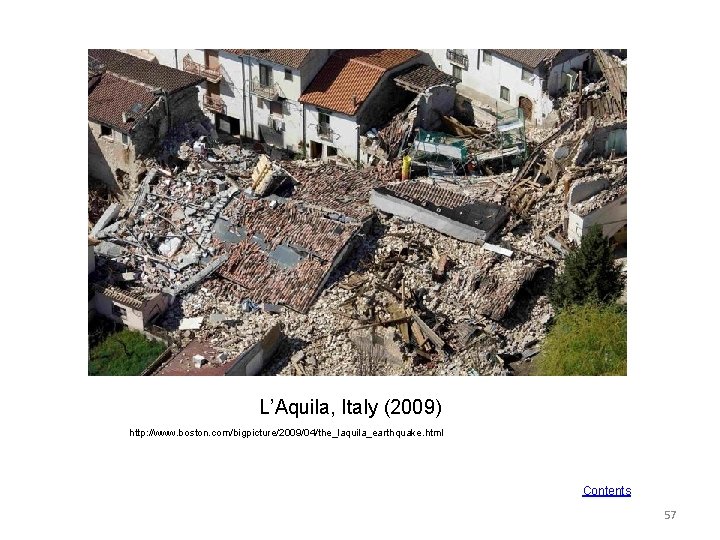
L’Aquila, Italy (2009) http: //www. boston. com/bigpicture/2009/04/the_laquila_earthquake. html Contents 57
Jail for members of the Great Risks Commission Case Study: L'Aquila, Italy (2009) Earthquake of magnitude 6. 3 hit the Abruzzi town of L'Aquila on 6 April 2009 following a series of swarms (small, but numerous tremors on a daily basis) during the preceding 2 months. In a public meeting 6 days prior to the main shock, members of Italy's Great Risks Commission downplayed the likelihood of a major quake and did not reiterate what risks people faced if one did occur. This was in response to an amateur seismologist, Giampaolo Giuliani, who was predicting a major quake based on radon readings on his home made radon monitoring devices. On 22 October 2012, 6 scientists and one ex‐government official (all members of the great risks commission who attended the meeting) were found guilty of manslaughter by an Italian judge, as they played down the risks of a major shock. They were sentenced to 6 years in prison. Contents
Pitfalls to Prediction and Communication of Risks Reasons for authorities and people not to act on disaster warnings: • Uncertainty in scientific information / difficulty in predicting earthquakes • Unease with scientific jargon (communicate in less academic fashion) • • • Lacking emergency response infrastructure , for example, national and international channels between scientists, authorities, agencies and communities and linked policies. Competing risks/priorities (need to assess likely post-earthquake behaviour to target warnings) Too many false alarms (need to use local hazard indicators, such as, animal behaviour and work with media). Sources: http: //www. nature. com/news/2011/110914/pdf/477264 a. pdf, http: //www. nature. com/news/l‐aquila‐verdict‐row‐grows‐ 1. 11683, http: //blogs. lse. ac. uk/europpblog/2012/11/01/laquila‐earthquake‐conviction/ http: //www. trust. org/alertnet/news/early‐warning‐of‐disasters‐facts‐and‐figures/ Contents
Why were the experts jailed? Action for students: 1. Using research from previous slides and taking into account the difficulty of predicting earthquakes, why have these experts been jailed? The media suggests it is because they did not accurately predict the 6 April major shock. Evidence suggests, however, that they misled the public as to the risks of such a quake occurring and that the public then acted as though the risk was small. 2. What are the implications for predicting major natural disasters in the future, not just earthquakes? 60
Game-changers? Burgeoning cities, climate change, and climate-related catastrophes • Scientists have identified several catastrophes that a changing climate might trigger: drastic sea level rise, disruption of ocean currents, large‐scale disruptions to the global ecosystem, and accelerated climate change, for example, from large releases of methane now trapped by permafrost.
‘It would seem that the only plausible explanation for the rise in weather-related catastrophes is climate change’. Joe Romm ‐ senior Fellow at American Progress http: //thinkprogress. org/climate/2011/01/04/207288/munich‐re‐pielke‐extreme‐ weather‐damages‐climate‐change/
Climate change The Intergovernmental Panel on Climate Change highlighted that, as a result of climate change, the frequency of heavy precipitation events would likely increase in the 21 st century over many regions and increases in the frequency of warm daily temperature extremes and decreases in cold extremes would occur on a global scale. Heat waves will very likely increase in length, frequency and/or intensity over most land areas, as will the average maximum wind speed of tropical cyclones in many ocean basins. Climate change, therefore, is a main driver of risk across sectors. http: //www. preventionweb. net/files/30374_thinkpieceondrmfinal. pdf
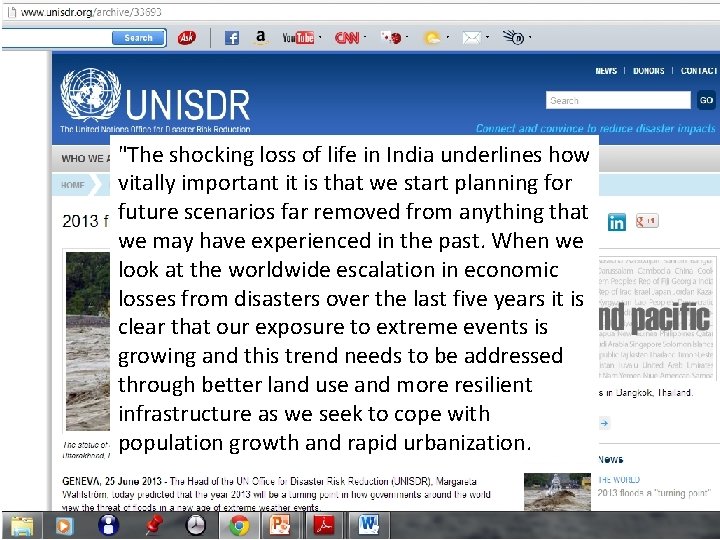
"The shocking loss of life in India underlines how vitally important it is that we start planning for future scenarios far removed from anything that we may have experienced in the past. When we look at the worldwide escalation in economic losses from disasters over the last five years it is clear that our exposure to extreme events is growing and this trend needs to be addressed through better land use and more resilient infrastructure as we seek to cope with population growth and rapid urbanization.
The possible impact of climate change • Scientists have identified several catastrophes that a changing climate might trigger: drastic sea level rise, disruption of ocean currents, large‐scale disruptions to the global ecosystem, and accelerated climate change, for example, from large releases of methane now trapped by permafrost.
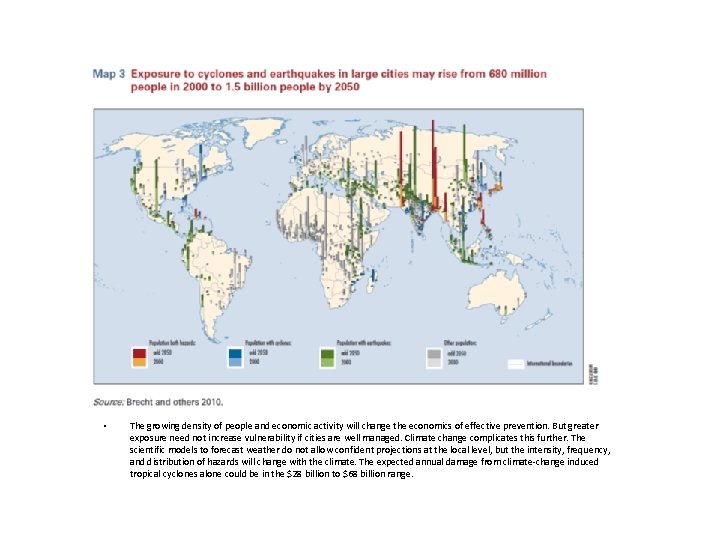
• The growing density of people and economic activity will change the economics of effective prevention. But greater exposure need not increase vulnerability if cities are well managed. Climate change complicates this further. The scientific models to forecast weather do not allow confident projections at the local level, but the intensity, frequency, and distribution of hazards will change with the climate. The expected annual damage from climate‐change induced tropical cyclones alone could be in the $28 billion to $68 billion range.
In your opinion, which of the following are weaknesses of typical undergraduates when they begin degree level study in your subject? Academic writing, self‐directed study, independent inquiry, & critical thinking skills are often considered weaknesses
Which of the following, if any, are contributing factors to 1 st year undergraduates being underprepared for degree level study? Too much ‘teaching to the test’ is considered a major factor contributing to undergraduates being underprepared
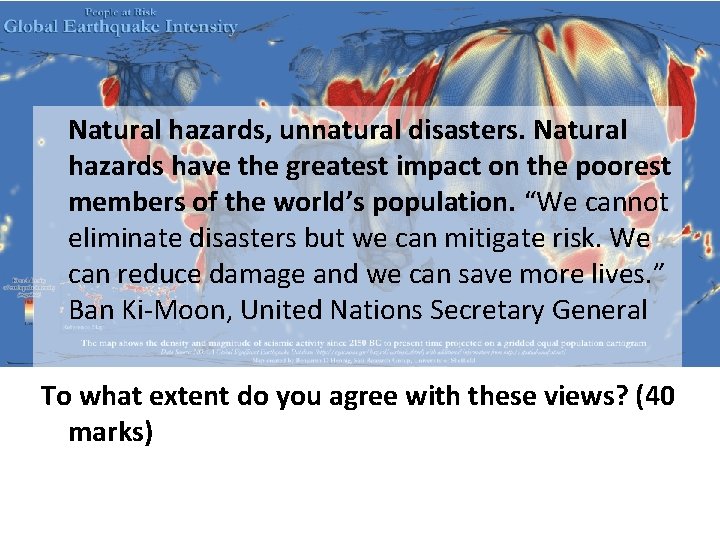
Natural hazards, unnatural disasters. Natural hazards have the greatest impact on the poorest members of the world’s population. “We cannot eliminate disasters but we can mitigate risk. We can reduce damage and we can save more lives. ” Ban Ki‐Moon, United Nations Secretary General To what extent do you agree with these views? (40 marks)
Final Thoughts. . . http: //www. disaster‐report. com/
Some useful links • http: //www. circleofblue. org/waternews/tehuacan‐divining ‐destiny/ • http: //planetark. org/enviro‐news/ • http: //www. guardian. co. uk/world/series/eyewitness • http: //news. yahoo. com/tsunamis‐earthquakes‐overdue‐ lake‐tahoe‐ 152553964. html • http: //southtahoenow. com/story/05/23/2012/new‐ earthquake‐technology‐reveals‐lake‐tahoe‐faults‐could‐ generate‐large‐events • http: //www. ibtimes. com/natural‐disasters‐are‐hitting‐ harder‐not‐because‐global‐warming‐ 1141461
And some more. . • http: //www. trulia. com/real_estate/South_Lake_ Tahoe‐California/ • http: //serc. carleton. edu/files/NAGTWorkshops/v isualization/examples/Global_Earthquakes_1_int ro. mp 4 • http: //www. youtube. com/watch? feature=player _embedded&v=D 8 Py 3 Xg. RMkk • http: //stateimpact. npr. org/texas/2013/06/05/hig h‐wildfire‐risk‐longer‐fire‐season‐possible‐this‐ year/ • http: //www. preventionweb. net/posthfa/
And even more. . . http: //www. preventionweb. net/english /hyogo/mdg/? pid: 507&pil: 1 http: //www. preventionweb. net/english /professional/news/v. php? id=25221
- Slides: 73