
In The Name Of GOD Glucose Management Indicator






- Slides: 53
In The Name Of GOD
Glucose Management Indicator (GMI) soheila sadeghi
Hb. A 1 c has been the traditional method for assessing glycemic control. predict the risk of development of long-term complications It does not reflect intra- and interday glycemic excursions that may lead to acute events (such as hypoglycemia) or postprandial hyperglycemia, which have been linked to both microvascular and macrovascular complications.
Hb. A 1 c Limitation 1) provides only an average of glucose levels over the previous past 2 – 3 months 2) does not detect hypoglycemia or hyperglycemia on a daily basis 3) is an unreliable measure in patients with anemia , hemoglobinopathies , or iron deficiency and during pregnancy 4) does not reflect rapid changes in daily glucose control 5) does not provide data as to how to adjust the treatment regimen when Hb. A 1 c levels are elevated.
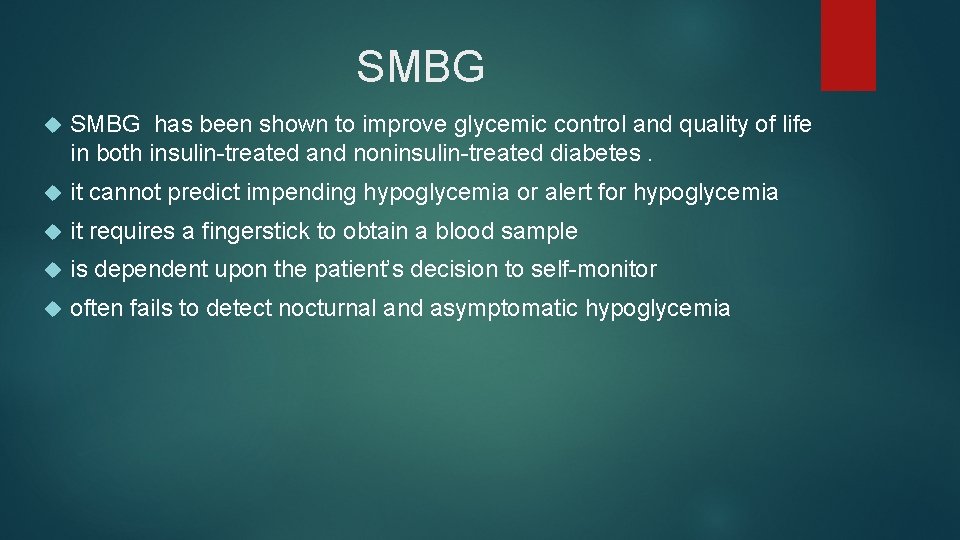
SMBG has been shown to improve glycemic control and quality of life in both insulin-treated and noninsulin-treated diabetes. it cannot predict impending hypoglycemia or alert for hypoglycemia it requires a fingerstick to obtain a blood sample is dependent upon the patient’s decision to self-monitor often fails to detect nocturnal and asymptomatic hypoglycemia
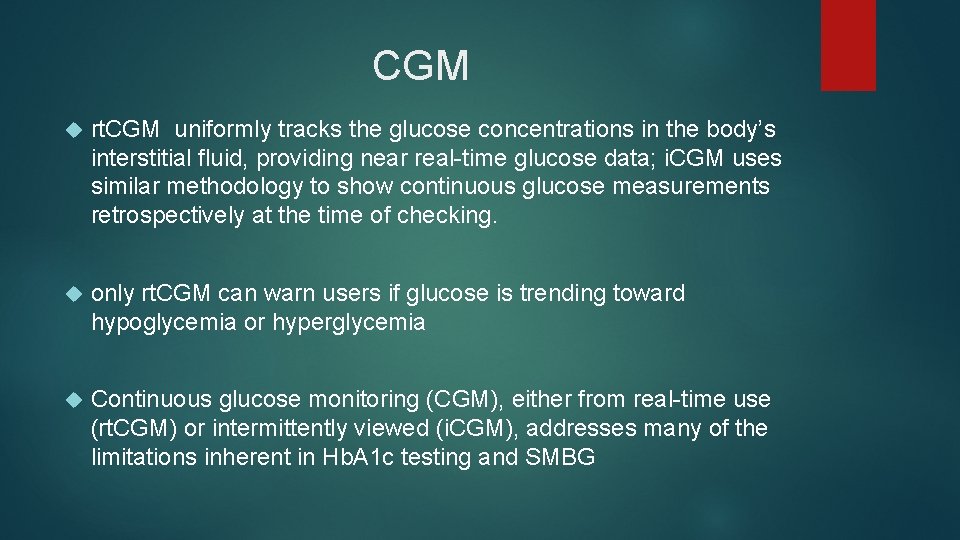
CGM rt. CGM uniformly tracks the glucose concentrations in the body’s interstitial fluid, providing near real-time glucose data; i. CGM uses similar methodology to show continuous glucose measurements retrospectively at the time of checking. only rt. CGM can warn users if glucose is trending toward hypoglycemia or hyperglycemia Continuous glucose monitoring (CGM), either from real-time use (rt. CGM) or intermittently viewed (i. CGM), addresses many of the limitations inherent in Hb. A 1 c testing and SMBG
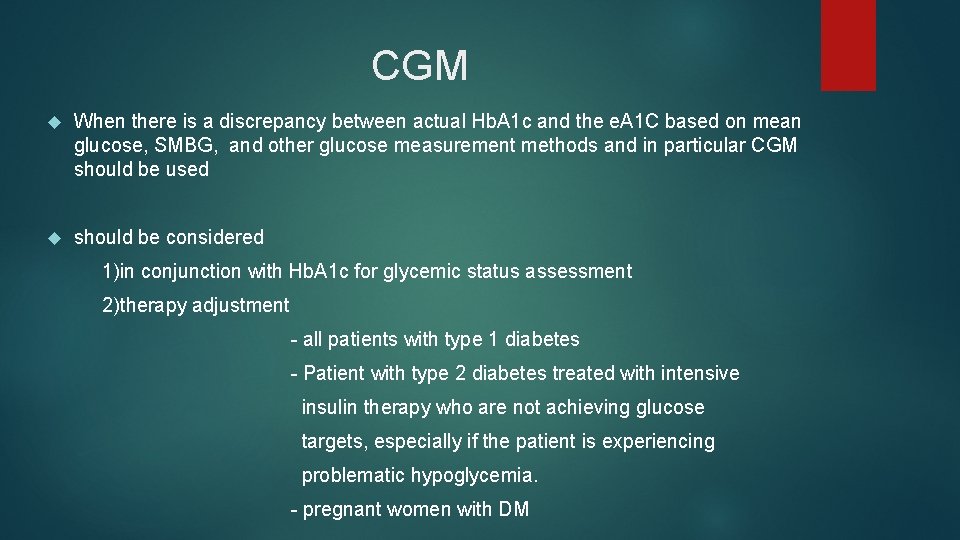
CGM When there is a discrepancy between actual Hb. A 1 c and the e. A 1 C based on mean glucose, SMBG, and other glucose measurement methods and in particular CGM should be used should be considered 1)in conjunction with Hb. A 1 c for glycemic status assessment 2)therapy adjustment - all patients with type 1 diabetes - Patient with type 2 diabetes treated with intensive insulin therapy who are not achieving glucose targets, especially if the patient is experiencing problematic hypoglycemia. - pregnant women with DM
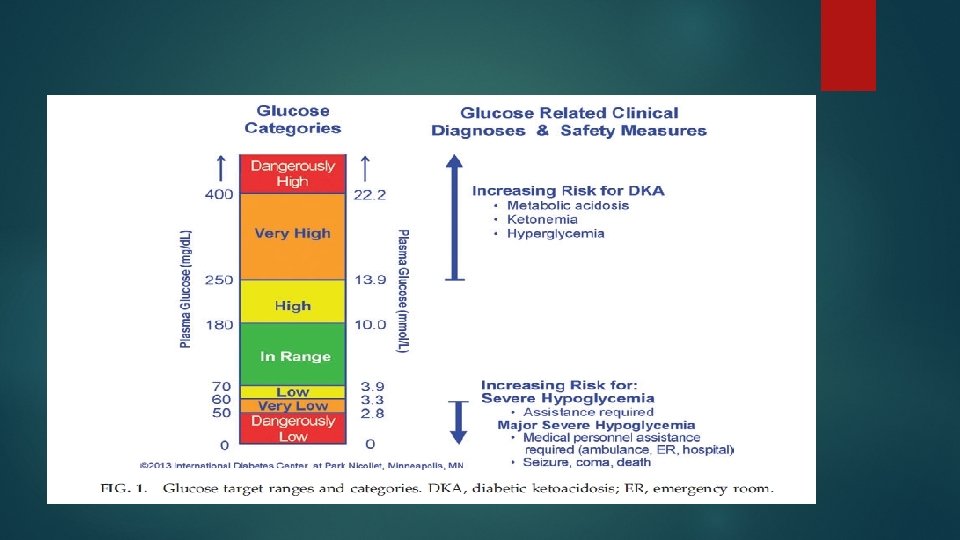
Glycemic Variability (GV ) = rate of change in glucose measured from the median curve [mg/d. L/h] - minimizing glucose variability is a treatment goal that if achieved can help one reach an acceptable Hb. A 1 c level without excessive hypoglycemia. TIR [time in range] = can be expressed as ‘‘% of readings’’ in range and ‘‘hours per day’’ in range (BS=70 – 180) Hyperglycemia = > 180 mg/d. L, > 250 mg/d. L, and > 400 mg/d. L Hypoglycemia = < 70 mg/d. L , < 60 mg/d. L, and < 50 mg/d. L
Three months of CGM data were collected on 257 individuals (age 10– 78 years) with T 1 DM (with a wide range of glycemic control) in two studies (one using the Abbott Free Style Libre Proand the other using the Dexcom G 4) Correlations were calculated between the full 3 months and incremental sampling periods of CGM data Median amount of CGM data was 82 days (interquartile range 75– 88)
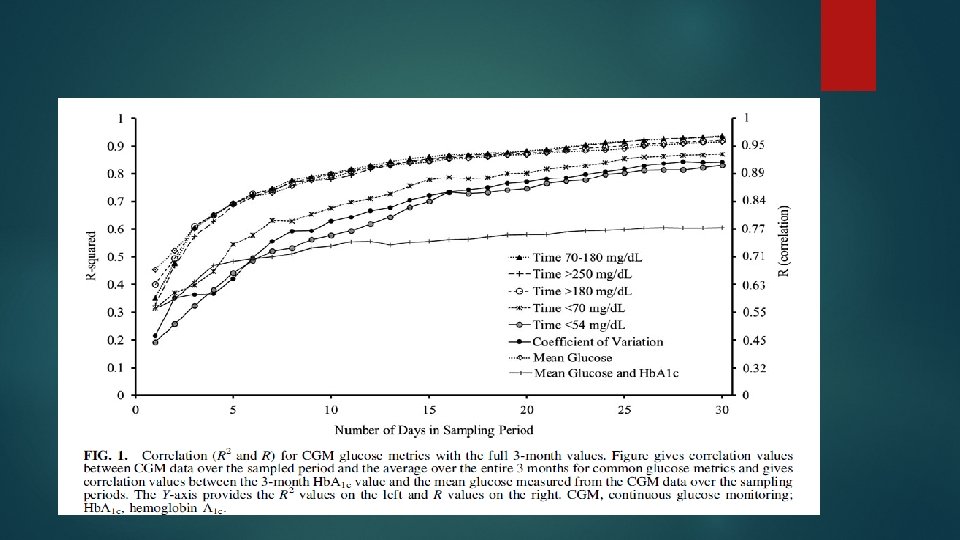
results indicate that 14 days of CGM data correlate well with 3 months of CGM data and additional days of data do not substantially increase this correlation, particularly for mean glucose, time in range, and hyperglycemia metrics Also found that sampling additional days beyond the last 14 days of CGM data does not substantially increase the correlation of Hb. A 1 c and mean glucose CGM data for at least 10– 14 days provides sufficient data to generate a representative CGM-derived mean glucose value for a given individual
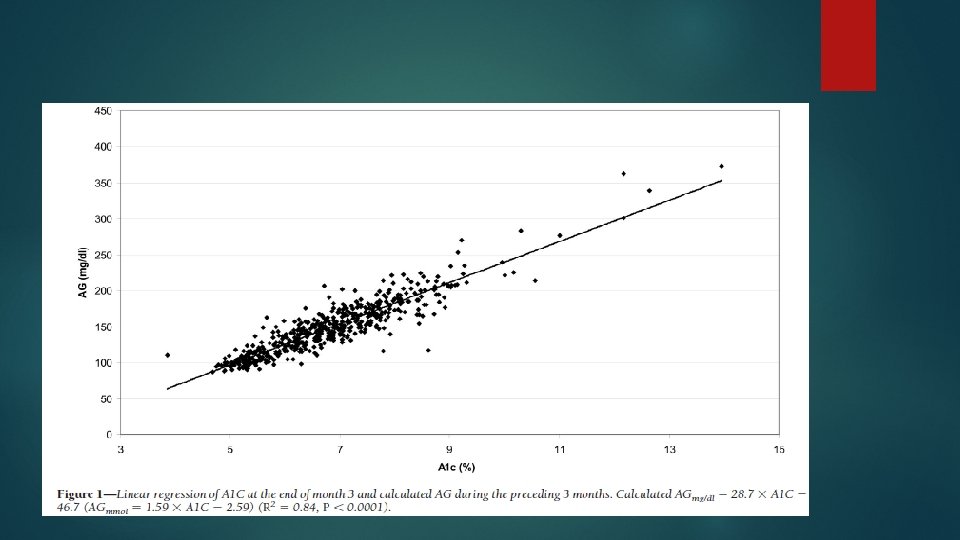
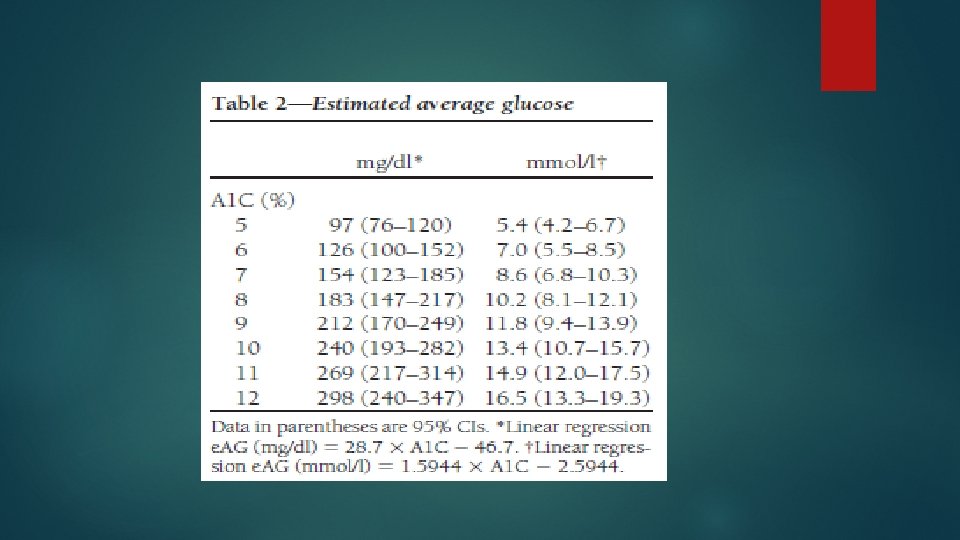
(ADAG) A 1 c-Derived Average Glucose study : A total of 507 subjects, including 268 patients with T 1 DM, 159 with T 2 DM, and 80 nondiabetic subjects from 10 international centers A 1 C levels obtained at the end of 3 months A 1 C compared with the AG levels during the previous 3 months AG was calculated by combining weighted results from at least 2 days of continuous glucose monitoring performed four times (every 4 weeks) , with seven-point daily self-monitoring of capillary (fingerstick) glucose performed at least 3 days per week.
A 1 C is an important measure of diabetes population health and of the risk for long term diabetes complications. since it cannot reveal extent or timing of hypoglycemia or the presence of clinically important glucose variability or hyperglycemia patterns. A 1 C also does not capture the daily nuances of insulin-dosing decisions and glycemic excursions. CGM can show trends in hypoglycemia, hyperglycemia, and glucose variability, some of which warrant immediate therapeutic action.
A recent study using modern CGM technology concluded that 10– 14 days of CGM data provide a good estimate of CGM metrics for a 3 -month period Ten days of CGM data is usually sufficient for an estimate of average glucose, time in target range, and time in hyperglycemia 14 days or more of CGM data provide a better estimate
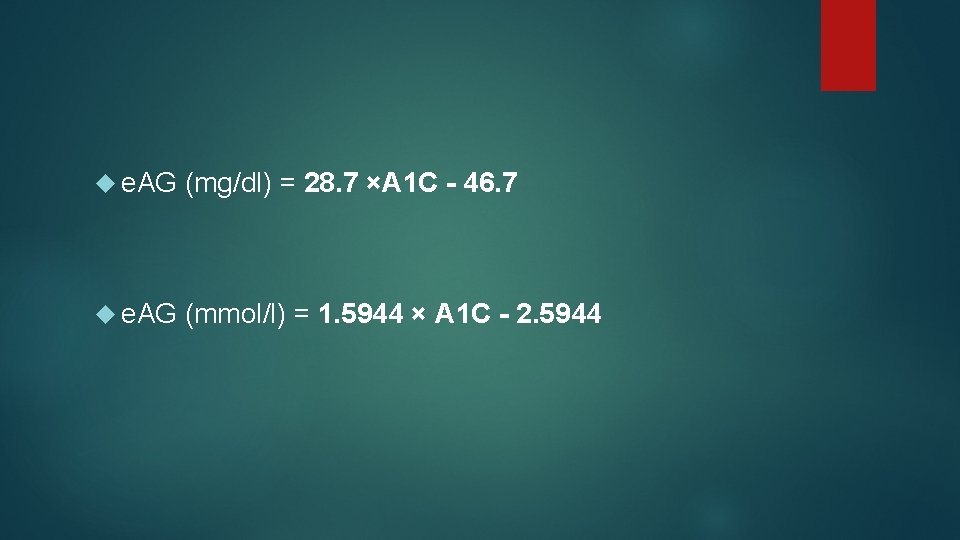
e. AG (mg/dl) = 28. 7 ×A 1 C - 46. 7 e. AG (mmol/l) = 1. 5944 × A 1 C - 2. 5944
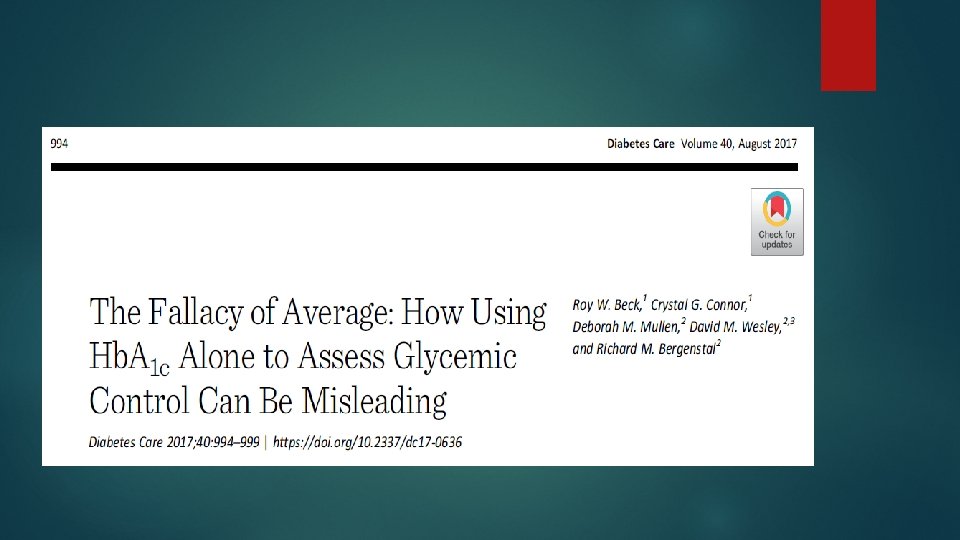
Hb. A 1 c may not be a good indicator of an individual patient’s glycemic control because of the wide range of mean glucose concentrations and glucose profiles that can be associated with a given Hb. A 1 c level In this study pooled data collected in 387 participants (age range 20– 78 years, 315 with type 1 diabetes and 72 with type 2 diabetes) in three randomized trials using the Dexcom G 4 Platinum CGM Mean glucose concentration was for each participant using up to 13 weeks of CGM data (median amount of CGM data 66 days) plotted versus Hb. A 1 c measured following the collection of the CGM data
Thus, estimating glycemic control by Hb. A 1 c alone may not be accurate for some patients The best way to determine whether a given Hb. A 1 c might be over- or underestimating a patient’s level of glycemic control is with CGM Ideally CGM data should be obtained for at least 14 days Estimated Hb. A 1 c can be determined from the plot shown in Fig. 2 or by plugging the mean glucose concentration into the following formula: 3. 38 + 0. 02345 ×[mean glucose]
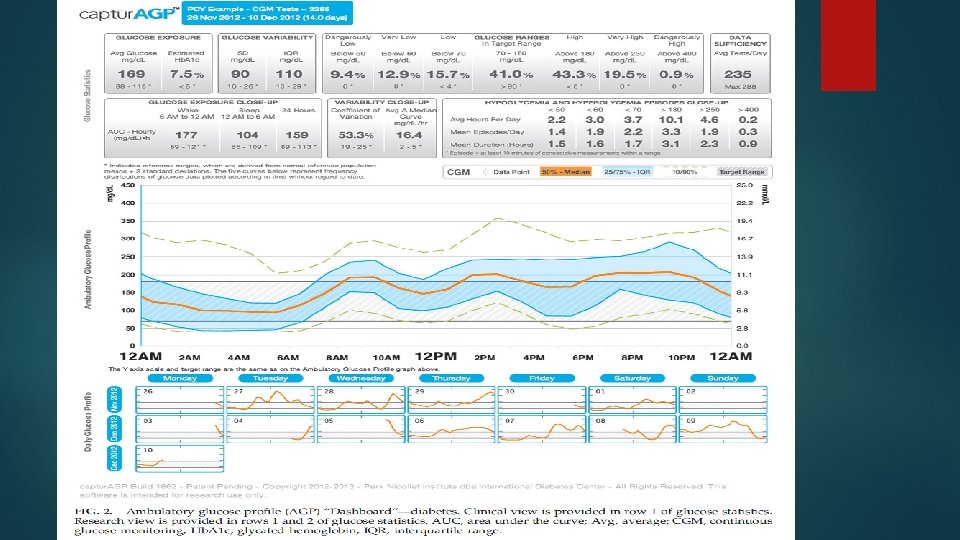
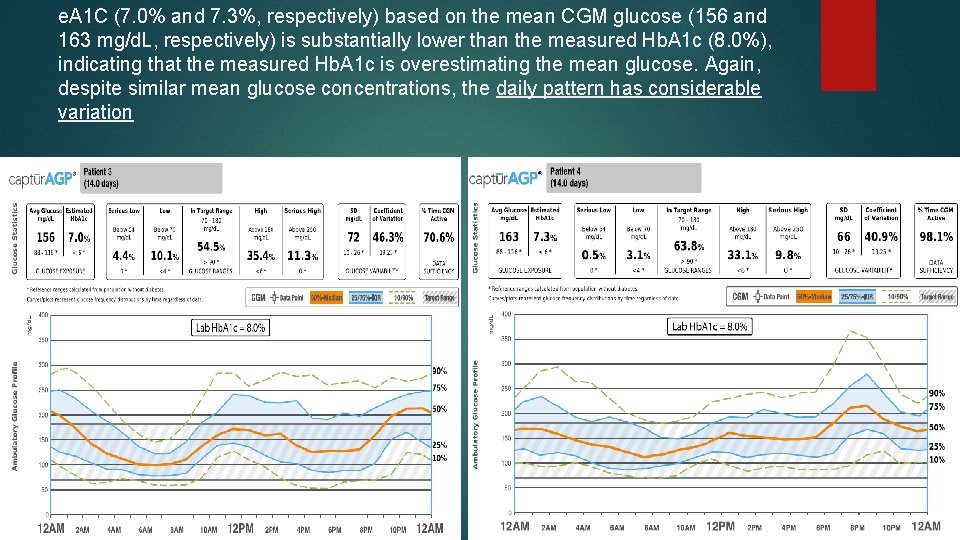
AGPs are shown for four adults with type 1 diabetes using multiple daily injections of insulin, all with an Hb. A 1 c of 8. 0% from the same central reference laboratory Displayed are 2 weeks of CGM data (up to 288 CGM values/day) for each patient measured just prior to the Hb. A 1 c laboratory test. Shown are the median lines of all the glucose values over 2 weeks The hatched area is the target glucose range of 70– 180 mg/d. L
e. A 1 C (8. 4%) based on mean CGM glucose (195 mg/d. L) is slightly higher than the measured Hb. A 1 c (8. 0%), indicating that the measured Hb. A 1 c is slightly underestimating the mean glucose and that despite the same mean glucose daily pattern varies considerably. , the
e. A 1 C (7. 0% and 7. 3%, respectively) based on the mean CGM glucose (156 and 163 mg/d. L, respectively) is substantially lower than the measured Hb. A 1 c (8. 0%), indicating that the measured Hb. A 1 c is overestimating the mean glucose. Again, despite similar mean glucose concentrations, the daily pattern has considerable variation
Clinical note 1: Although each of the four patients has the same. Hb. A 1 c, the AGP patterns are very different and would suggest different insulin and or lifestyle interventions. Clinical note 2: The mean glucose varies from 156 to 195 mg/d. L among the four patients.
with the increasing use of continuous glucose monitoring (CGM) to help facilitate safe and effective diabetes management, it is important to understand how CGM metrics, such as mean glucose, and A 1 C correlate. Estimated A 1 C (e. A 1 C) is a measure converting the mean glucose from CGM or self-monitored blood glucose readings some patients and clinicians are often confused or even frustrated if the e. A 1 C and laboratory-measured A 1 C do not agree FDA determined the nomenclature of e. A 1 C needed to change. which includes renaming the e. A 1 C the glucose management indicator (GMI) and generating a new formula
WHY IS A CHANGE IN THE NAME e. A 1 C NEEDED? As was shown in a recent article by Beck et al. a laboratory-measured A 1 C of 8. 0% could be associated with a CGM-measured mean glucose concentration as low as 155 mg/d. L (for which the estimate of A 1 C from mean glucose would be 7. 0%) or as high as 218 mg/d. L (for which the estimate of A 1 C from mean glucose would be 8. 5%). This discordance between the e. A 1 C and the measured A 1 C can be confusing for patients and clinicians. concluded that coining a name other than “estimated A 1 C” would reduce confusion
WHY WAS THE TERM GMI SELECTED? It was suggested that the new term not include either “estimated” or “A 1 C” to avoid a misinterpretation the word “index” was avoided because when paired with the word glucose or glycemic, which were words likely to be in the new term The term GMI is a measure derived from glucose values and can provide an indication of the current state of a person’s glucose management. “Glucose control indicator” or “glucose management indicator”
HOW IS GMI CALCULATED? Use A 1 c-Derived Average Glucose (ADAG) study which consisted of a data set with a median of 13 days of CGM measurements plus 39 days of SMBG to concept of estimating mean glucose from a measured A 1 C Beck et al. published an equation (3. 38 + 0. 02345 × [mean glucose in mg/d. L]) to estimate A 1 C from CGM-measured mean glucose concentration using modern CGM technology To validate this formula, CGM data from the Hypo. DE study (141 individuals with T 1 D for whom 4 weeks of data were collected with the Dexcom G 5 sensor prior to A 1 C measurement)
The Hypo. DE study was a 6 -month, multicentre, open-label, parallel, randomised controlled trial done at 12 diabetes practices in Germany The calculated equation from the Hypo. DE data (3. 15 + 0. 02505 ×[mean glucose in mg/d. L]) is quite similar to the aforementioned equation, in essence validating the publication by Beck et al
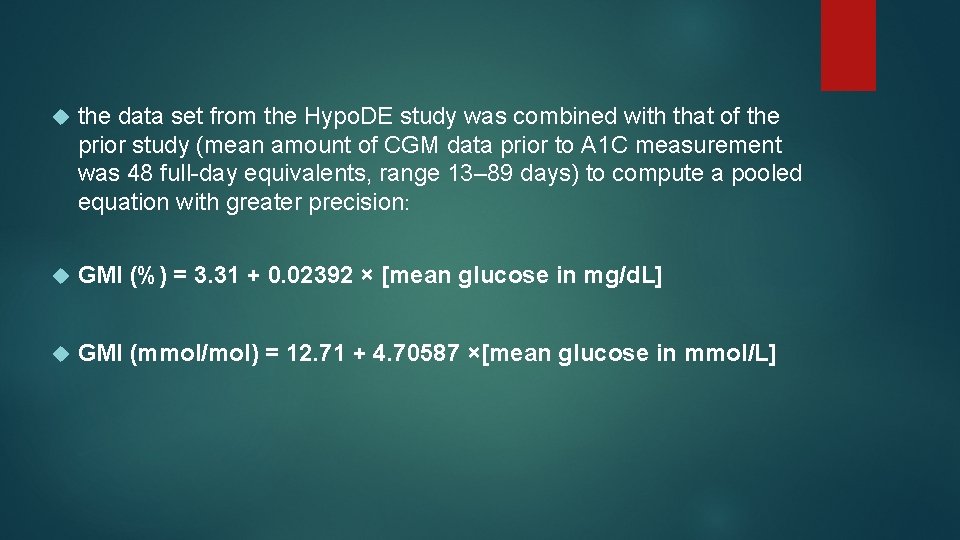
the data set from the Hypo. DE study was combined with that of the prior study (mean amount of CGM data prior to A 1 C measurement was 48 full-day equivalents, range 13– 89 days) to compute a pooled equation with greater precision: GMI (%) = 3. 31 + 0. 02392 × [mean glucose in mg/d. L] GMI (mmol/mol) = 12. 71 + 4. 70587 ×[mean glucose in mmol/L]
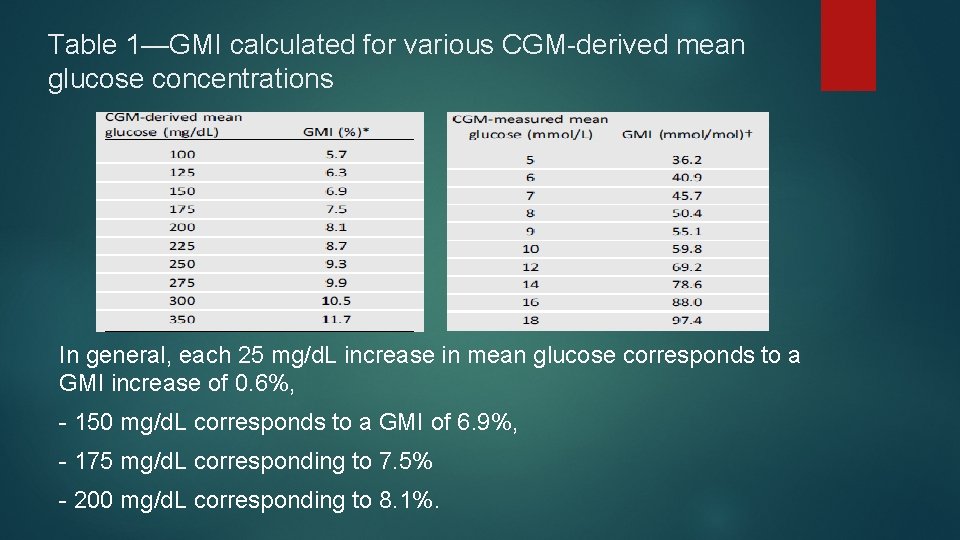
Table 1—GMI calculated for various CGM-derived mean glucose concentrations In general, each 25 mg/d. L increase in mean glucose corresponds to a GMI increase of 0. 6%, - 150 mg/d. L corresponds to a GMI of 6. 9%, - 175 mg/d. L corresponding to 7. 5% - 200 mg/d. L corresponding to 8. 1%.
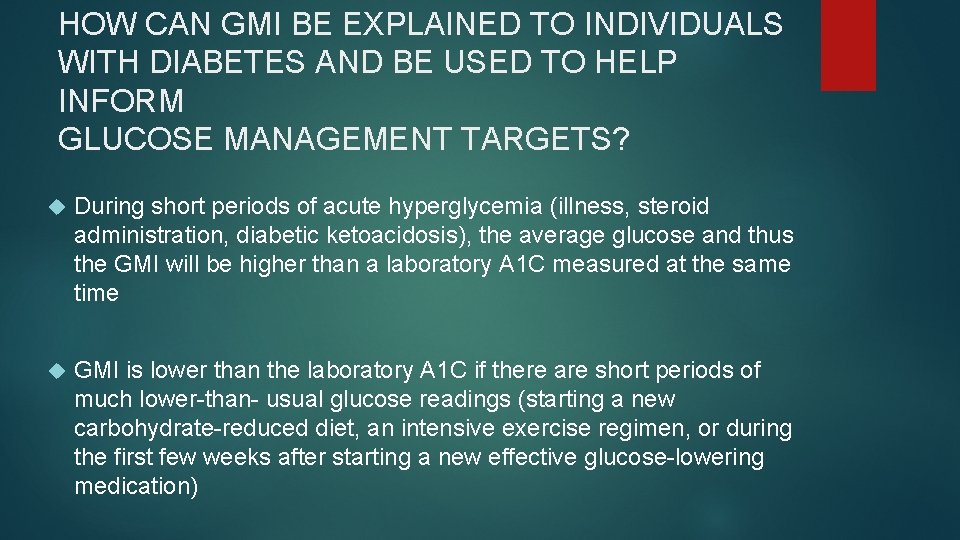
HOW CAN GMI BE EXPLAINED TO INDIVIDUALS WITH DIABETES AND BE USED TO HELP INFORM GLUCOSE MANAGEMENT TARGETS? During short periods of acute hyperglycemia (illness, steroid administration, diabetic ketoacidosis), the average glucose and thus the GMI will be higher than a laboratory A 1 C measured at the same time GMI is lower than the laboratory A 1 C if there are short periods of much lower-than- usual glucose readings (starting a new carbohydrate-reduced diet, an intensive exercise regimen, or during the first few weeks after starting a new effective glucose-lowering medication)
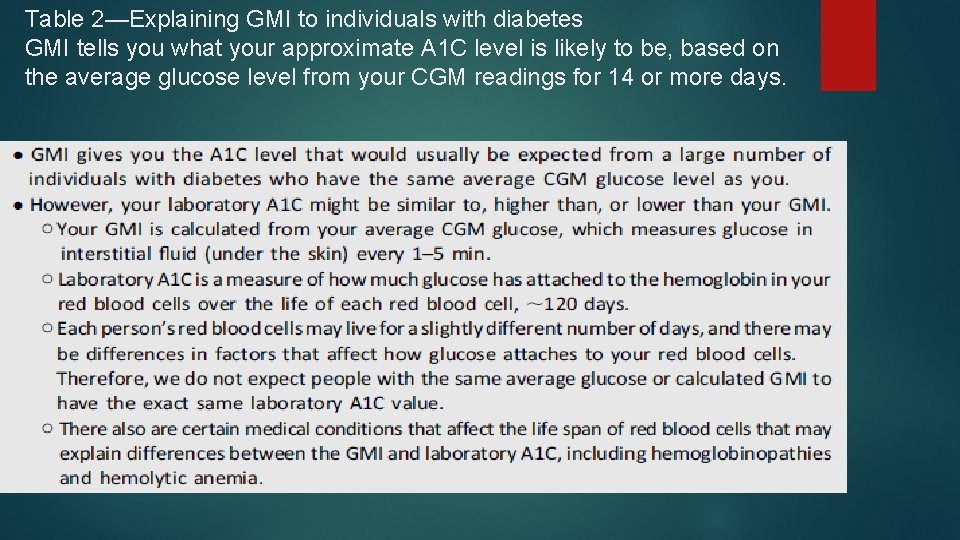
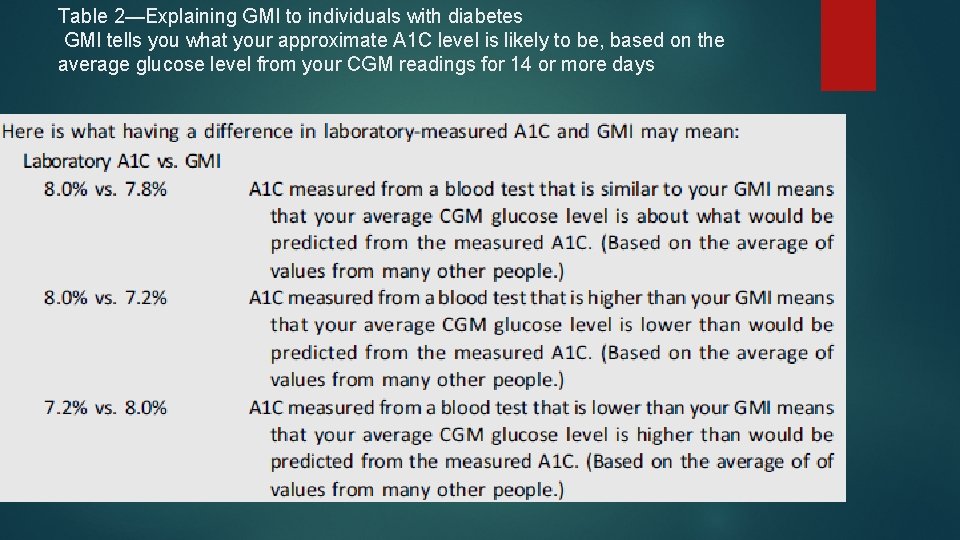
Table 2—Explaining GMI to individuals with diabetes GMI tells you what your approximate A 1 C level is likely to be, based on the average glucose level from your CGM readings for 14 or more days.
Table 2—Explaining GMI to individuals with diabetes GMI tells you what your approximate A 1 C level is likely to be, based on the average glucose level from your CGM readings for 14 or more days
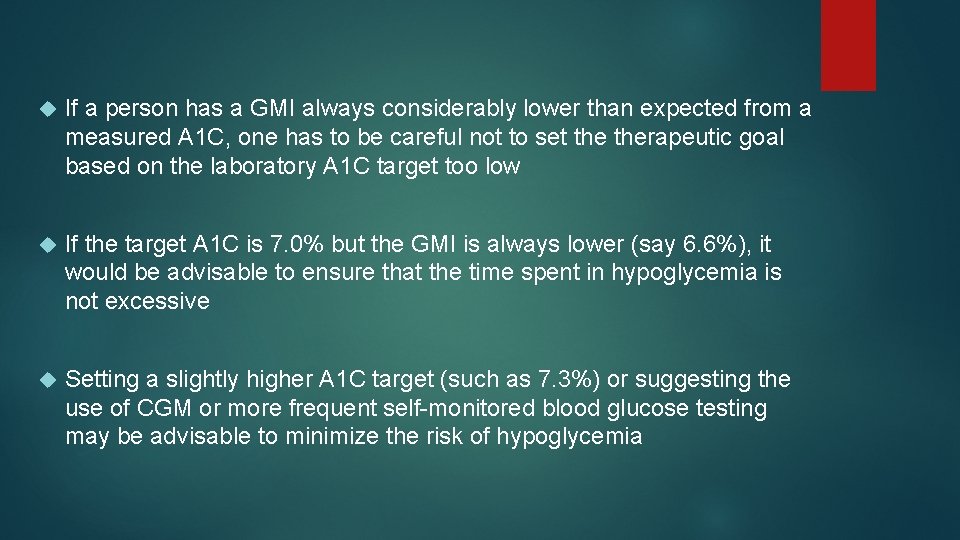
If a person has a GMI always considerably lower than expected from a measured A 1 C, one has to be careful not to set therapeutic goal based on the laboratory A 1 C target too low If the target A 1 C is 7. 0% but the GMI is always lower (say 6. 6%), it would be advisable to ensure that the time spent in hypoglycemia is not excessive Setting a slightly higher A 1 C target (such as 7. 3%) or suggesting the use of CGM or more frequent self-monitored blood glucose testing may be advisable to minimize the risk of hypoglycemia
If a person has a GMI always considerably higher than expected from a measured A 1 C, one has to be careful not to set the laboratory A 1 C target too high If the target A 1 C is 7. 5% and the GMI is always higher (say 7. 9%), it might be safe to set the A 1 C target slightly lower, such as at 7. 2%, in order to minimize excessive hyperglycemia the difference in laboratory A 1 C and GMI remains relatively stable for each individual over time
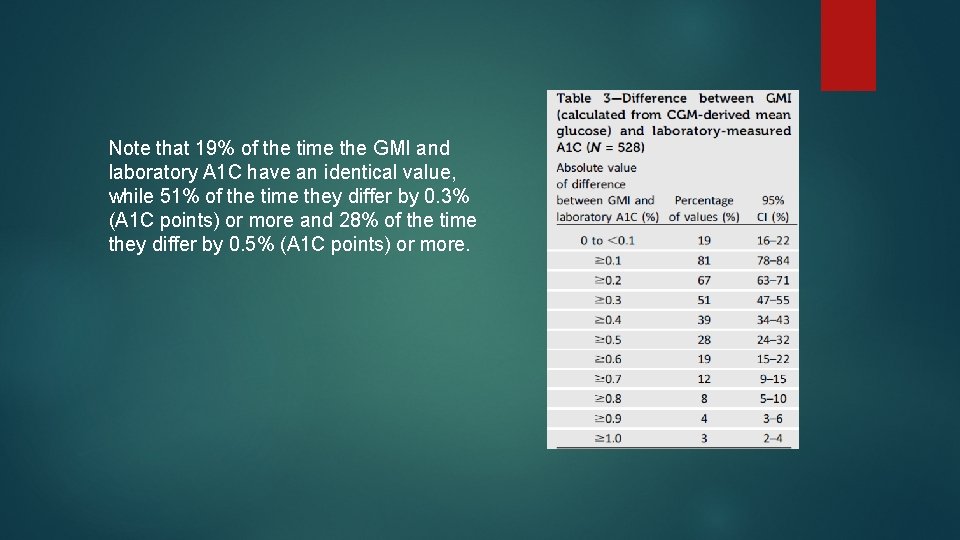
Note that 19% of the time the GMI and laboratory A 1 C have an identical value, while 51% of the time they differ by 0. 3% (A 1 C points) or more and 28% of the time they differ by 0. 5% (A 1 C points) or more.
WHY IS IT IMPORTANT TO USE BOTH THE A 1 C AND CGM(METRICS AND PROFILES) IN DIABETES MANAGEMENT? laboratory-measured A 1 C and CGM derived glucose data may be used in different ways to inform a glucose management plan The A 1 C target for a person with diabetes should be individualized or modified based on: - patient characteristics (age, life expectancy, awareness of hypoglycemia, severity of complications, pregnancy) - the level of engagement in diabetes self-management (educational and psychosocial circumstances) - glucose monitoring data including the GMI
Formulating an individualized A 1 C target is only one component of an effective glucose management plan real-time CGM glucose data provides additional information to help guide appropriate medication or lifestyle selection and adjustment The effectiveness of the current diabetes management plan include average glucose, GMI, time in range (time in target range 70– 180 mg/d. L), time in hypoglycemia ( <70 and , <54 mg/d. L), time in hyperglycemia ( >180 and >250 mg/d. L), and a measure of glucose variability
For example, someone who has an A 1 C of 6. 8% and who spends 10% of the day in hypoglycemia would benefit from a care plan different than someone who has an A 1 C of 6. 8% and who spends 1% of the day in hypoglycemia GMI can also give patients and providers perspective on how an overall laboratory A 1 C is trending, but in a shorter time window For instance, if a new therapy is added and GMI moves from 8. 5 to 7. 8% in 2– 4 weeks-and there is no meaningful increase in hypoglycemia- it is probably working
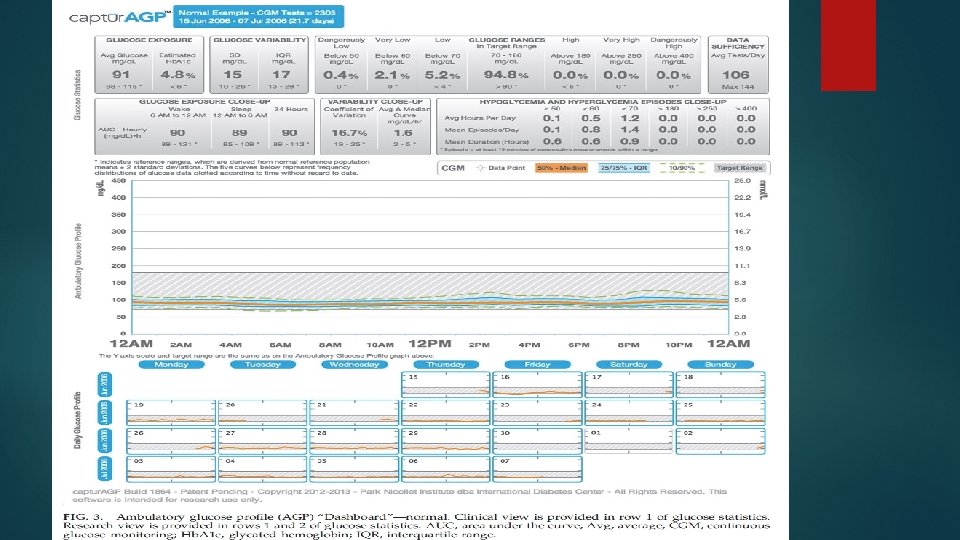
Now that CGM profile visualization is moving toward a standard ambulatory glucose profile what time of day and on which days there are patterns of hypoglycemia or hyperglycemia that need attention in order to safely work toward spending more and more time in the target range
CONCLUSIONS CGM is being used more frequently in patients with T 1 D and in some patients with T 2 D, particularly those using insulin, and in pregnancy many CGM devices are now smaller, more accurate, factory calibrated (no finger sticks), increasingly affordable A 1 C is currently the primary measure guiding glucose management and a valuable marker of the risk of developing diabetes complications GMI along with the other CGM metrics provide for a much more personalized diabetes management plan