
in partnership with The Role of Cytogenetics in
- Slides: 57
in partnership with The Role of Cytogenetics in Elderly patients with Myeloma Dr Faith Davies Cancer Research UK Senior Cancer Fellow Centre for Myeloma Research Divisions of Molecular Pathology, Cancer Therapeutics and Clinical Studies Royal Marsden Hospital and The Institute of Cancer Research London Making the discoveries that defeat cancer
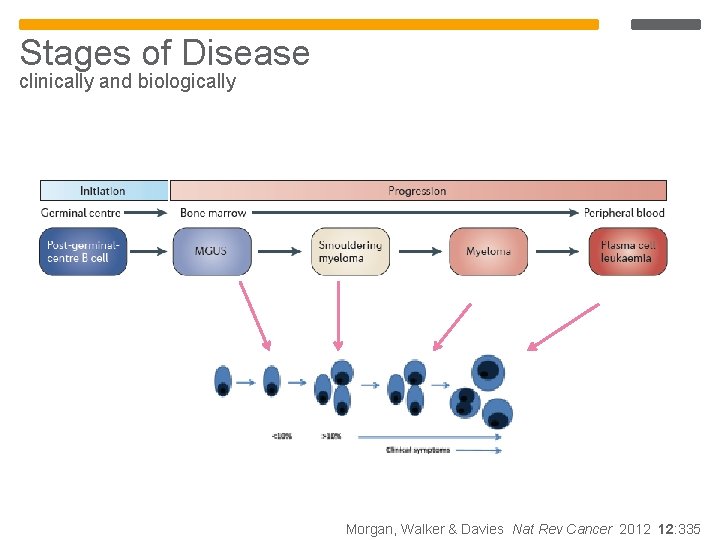
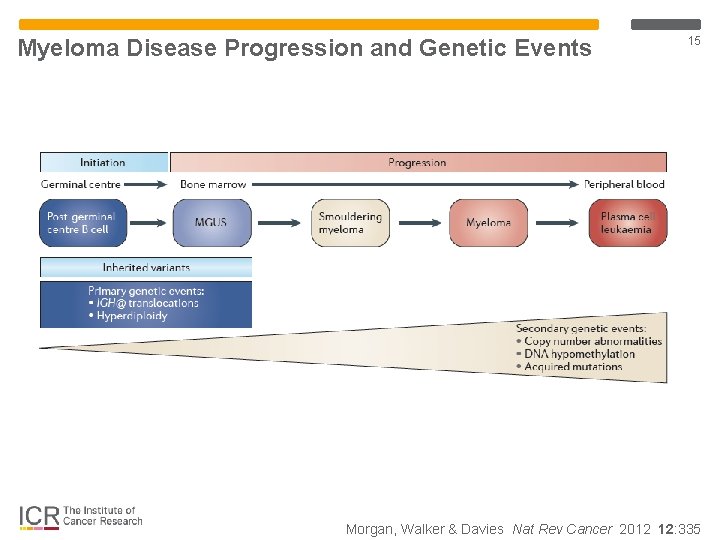
Stages of Disease clinically and biologically Morgan, Walker & Davies Nat Rev Cancer 2012 12: 335
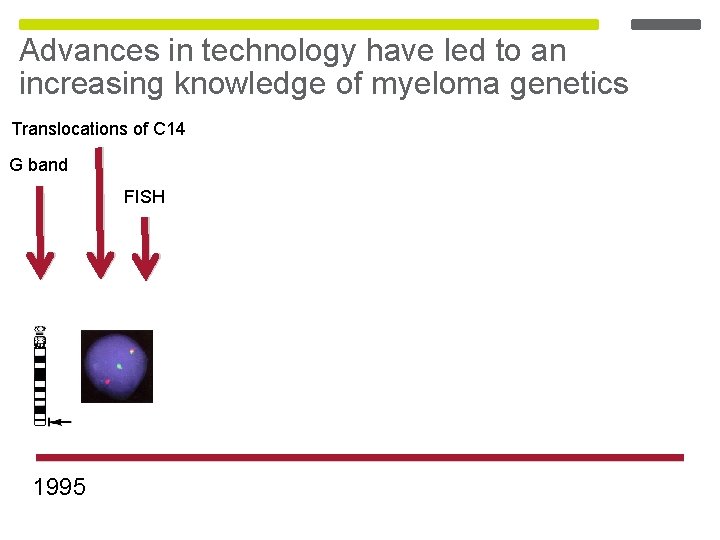
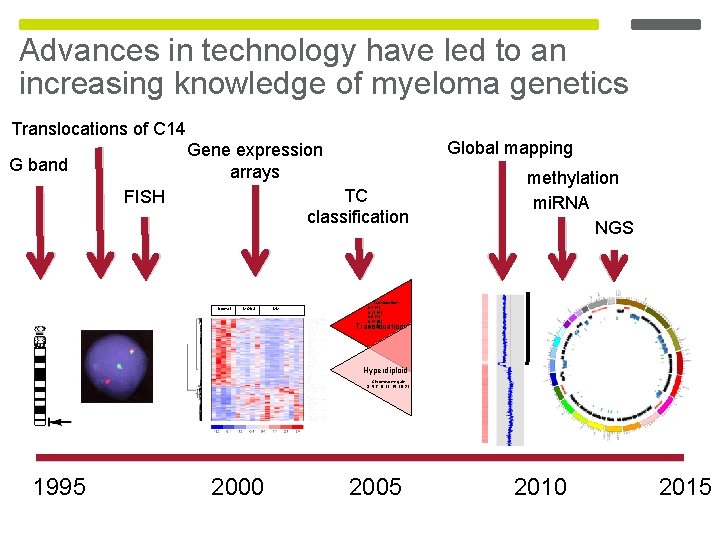
Advances in technology have led to an increasing knowledge of myeloma genetics Translocations of C 14 G band FISH 1995
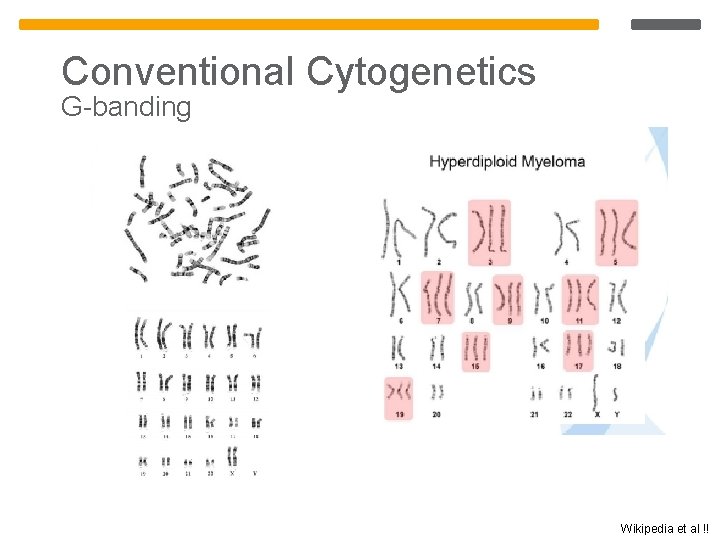
Conventional Cytogenetics G-banding Wikipedia et al !!
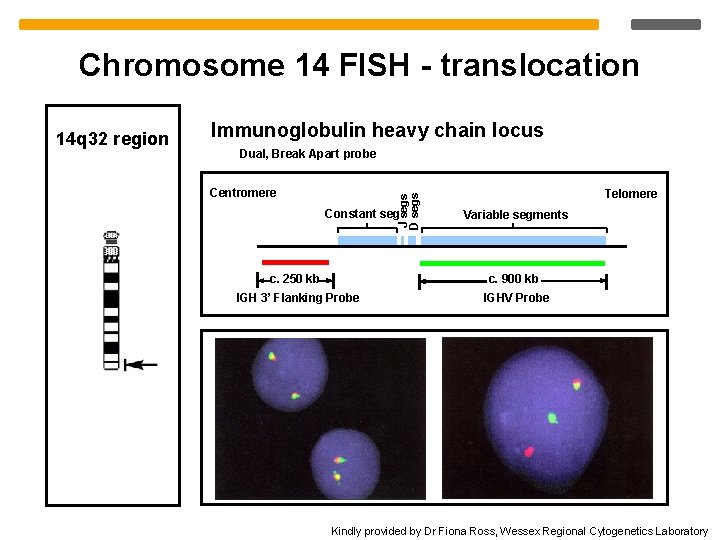
Chromosome 14 FISH - translocation Immunoglobulin heavy chain locus Dual, Break Apart probe Centromere J segs D segs 14 q 32 region Constant seg Telomere Variable segments c. 250 kb c. 900 kb IGH 3’ Flanking Probe IGHV Probe Kindly provided by Dr Fiona Ross, Wessex Regional Cytogenetics Laboratory
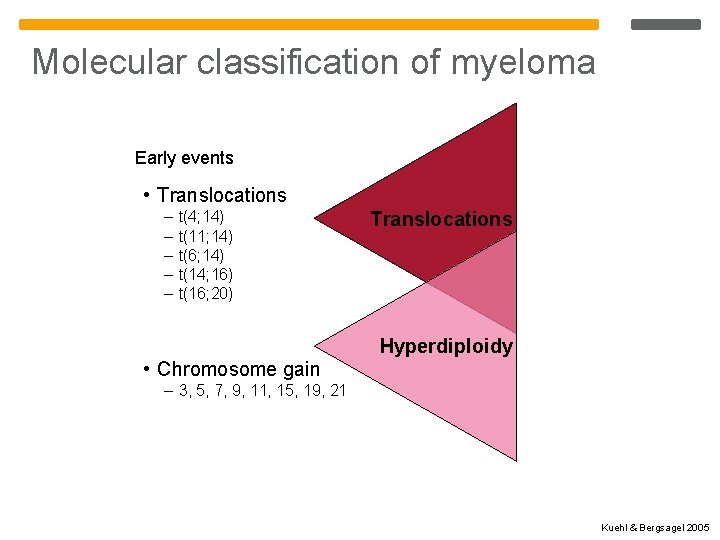
Molecular classification of myeloma Early events • Translocations – – – t(4; 14) t(11; 14) t(6; 14) t(14; 16) t(16; 20) • Chromosome gain Translocations Hyperdiploidy – 3, 5, 7, 9, 11, 15, 19, 21 Kuehl & Bergsagel 2005
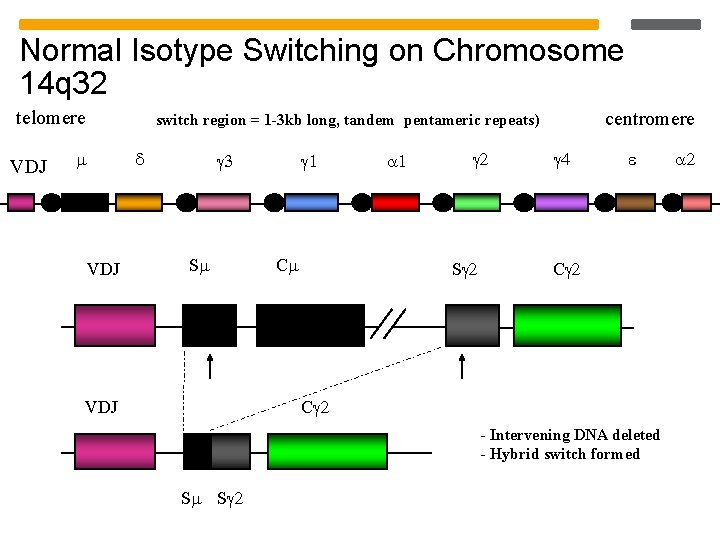
Normal Isotype Switching on Chromosome 14 q 32 telomere VDJ centromere switch region = 1 -3 kb long, tandem pentameric repeats) VDJ S VDJ C S C C - Intervening DNA deleted - Hybrid switch formed S S
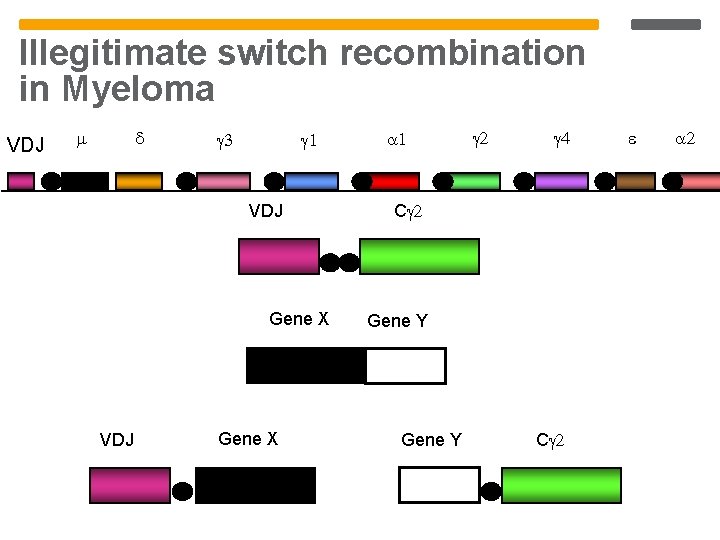
Illegitimate switch recombination in Myeloma VDJ VDJ Gene X C Gene Y C
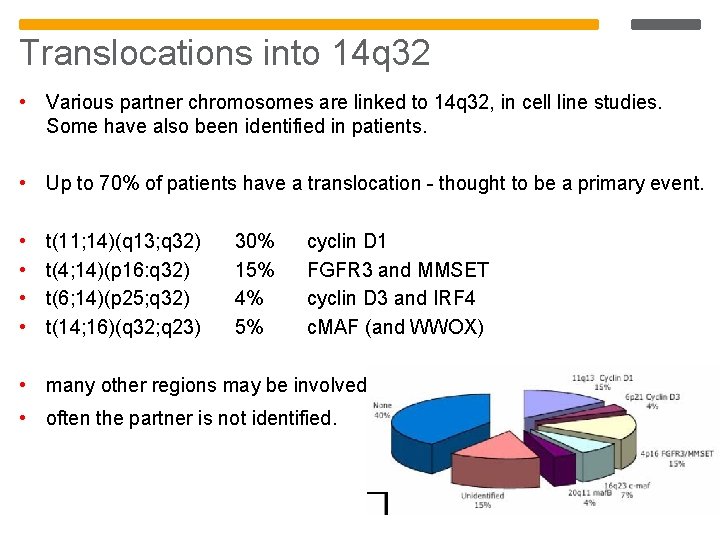
Translocations into 14 q 32 • Various partner chromosomes are linked to 14 q 32, in cell line studies. Some have also been identified in patients. • Up to 70% of patients have a translocation - thought to be a primary event. • • t(11; 14)(q 13; q 32) t(4; 14)(p 16: q 32) t(6; 14)(p 25; q 32) t(14; 16)(q 32; q 23) 30% 15% 4% 5% cyclin D 1 FGFR 3 and MMSET cyclin D 3 and IRF 4 c. MAF (and WWOX) • many other regions may be involved • often the partner is not identified.
Advances in technology have led to an increasing knowledge of myeloma genetics Translocations of C 14 Global mapping Gene expression arrays G band TC classification FISH Normal MGUS MM methylation mi. RNA NGS Translocations t(4; 14) t(11; 14) t(6; 14) t(14; 16) t(14; 20) Translocations Hyperdiploid Chromosome gain 3, 5, 7, 9, 11, 15, 19, 21 1995 2000 2005 2010 2015
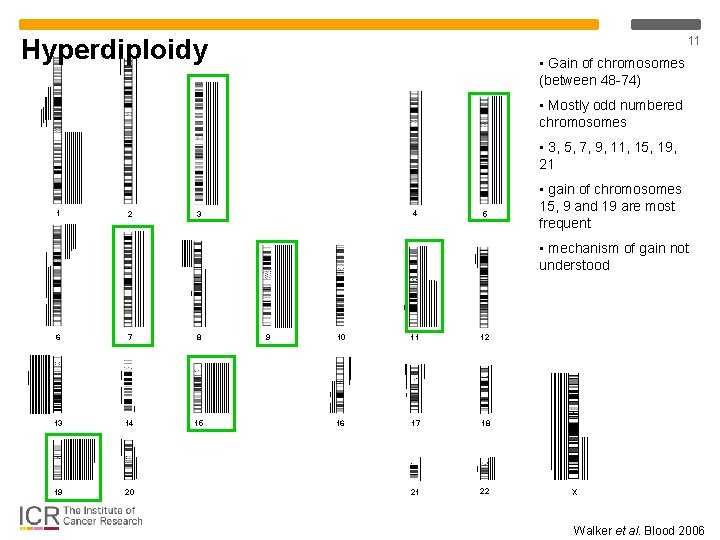
Hyperdiploidy 11 • Gain of chromosomes (between 48 -74) • Mostly odd numbered chromosomes • 3, 5, 7, 9, 11, 15, 19, 21 1 2 4 3 5 • gain of chromosomes 15, 9 and 19 are most frequent • mechanism of gain not understood 6 7 8 13 14 15 19 20 9 10 11 12 16 17 18 21 22 X Walker et al. Blood 2006
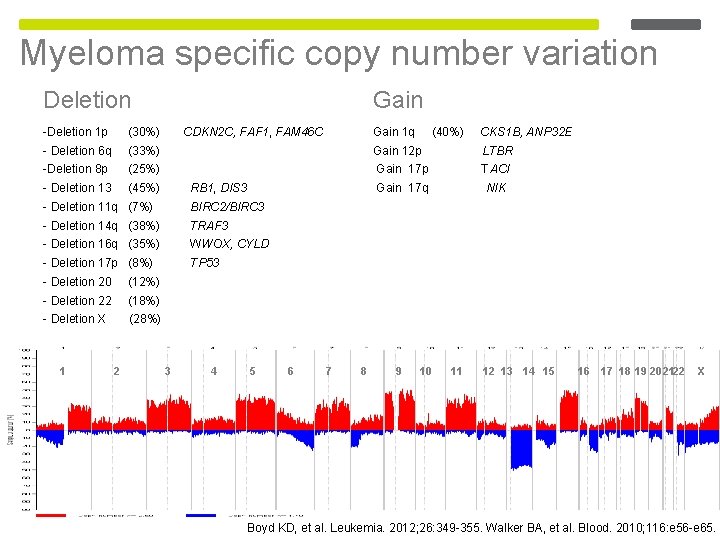
Myeloma specific copy number variation Deletion -Deletion 1 p - Deletion 6 q -Deletion 8 p - Deletion 13 - Deletion 11 q - Deletion 14 q - Deletion 16 q - Deletion 17 p - Deletion 20 - Deletion 22 - Deletion X 1 2 Gain (30%) CDKN 2 C, FAF 1, FAM 46 C Gain 1 q (40%) CKS 1 B, ANP 32 E (33%) Gain 12 p LTBR (25%) Gain 17 p TACI Gain 17 q NIK (45%) RB 1, DIS 3 (7%) BIRC 2/BIRC 3 (38%) TRAF 3 (35%) WWOX, CYLD (8%) TP 53 (12%) (18%) (28%) 3 4 5 6 7 8 9 10 11 12 13 14 15 16 17 18 19 202122 X Boyd KD, et al. Leukemia. 2012; 26: 349 -355. Walker BA, et al. Blood. 2010; 116: e 56 -e 65.
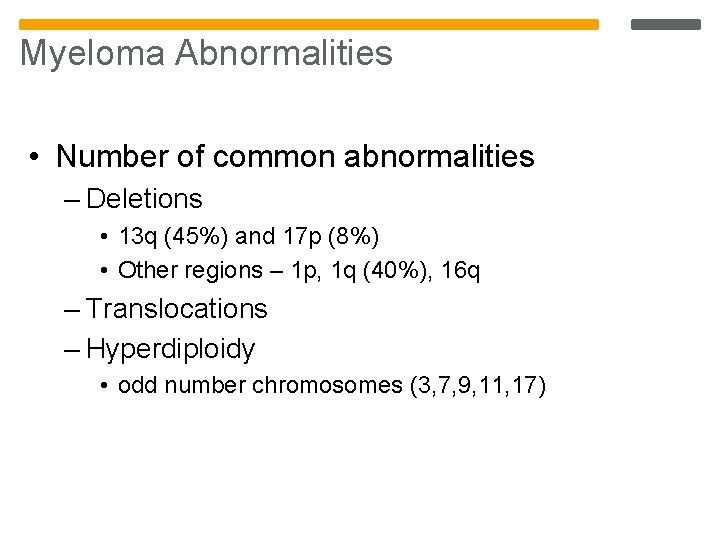
Myeloma Abnormalities • Number of common abnormalities – Deletions • 13 q (45%) and 17 p (8%) • Other regions – 1 p, 1 q (40%), 16 q – Translocations – Hyperdiploidy • odd number chromosomes (3, 7, 9, 11, 17)
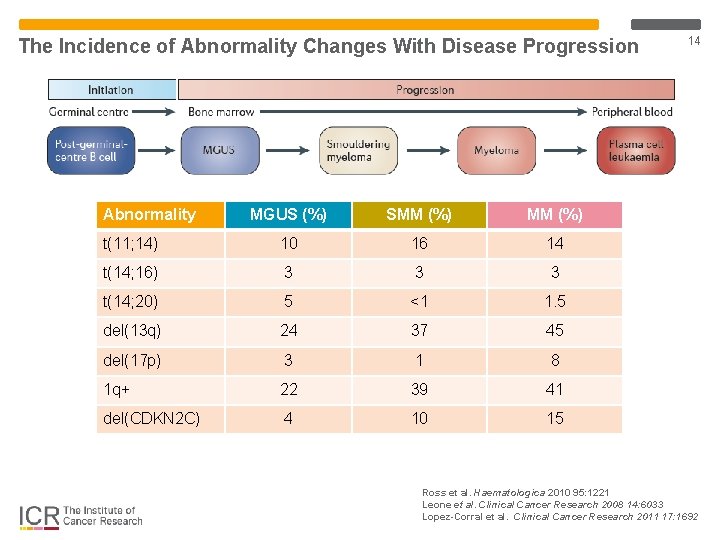
The Incidence of Abnormality Changes With Disease Progression Abnormality MGUS (%) SMM (%) t(11; 14) 10 16 14 t(14; 16) 3 3 3 t(14; 20) 5 <1 1. 5 del(13 q) 24 37 45 del(17 p) 3 1 8 1 q+ 22 39 41 del(CDKN 2 C) 4 10 15 14 Ross et al. Haematologica 2010 95: 1221 Leone et al. Clinical Cancer Research 2008 14: 6033 Lopez-Corral et al. Clinical Cancer Research 2011 17: 1692
Myeloma Disease Progression and Genetic Events 15 Morgan, Walker & Davies Nat Rev Cancer 2012 12: 335
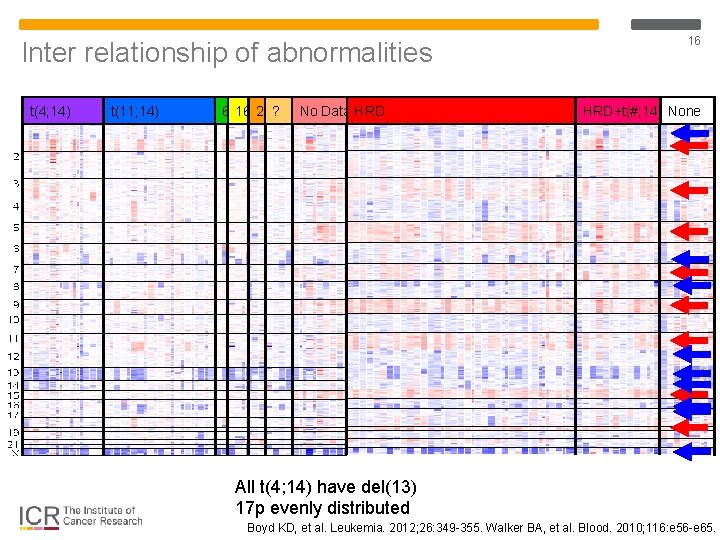
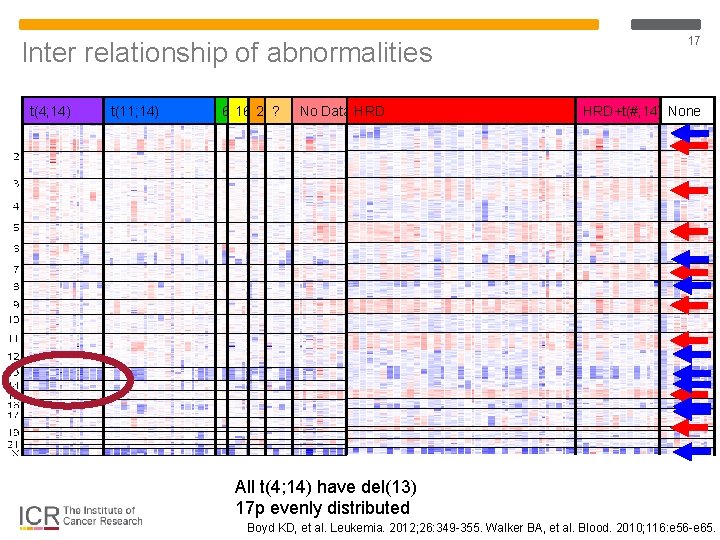
Inter relationship of abnormalities t(4; 14) t(11; 14) 6 16 20? No Data HRD 16 HRD+t(#; 14) None All t(4; 14) have del(13) 17 p evenly distributed Boyd KD, et al. Leukemia. 2012; 26: 349 -355. Walker BA, et al. Blood. 2010; 116: e 56 -e 65.
Inter relationship of abnormalities t(4; 14) t(11; 14) 6 16 20? No Data HRD 17 HRD+t(#; 14) None All t(4; 14) have del(13) 17 p evenly distributed Boyd KD, et al. Leukemia. 2012; 26: 349 -355. Walker BA, et al. Blood. 2010; 116: e 56 -e 65.
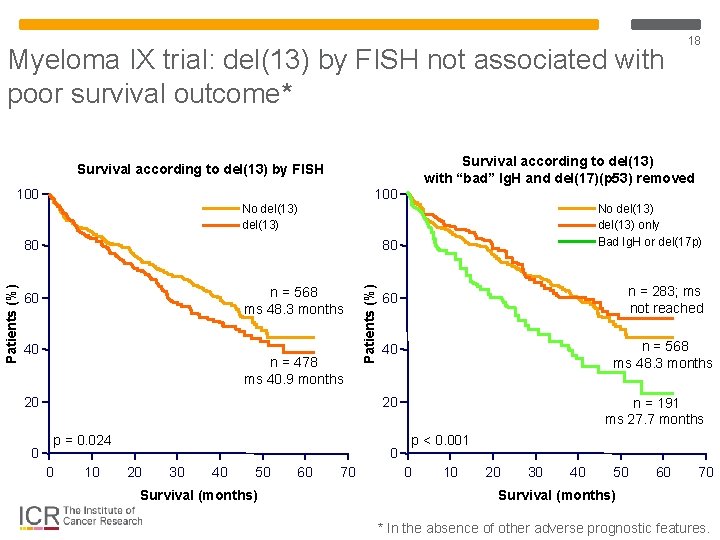
Myeloma IX trial: del(13) by FISH not associated with poor survival outcome* Survival according to del(13) with “bad” Ig. H and del(17)(p 53) removed Survival according to del(13) by FISH 100 No del(13) n = 568 ms 48. 3 months 40 n = 478 ms 40. 9 months 20 0 No del(13) only Bad Ig. H or del(17 p) 80 Patients (%) 80 60 60 n = 283; ms not reached 40 n = 568 ms 48. 3 months 20 p = 0. 024 0 10 0 20 30 40 50 Survival (months) 60 18 70 n = 191 ms 27. 7 months p < 0. 001 0 10 20 30 40 50 60 70 Survival (months) * In the absence of other adverse prognostic features.
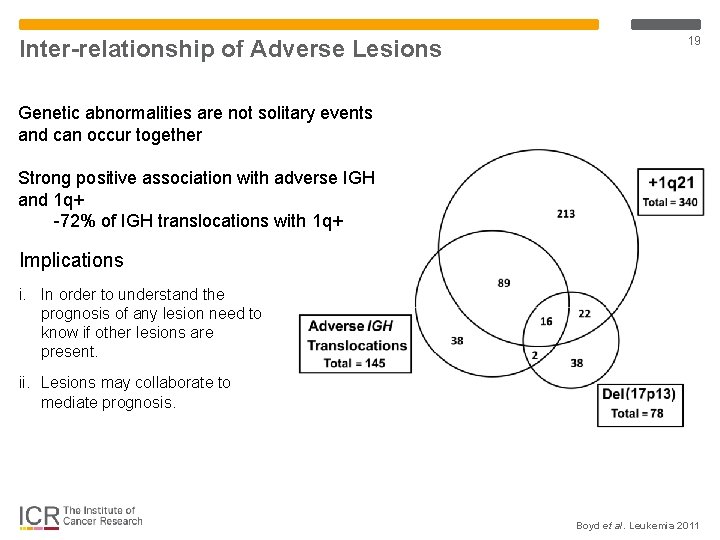
Inter-relationship of Adverse Lesions 19 Genetic abnormalities are not solitary events and can occur together Strong positive association with adverse IGH and 1 q+ -72% of IGH translocations with 1 q+ Implications i. In order to understand the prognosis of any lesion need to know if other lesions are present. ii. Lesions may collaborate to mediate prognosis. Boyd et al. Leukemia 2011
Frequency in the Elderly
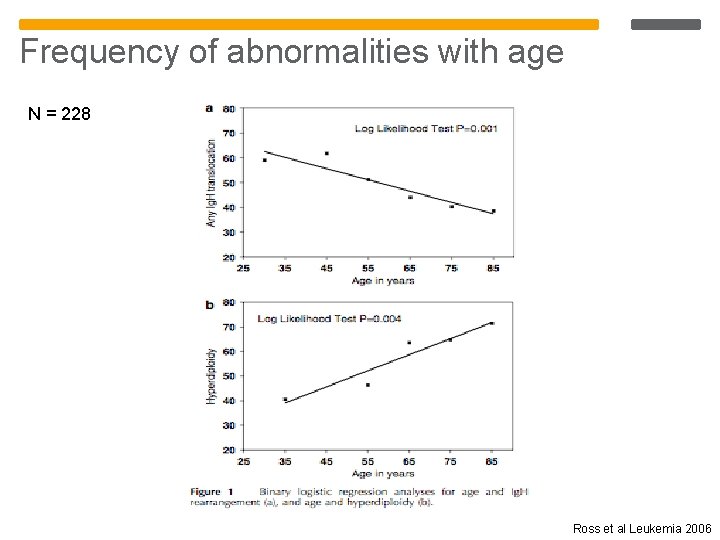
Frequency of abnormalities with age N = 228 Ross et al Leukemia 2006
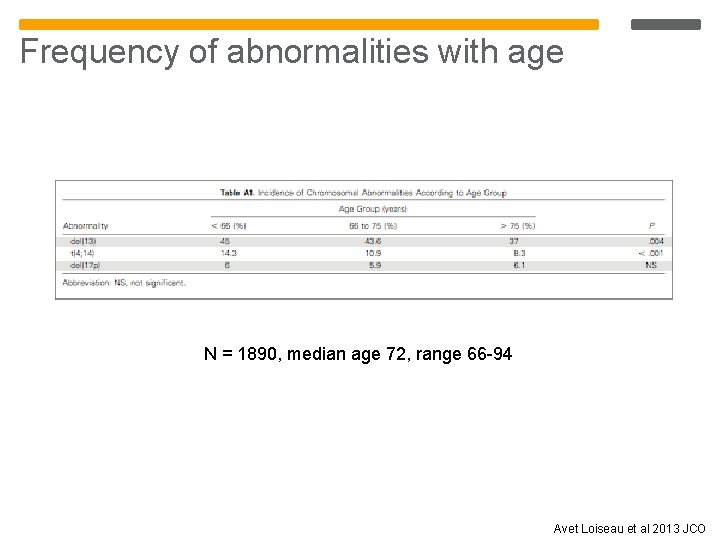
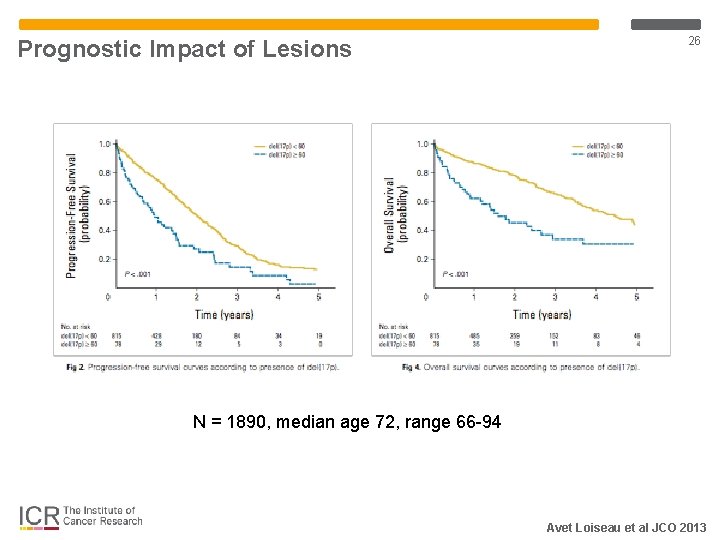
Frequency of abnormalities with age N = 1890, median age 72, range 66 -94 Avet Loiseau et al 2013 JCO
Clinical and prognostic significance in the Elderly
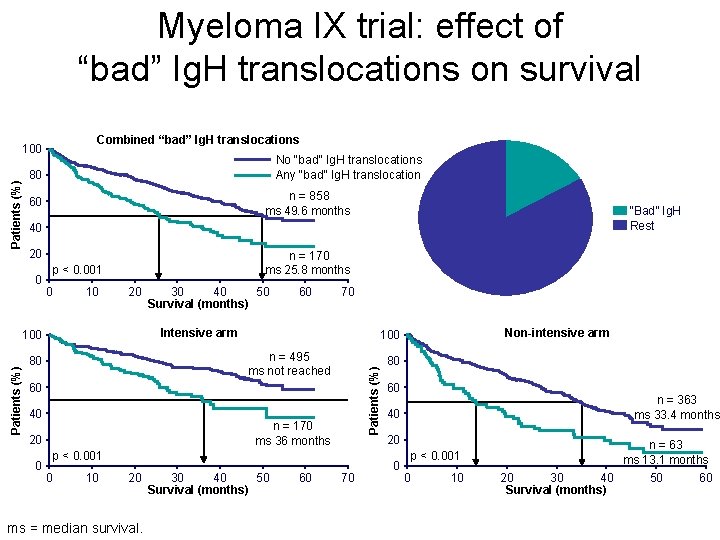
Myeloma IX trial: effect of “bad” Ig. H translocations on survival Combined “bad” Ig. H translocations No “bad” Ig. H translocations Any “bad” Ig. H translocation 80 n = 858 ms 49. 6 months 60 40 20 0 n = 170 ms 25. 8 months p < 0. 001 0 10 20 30 40 50 Survival (months) 60 70 Intensive arm 100 Patients (%) “Bad” Ig. H Rest n = 495 ms not reached 80 60 40 n = 170 ms 36 months 20 0 p < 0. 001 0 10 20 ms = median survival. Non-intensive arm 100 Patients (%) 100 30 40 50 Survival (months) 60 70 80 60 n = 363 ms 33. 4 months 40 20 0 n = 63 ms 13. 1 months p < 0. 001 0 10 20 30 40 Survival (months) 50 60
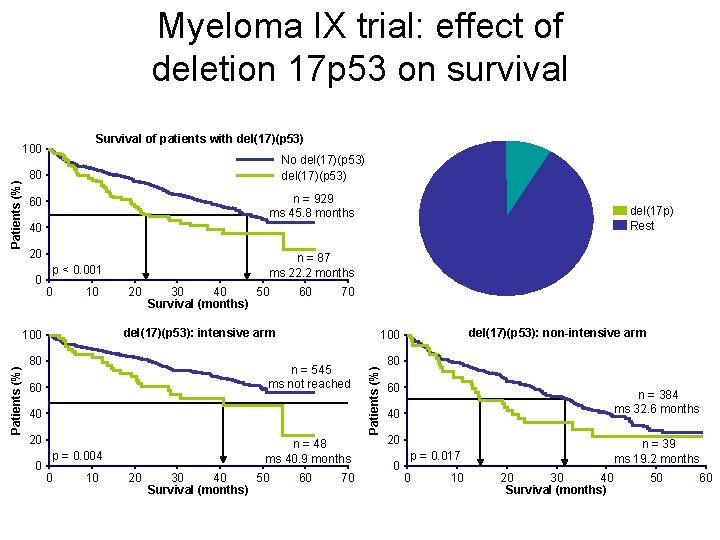
Myeloma IX trial: effect of deletion 17 p 53 on survival Survival of patients with del(17)(p 53) No del(17)(p 53) 80 n = 929 ms 45. 8 months 60 40 20 0 n = 87 ms 22. 2 months p < 0. 001 0 10 20 30 40 50 Survival (months) 60 70 del(17)(p 53): intensive arm 100 Patients (%) del(17 p) Rest 80 n = 545 ms not reached 60 40 20 0 n = 48 ms 40. 9 months p = 0. 004 0 10 20 30 40 50 Survival (months) del(17)(p 53): non-intensive arm 100 60 70 Patients (%) 100 80 60 n = 384 ms 32. 6 months 40 20 0 n = 39 ms 19. 2 months p = 0. 017 0 10 20 30 40 Survival (months) 50 60
Prognostic Impact of Lesions 26 N = 1890, median age 72, range 66 -94 Avet Loiseau et al JCO 2013
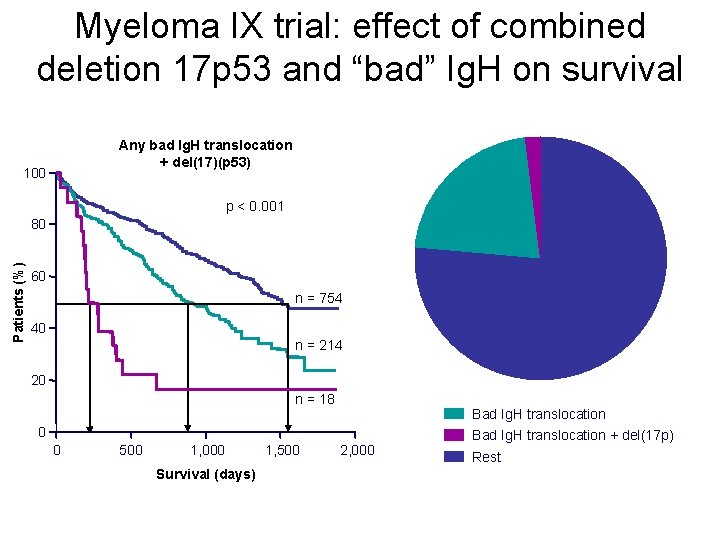
Myeloma IX trial: effect of combined deletion 17 p 53 and “bad” Ig. H on survival Any bad Ig. H translocation + del(17)(p 53) 100 p < 0. 001 Patients (%) 80 60 n = 754 40 n = 214 20 n = 18 Bad Ig. H translocation 0 0 500 1, 000 Survival (days) 1, 500 2, 000 Bad Ig. H translocation + del(17 p) Rest
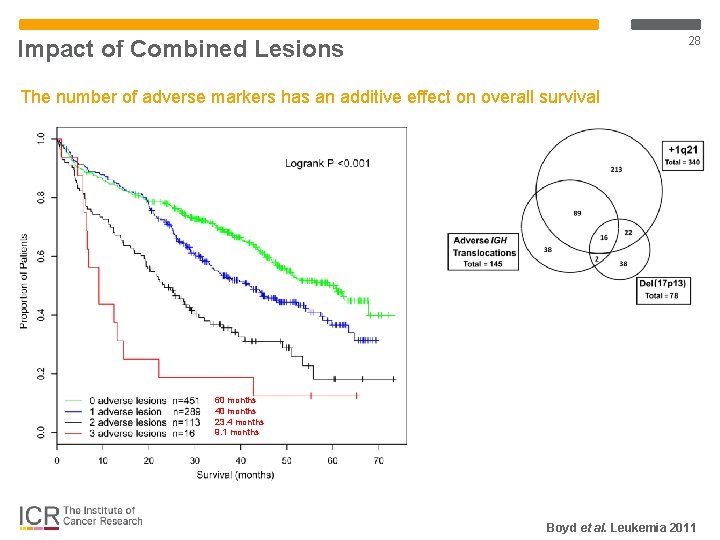
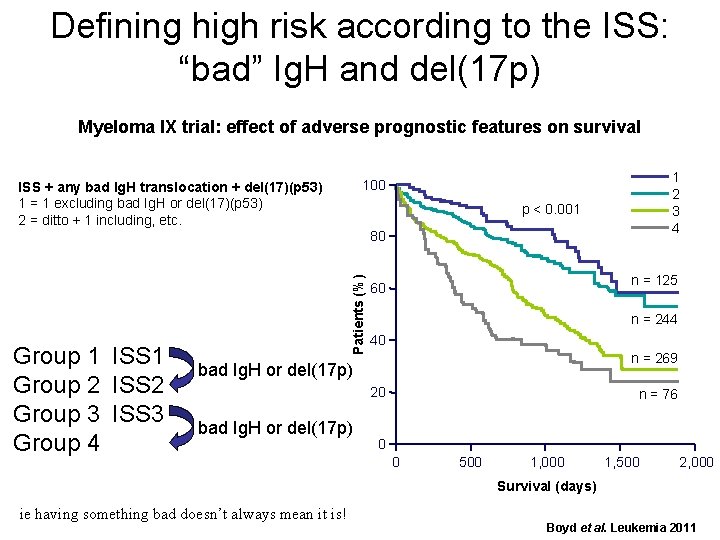
28 Impact of Combined Lesions The number of adverse markers has an additive effect on overall survival 60 months 40 months 23. 4 months 9. 1 months Boyd et al. Leukemia 2011
Defining high risk according to the ISS: “bad” Ig. H and del(17 p) Myeloma IX trial: effect of adverse prognostic features on survival 1 2 3 4 100 ISS + any bad Ig. H translocation + del(17)(p 53) 1 = 1 excluding bad Ig. H or del(17)(p 53) 2 = ditto + 1 including, etc. p < 0. 001 Group 1 ISS 1 Group 2 ISS 2 Group 3 ISS 3 Group 4 Patients (%) 80 n = 125 60 n = 244 40 n = 269 bad Ig. H or del(17 p) 20 bad Ig. H or del(17 p) n = 76 0 0 500 1, 000 1, 500 2, 000 Survival (days) ie having something bad doesn’t always mean it is! Boyd et al. Leukemia 2011
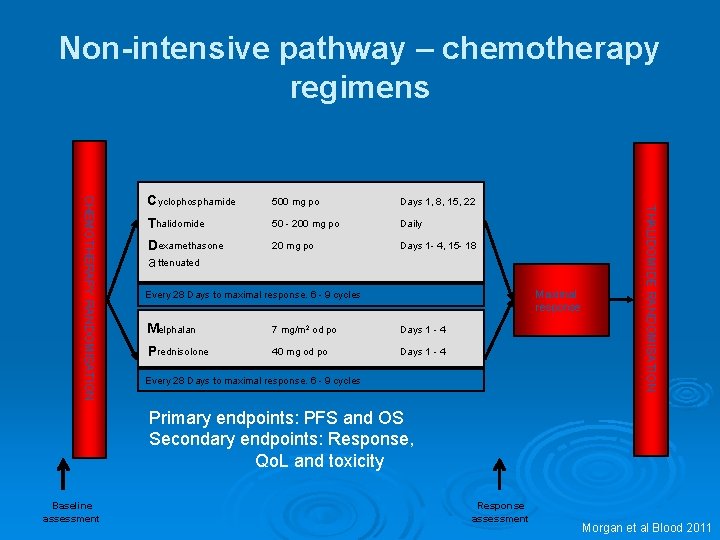
Non-intensive pathway – chemotherapy regimens 500 mg po Days 1, 8, 15, 22 Thalidomide 50 - 200 mg po Daily Dexamethasone a ttenuated 20 mg po Days 1 - 4, 15 - 18 Maximal response Every 28 Days to maximal response. 6 - 9 cycles Melphalan 7 mg/m 2 od po Days 1 - 4 Prednisolone 40 mg od po Days 1 - 4 Every 28 Days to maximal response. 6 - 9 cycles THALIDOMIDE RANDOMISATION CHEMOTHERAPY RANDOMISATION C yclophosphamide Primary endpoints: PFS and OS Secondary endpoints: Response, Qo. L and toxicity Baseline assessment Response assessment Morgan et al Blood 2011
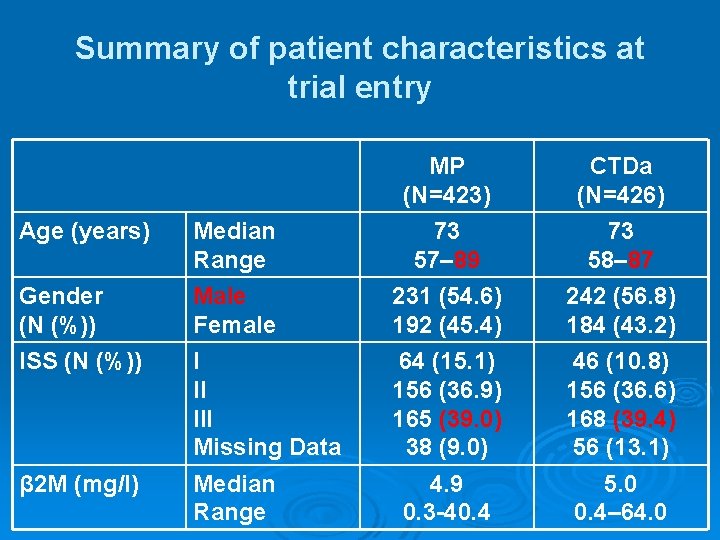
Summary of patient characteristics at trial entry MP (N=423) CTDa (N=426) Age (years) Median Range 73 57– 89 73 58– 87 Gender (N (%)) Male Female 231 (54. 6) 192 (45. 4) 242 (56. 8) 184 (43. 2) ISS (N (%)) I II III Missing Data 64 (15. 1) 156 (36. 9) 165 (39. 0) 38 (9. 0) 46 (10. 8) 156 (36. 6) 168 (39. 4) 56 (13. 1) β 2 M (mg/l) Median Range 4. 9 0. 3 -40. 4 5. 0 0. 4– 64. 0
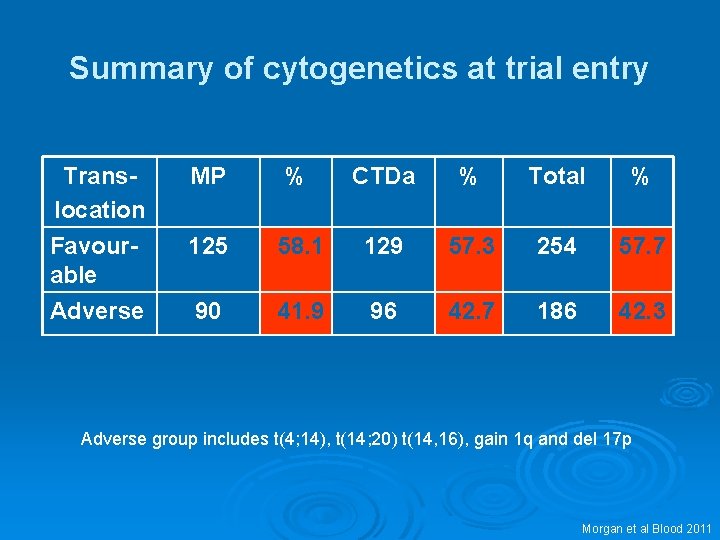
Summary of cytogenetics at trial entry Translocation Favourable Adverse MP % CTDa % Total % 125 58. 1 129 57. 3 254 57. 7 90 41. 9 96 42. 7 186 42. 3 Adverse group includes t(4; 14), t(14; 20) t(14, 16), gain 1 q and del 17 p Morgan et al Blood 2011
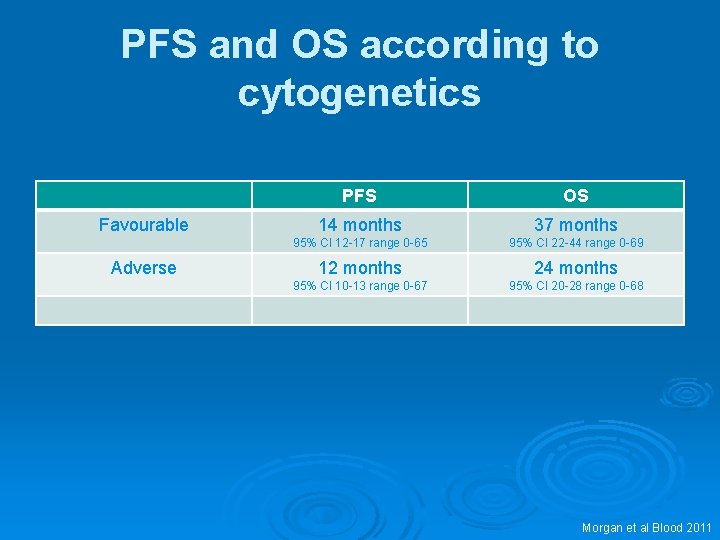
PFS and OS according to cytogenetics Favourable Adverse PFS OS 14 months 37 months 95% CI 12 -17 range 0 -65 95% CI 22 -44 range 0 -69 12 months 24 months 95% CI 10 -13 range 0 -67 95% CI 20 -28 range 0 -68 Morgan et al Blood 2011
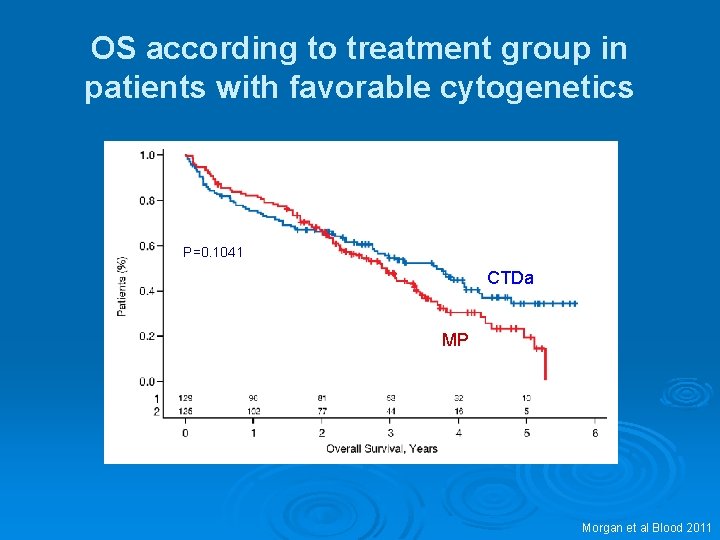
OS according to treatment group in patients with favorable cytogenetics P=0. 1041 CTDa MP Morgan et al Blood 2011
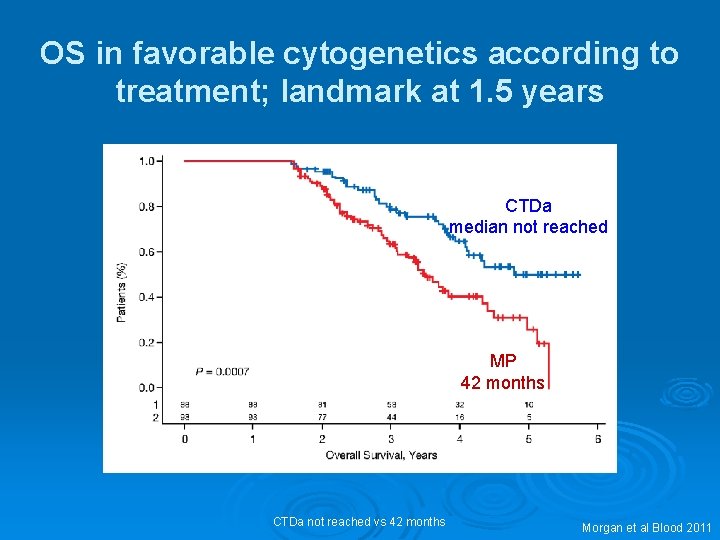
OS in favorable cytogenetics according to treatment; landmark at 1. 5 years CTDa median not reached MP 42 months CTDa not reached vs 42 months Morgan et al Blood 2011
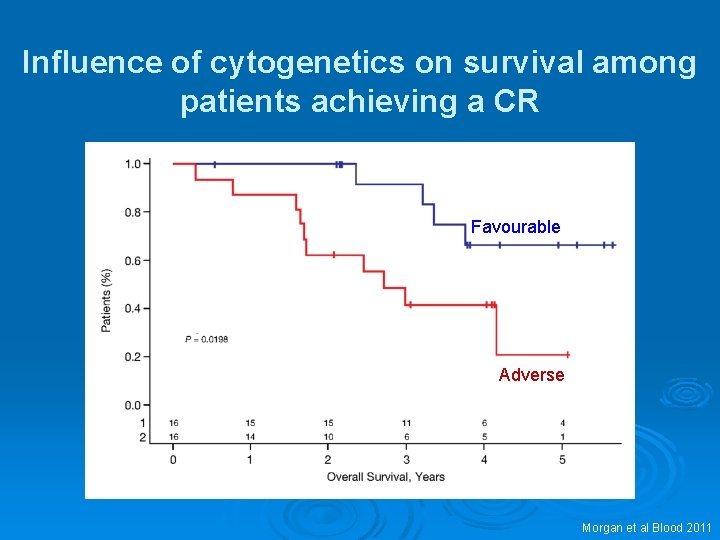
Influence of cytogenetics on survival among patients achieving a CR Favourable Adverse Morgan et al Blood 2011
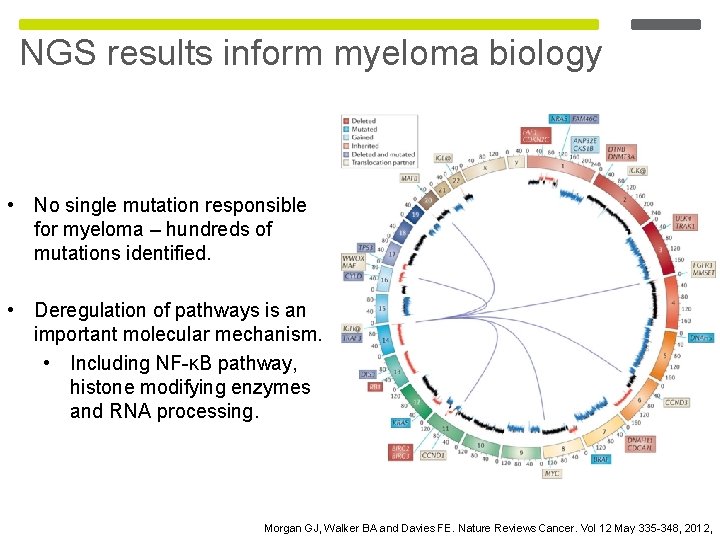
NGS results inform myeloma biology • No single mutation responsible for myeloma – hundreds of mutations identified. • Deregulation of pathways is an important molecular mechanism. • Including NF-κB pathway, histone modifying enzymes and RNA processing. Morgan GJ, Walker BA and Davies FE. Nature Reviews Cancer. Vol 12 May 335 -348, 2012,
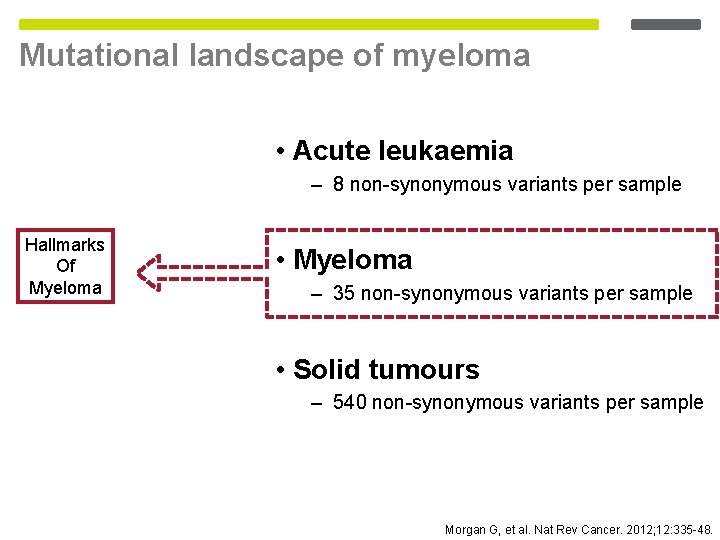
Mutational landscape of myeloma • Acute leukaemia – 8 non-synonymous variants per sample Hallmarks Of Myeloma • Myeloma – 35 non-synonymous variants per sample • Solid tumours – 540 non-synonymous variants per sample Morgan G, et al. Nat Rev Cancer. 2012; 12: 335 -48.
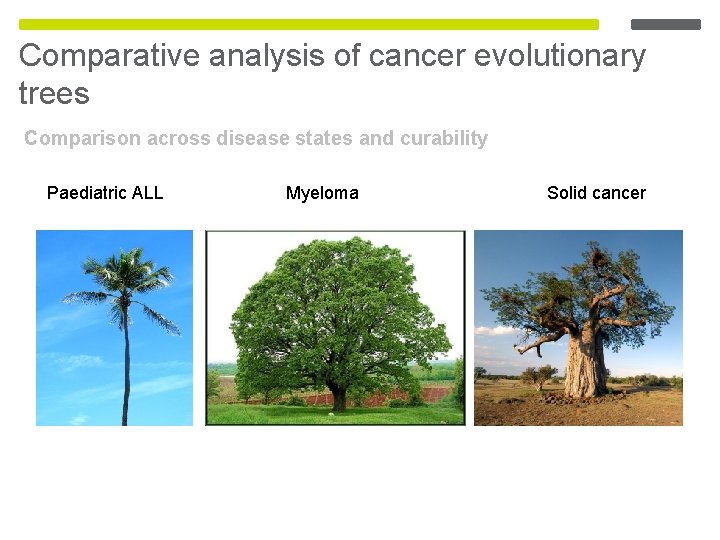
Comparative analysis of cancer evolutionary trees Comparison across disease states and curability Paediatric ALL Myeloma Solid cancer
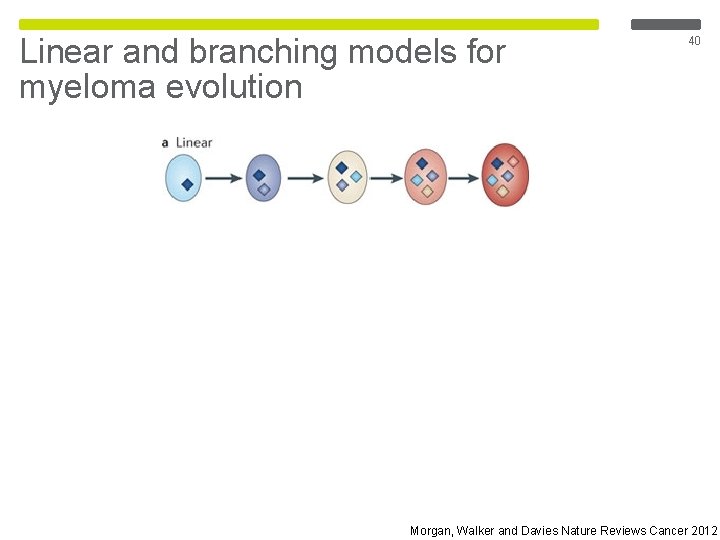
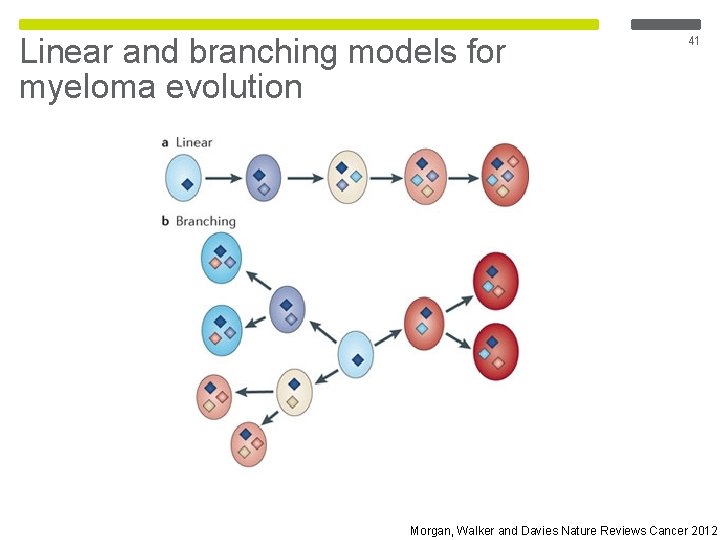
Linear and branching models for myeloma evolution 40 Morgan, Walker and Davies Nature Reviews Cancer 2012
Linear and branching models for myeloma evolution 41 Morgan, Walker and Davies Nature Reviews Cancer 2012
“Nothing in biology makes sense except in the light of evolution” Theodosius Dobzhansky, 1973
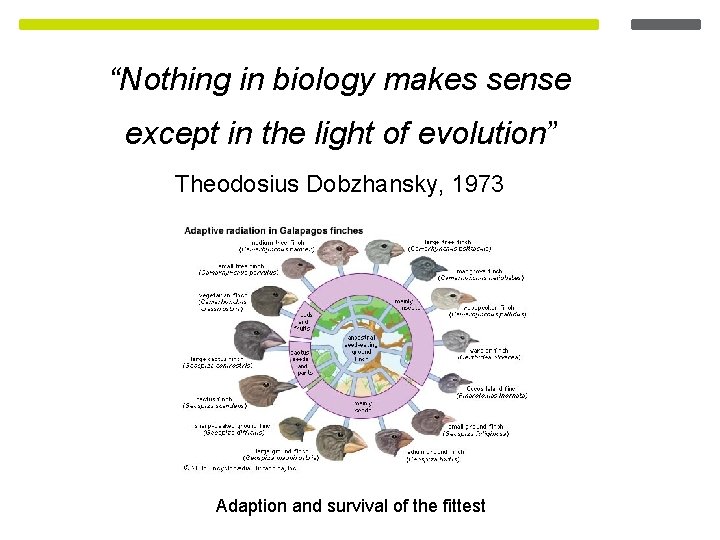
“Nothing in biology makes sense except in the light of evolution” Theodosius Dobzhansky, 1973 Adaption and survival of the fittest
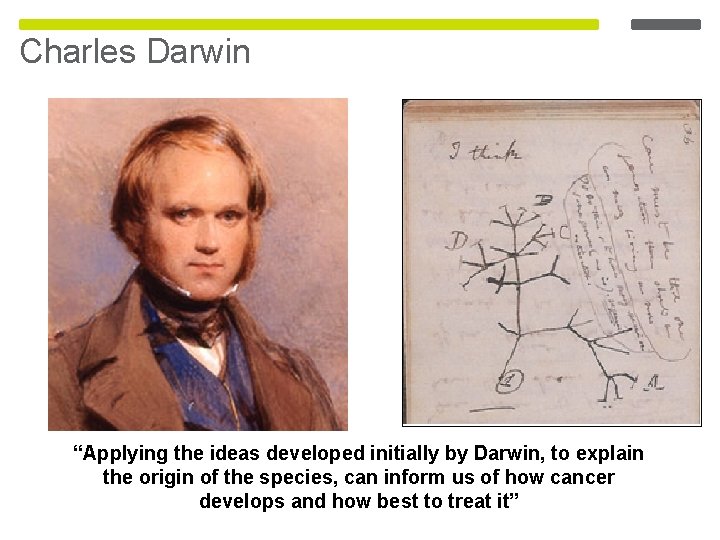
Charles Darwin “Applying the ideas developed initially by Darwin, to explain the origin of the species, can inform us of how cancer develops and how best to treat it”
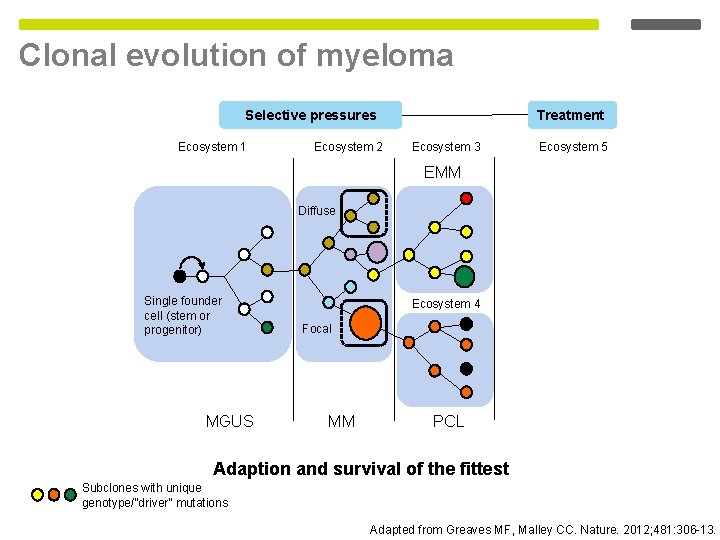
Clonal evolution of myeloma Selective pressures Ecosystem 1 Ecosystem 2 Treatment Ecosystem 3 Ecosystem 5 EMM Diffuse Single founder cell (stem or progenitor) MGUS Ecosystem 4 Focal MM PCL Adaption and survival of the fittest Subclones with unique genotype/”driver” mutations Adapted from Greaves MF, Malley CC. Nature. 2012; 481: 306 -13.
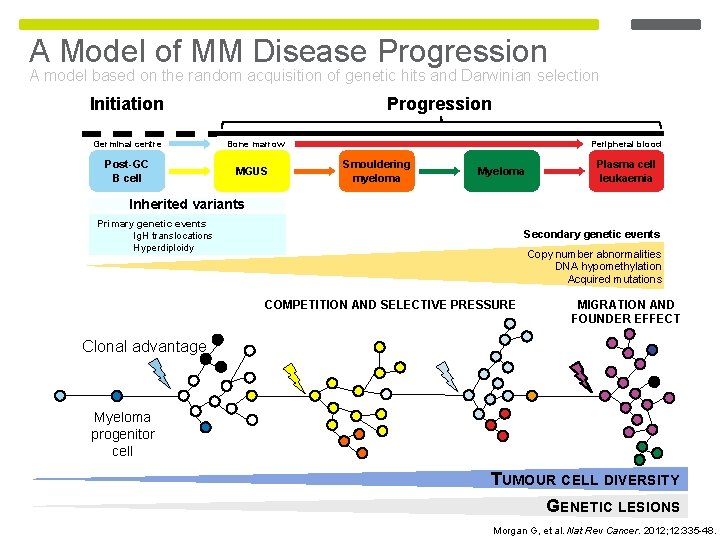
A Model of MM Disease Progression A model based on the random acquisition of genetic hits and Darwinian selection Initiation Germinal centre Post-GC B cell Progression Bone marrow MGUS Peripheral blood Smouldering myeloma Myeloma Plasma cell leukaemia Inherited variants Primary genetic events Ig. H translocations Hyperdiploidy Secondary genetic events Copy number abnormalities DNA hypomethylation Acquired mutations COMPETITION AND SELECTIVE PRESSURE MIGRATION AND FOUNDER EFFECT Clonal advantage Myeloma progenitor cell TUMOUR CELL DIVERSITY GENETIC LESIONS Morgan G, et al. Nat Rev Cancer. 2012; 12: 335 -48.
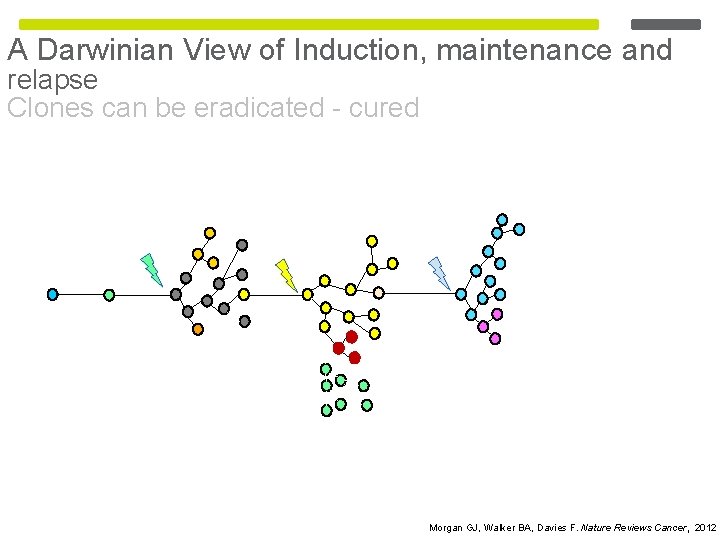
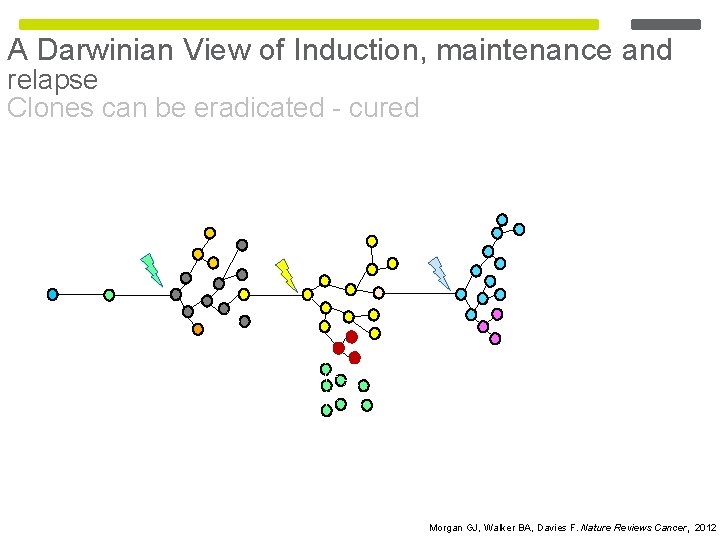
A Darwinian View of Induction, maintenance and relapse Clones can be eradicated - cured Morgan GJ, Walker BA, Davies F. Nature Reviews Cancer, 2012
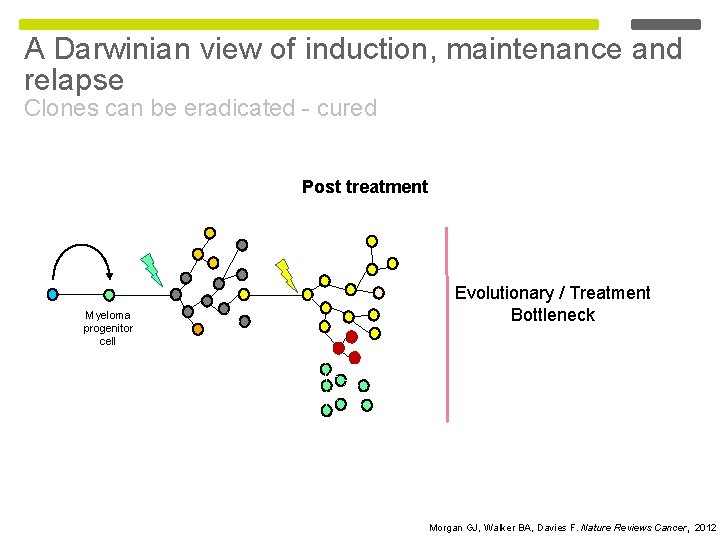
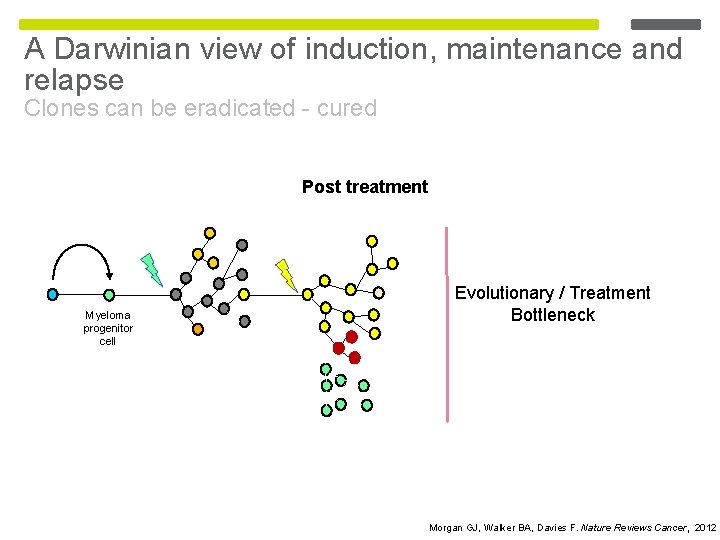
A Darwinian view of induction, maintenance and relapse Clones can be eradicated - cured Post treatment Myeloma progenitor cell Evolutionary / Treatment Bottleneck Morgan GJ, Walker BA, Davies F. Nature Reviews Cancer, 2012
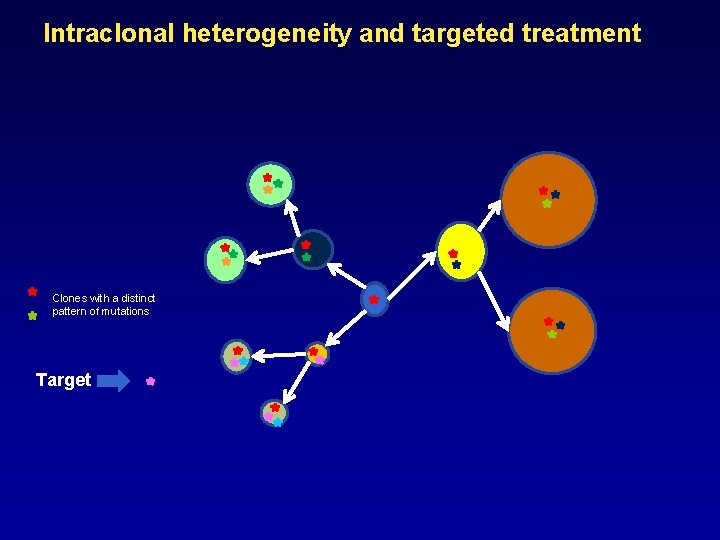
Intraclonal heterogeneity and targeted treatment Clones with a distinct pattern of mutations Target
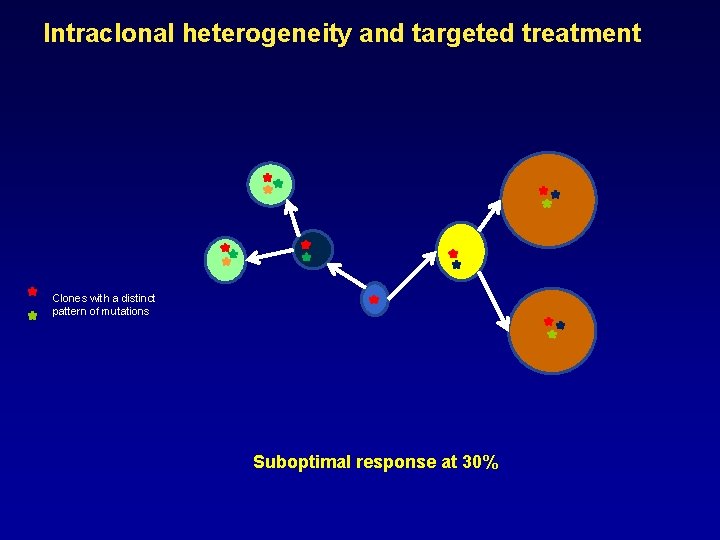
Intraclonal heterogeneity and targeted treatment Clones with a distinct pattern of mutations Suboptimal response at 30%
A Darwinian View of Induction, maintenance and relapse Clones can be eradicated - cured Morgan GJ, Walker BA, Davies F. Nature Reviews Cancer, 2012
A Darwinian view of induction, maintenance and relapse Clones can be eradicated - cured Post treatment Myeloma progenitor cell Evolutionary / Treatment Bottleneck Morgan GJ, Walker BA, Davies F. Nature Reviews Cancer, 2012
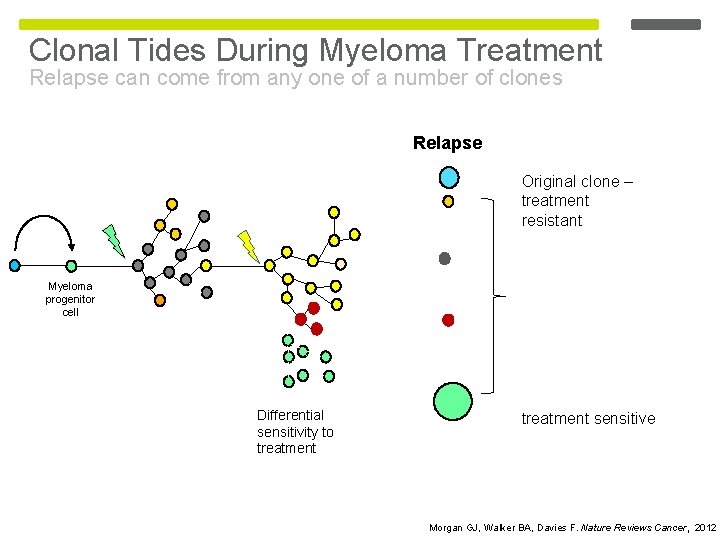
Clonal Tides During Myeloma Treatment Relapse can come from any one of a number of clones Relapse Original clone – treatment resistant Myeloma progenitor cell Differential sensitivity to treatment sensitive Morgan GJ, Walker BA, Davies F. Nature Reviews Cancer, 2012
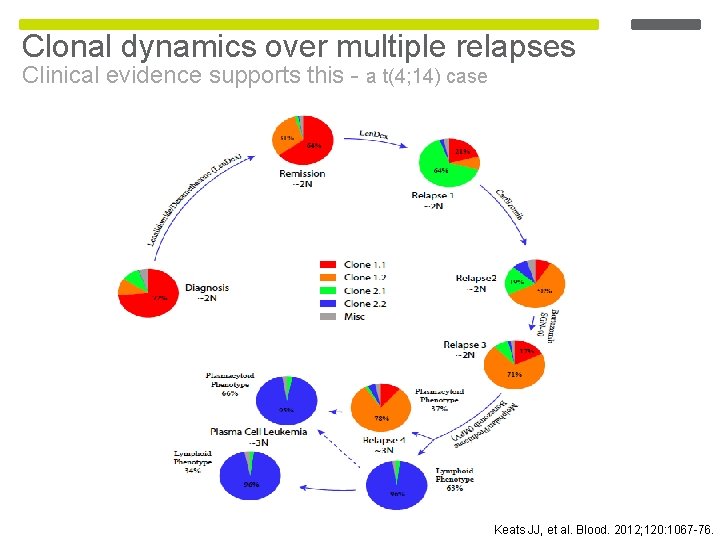
Clonal dynamics over multiple relapses Clinical evidence supports this - a t(4; 14) case Keats JJ, et al. Blood. 2012; 120: 1067 -76.
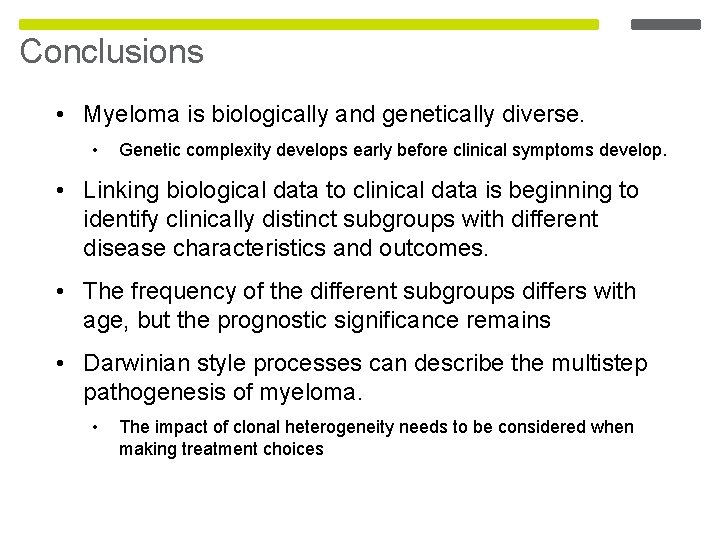
Conclusions • Myeloma is biologically and genetically diverse. • Genetic complexity develops early before clinical symptoms develop. • Linking biological data to clinical data is beginning to identify clinically distinct subgroups with different disease characteristics and outcomes. • The frequency of the different subgroups differs with age, but the prognostic significance remains • Darwinian style processes can describe the multistep pathogenesis of myeloma. • The impact of clonal heterogeneity needs to be considered when making treatment choices
Conclusion • Knowledge of the patients genetic sub group is important regardless of the patients age • This has been incorporated into the UKMF/BCSH guidelines • C 14 translocation, 17 p, HRD, C 1
in partnership with Centre for Myeloma Research, ICR Davies Lab Mike Bright Chief Investigators Lei Zhang JA Child Lauren Aronson GJ Morgan Jade Strover GH Jackson Jackie Fok Daniel Izthak NH Russell Morgan Lab Brian Walker Chris Wardell David Johnson Li Ni David Gonzalez Ping Wu Fabio Mirabella Lorenzo Melchor Anna. Maria Brioli Charlotte Pawlyn Elileen Boyle Matthew Jenner Kevin Boyd Martin Kaiser CTRU, Leeds K Cocks W Gregory A Szubert S Bell N Navarro Coy F Heatley P Best J Carder M Matouk D Emsell A Davies D Phillips Leeds RG Owen AC Rawstron R de Tute M Dewar S Denman G Cook S Feyler MRC Leukaemia Trial Steering Committee MRC Leukaemia Data Monitoring and Ethics Committee NCRI Haematological Oncology Clinical Studies Group UK Myeloma Forum Clinical Trials Committee Myeloma UK D Bowen Birmingham MT Drayson K Walker A Adkins N Newnham Salisbury F Ross L Chieccio Funding Medical Research Council Pharmion Novartis Chugai Pharma Bayer Schering Pharma Ortho. Biotech Celgene Kay Kendall Leukaemia Fund