In GWB 10 and earlier certain plots displayed

In GWB 10 and earlier, certain plots displayed multiple samples together, but others only displayed one at a time. Multi-sample plots included XY, Series, Time Series, Ternary, Piper, and Durov diagrams. Single-sample plots included Schoeller, Stiff, Radial, Bar charts, and Pie charts.

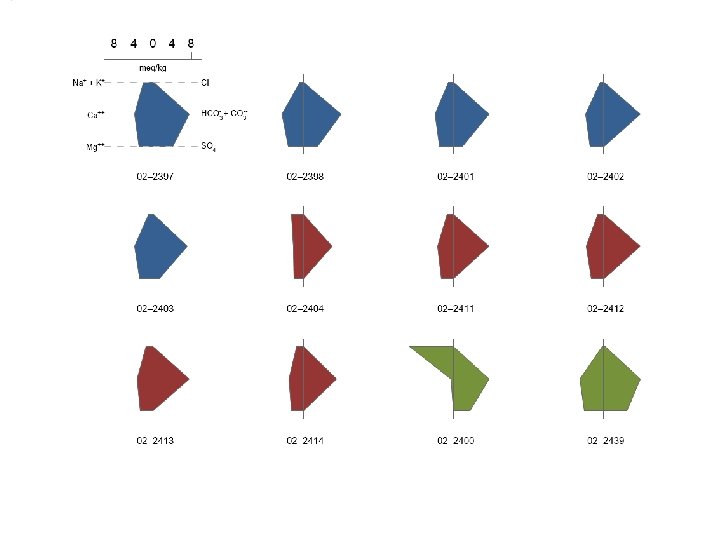
XY, Series, Time Series, Ternary, Piper, and Durov diagrams plot multiple markers together. New in GWB 11 and beyond, any special plot can plot multiple samples. Stiff, Radial, Bar charts, and Pie charts plot side-by-side. Schoeller diagram plots multiple lines together.

You control which samples are displayed from the Samples pane of that plot’s Configuration Dialog. Only selected samples in the Available list plot. You can cycle through samples one at a time. Plot all samples together.

For certain plots, you might want to plot only a subset, or Block, of samples at a time. Choose number of samples to display when cycling through Blocks You can set Blocks for Schoeller, Stiff, Radial, Bar charts, and Pie charts.

You can quickly cycle from one Block of samples to the next. Use Block, Next block to cycle through groups of samples. You set the number in the group on the Plot pane.

Turn auto-scale on or off Choose to label axes on first plot, all plots, or no plots. When plotting samples side-by-side, you can label the first, all, or none of the plots. All plots labeled.
- Slides: 7