Improving students PPDAC responses Sophie Wright MRGS 2016


 L 1 Literacy L 1 Numeracy 2011 2015")


")


")


 framework")


- Slides: 49
Improving student’s PPDAC responses Sophie Wright MRGS 2016
Strategies, Tools and Prompts to support Statistical Report writing. Looking Roskill’s tool box of ideas, and examples, that show ways to lift the quality of student written responses. Revisit some well-tested strategies and frameworks. Explore how collaboration, technology and google apps can also lift the quality of student PPDAC reports. It would be great to see ideas from other schools and share good practice.
Who is Roskill? 70% of students have English as a Second Language students Very high migrant and refugee population, with parents typically not speaking English well. 60 + nationalities represented Decile 4 2013 – Focus on Literacy Strategies across all curriculum areas.
Challenge • • • Students reluctant to write Quality of writing was poor Students were not using statistical vocabulary Students did not justify statements Students did not link to context Our challenge: School wide goal for writing strategies that would work across departments
What happened at Roskill? (Roll based) L 1 Literacy L 1 Numeracy 2011 2015 All Year 11 s 82. 2% 91. 8% 94. 4% 94. 8% Maori 81. 4% 95. 4% 81. 5% 95. 5% Pasifika 79. 8% 90. 7% 85. 9% 92. 8% (Roll based) Y 11’s with Level 1 Year 12’s with Level 2 Year 13 s with Level 3 2011 2015 All students 61. 0% 79. 0% 62. 9% 75. 2% 54. 9% 60. 7% Maori 22. 2% 76. 0% 39. 1% 63. 6% 33. 3% 40. 9% Pasifika 18. 4% 79. 6% 29. 8% 72. 3% 26. 0% 40. 5%
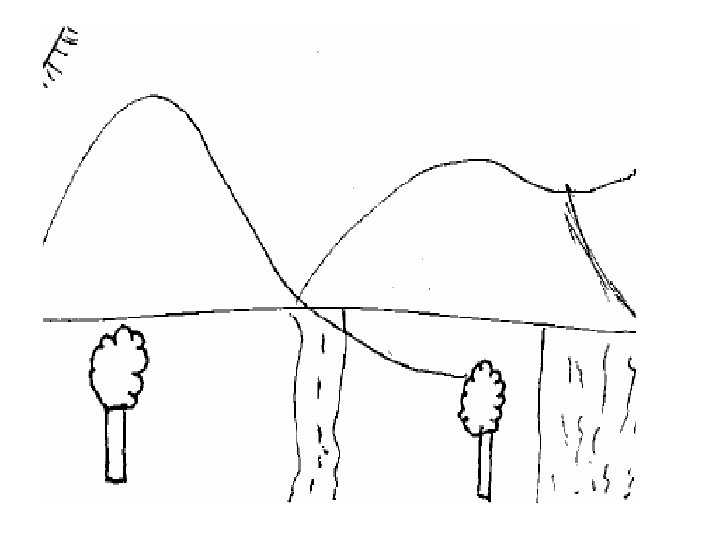
Task 1: Draw this picture … from a student’s description A mountainside overlooking a coastline with golden sand two oak trees with a road running in between the trees, continuing to run towards the two vast mountains. The sun is overlooking the scene.
A mountainside overlooking a coastline with golden sand two oak trees with a road running in between the trees, continuing to run towards the two vast mountains. The sun is overlooking the scene. There is a sun rising on the right corner. There is a motorway on the middle of the picture and there a large number of high mountains on the back. There is a river flowing in the front of the motorway
Task 2: Statistical graphs How well do we describe them? Working in pairs: You will each get a graph. In the box below, write down what you see. Once written description is complete, fold over the graph, so your partner can not see it. • Swap papers – draw the graph, based on your partner’s description • •
Discuss Does the second graph tell a similar story to the first graph? What helped you draw a good graph? What extra detail would have helped? How well do your students understand talk about statistical displays? What prompts would help them?
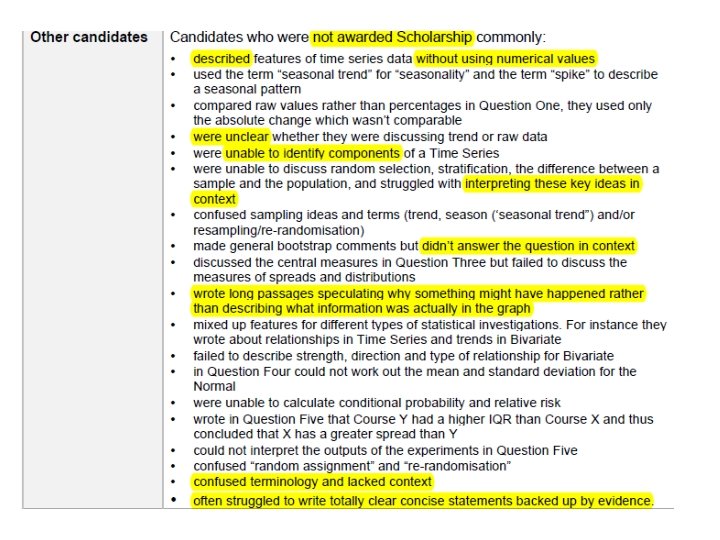
Scholarship Statistics Example - Excerpt from 2015 Report
Writing Strategy - PEEL
Inference Analysis What might this look like?
PPDAC Writing Strategy Investigation Types Frameworks PEEL Inference DISCUSS Bivariate Time Series TASGU Trend Seasonality Variation Experiments
Why Frameworks • Want to prompt thinking – connections for the different PPDAC investigations. • For example Level 1 Revision Graphic >>
PPDAC Writing Strategy Investigation Types Frameworks PEEL Inference DISCUSS Bivariate TASGU Time Series Trend Seasonality Variation Experiments (in progress)
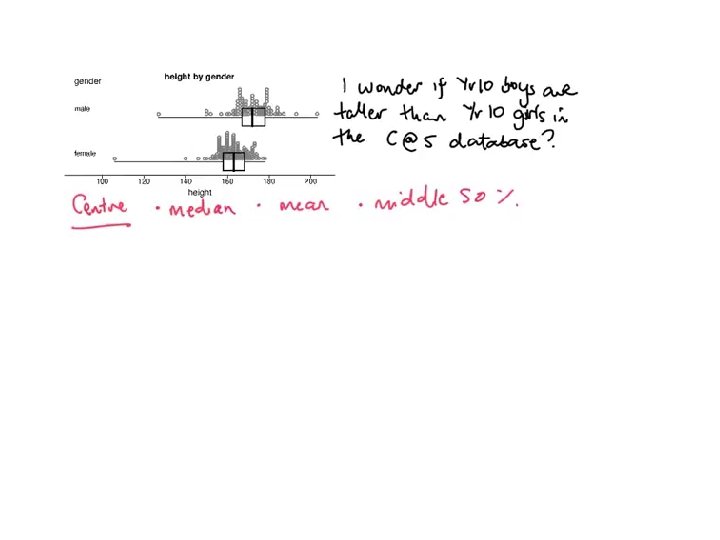
Posing a Statistical Question Variable Two Groups Comparing Word Population Easy to adapt for different levels and types of investigations
DISCUSS (adapted from Nayland Maths)
Inference Conclusion POINT: I can / cannot make a claim that for the population of ________ that _________. EVIDENCE: because ________ LINK: If I was to take another sample I would expect ……….
Year 9
Year 9
PPDAC Writing Strategy Investigation Types Frameworks PEEL Inference DISCUSS Bivariate TASGU Time Series Trend Seasonality Variation Experiments (in progress)
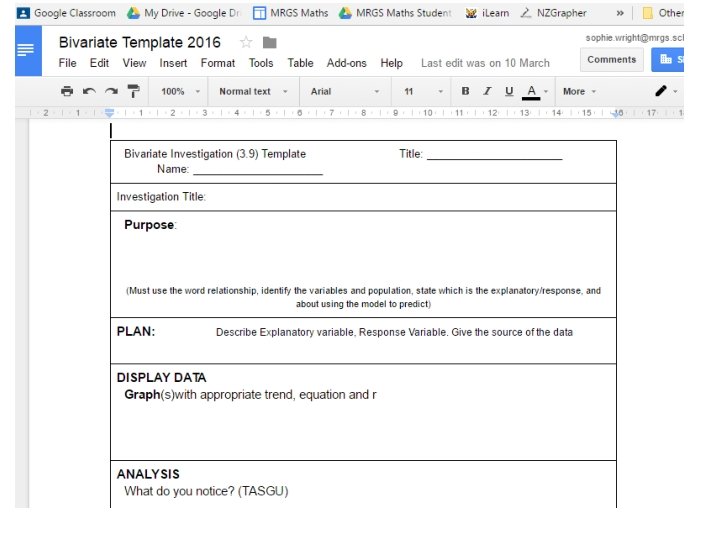
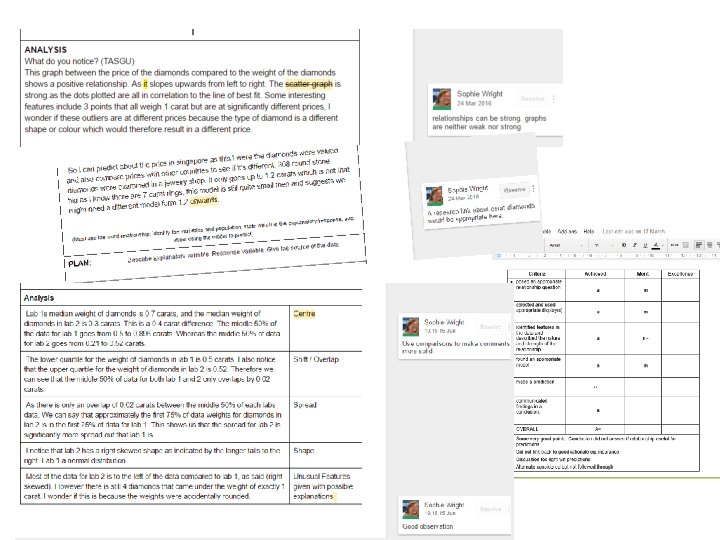
Bivariate Analysis – TASGU (C@S)
Bivariate Checklist f o t o A l … t x te
PPDAC Writing Strategy Investigation Types Frameworks PEEL Inference DISCUSS Bivariate TASGU Time Series Trend Seasonality Variation Experiments
Time Series Framework – all levels Trend – Seasonality - Variation
Deeper Analysis FORECASTS ANALYSIS PROBLEM PURPOSE TIME SERIES ACHIEVEMENT OUTLINE Identify and discuss chosen variable of interest Why would someone investigate these changes over time? What could be possible impacts if this trend were to change? Evidence of research into the context given. Features of the data Trend (Rate of Change) Describe general trend Gradient (direction and slope) Quantify trend Variability between highs and lows Seasonality State Average Seasonal Effects Give appropriate reasons for these patterns Give forecast (Holt Winters Forecast) in context with interpretation of prediction intervals. Round appropriately, with units. Fit of the model Residuals Reliability of forecasts Variation in Seasonal Effects Changes in Trend Remove last 3 values to test model Compare same variable for different context Investigate a different variable that may have an effect on your initial choice of variable. . Question you will investigate Trend (Rate of change) Identify interesting features or patterns Possible comparison to another variable. Unusual Features State time period and values for peaks and troughs Give appropriate reasons for these unusual values Residuals Will help to identify peaks / troughs Usefulness and Relevance of Forecasts Who would use this How would they use this information BE SPECIFIC and must be in CONTEXT Improvements to the model Discuss similarities and differences in trends, patterns and other features
f o t o A l … t x te
PPDAC Writing Strategy Investigation Types Frameworks PEEL Inference DISCUSS Bivariate TASGU Statistical Reports (1. 12, 2. 11, 3. 12) Time Series Trend Seasonality Variation Experiments (in progress)
Introduction Title – Adapted from TKI for AS 2. 11 Source of statistically based report – Summary of the report – A one paragraph summary of the statistically based report, including the purpose of report and identification of the population of interest. POINT / Explanation Comments/Evaluation Explanation Evidence 1 2 3 Purpose of the Report Population A description of measures and variables representations. 4 A description of sampling method(s). 5 A description of survey method(s). 6 A description of the sample size. 7 Discussion of the sampling error. 8 A description/discussion of possible non-sampling errors or bias Link(s) 9 Description of how results are presented: tables/ graphics and their effectiveness 10 An evaluation of the findings of the survey. An overall evaluation of the effectiveness of the statistically based report.
3. 12 Stats Reports (Observational study) framework
Reflections 3 teachers 3 inquiries 10 MATA – 1. 10 Inferences Did the 2013 10 MATA class writing improve with the use of PEEL and DISCUSS writing frameworks compared to my 2012 10 MATA class? 10 MATC – 1. 10 Inferences What I tried: Using PEEL as a writing strategy and DISCUSS as a writing framework to support 1004 and improve written responses for AS 1. 10 PPDAC investigation. (Explicit teaching of writing strategy PEEL. ) Level 2 - 2. 9 Inferences I will select 4 students with different abilities from my 12 MAT class. I will track their work before, during and after the topic (assessment). Most of these students struggle to construct a logical and sequential approach to answering a question. I wonder whether using PEEL writing framework makes a difference in the actual assessment.
Examples of student work Able student s e c en 0 A 10 T A M . 1 1 – r e f In
s e c n re 10 TA A M fe n I 10. 1 –
Teacher Reflections – 10 MAT A I believe the DISCUSS and PEEL frameworks have overall definitely improved the quality of the writing and allowed less able students to attain Excellence. What worked: Reluctant Writers - this was initially a big problem, especially with ESOL and boys in general. Marking regularly, encouraging more and asking to practice, “I wonder if this is because …” after every “I notice …” definitely helped. Also our Mantra was “Be in the context” (seemed to help with explanations) What next: Still problems with the population. Will need to emphasize this even more next year and make them reflect on their population es c n e er f before they start writing ! n I 0 10 M 1. 1 – A AT
10 MATC – 1. 10 Inferences
C-Band - once a reluctant writer 10 MATC – 1. 10 Inferences
Teacher Reflections – 10 MAT C Last year This year Overall, comments lacked coverage. Overall, huge increase in quality and quantity of writing in investigation P – point was often unclear or not stated E – explanation non-existent, or without context, and lacking comparisons E – evidence – sometimes words, but rarely used values with units and context L – no linking back to the problem/population P – point clear using DISCUSS headings. E – comparisons made, context used by most students E – values quoted as evidence. Sometimes lacking units though L – some contextual reasoning evident 58% Achieved, 42% Not Achieved in cohort 71% Achieved, 29% Not Achieved in class What next: Linking back to the population was still not done well. PEEL evident in analysis but lacking in the conclusion of PPDAC investigation. 10 MATC – 1. 10 Inferences
L 2 Inferences Inquiry - Teaching strategies trialled: Templates with model answers and worksheets were given. Practise test were given before the actual assessment. Giving feedback that ‘constructs the way forward’ Differentiating the class to focus on small groups Use structure of ‘PEEL’ (Easy to understand follow) Provide writing templates and modal answers Collect student voice (feedback) specific to their learning which informs my teaching practice Results • • • A strategy that is really working well. For a 12 MAT 2 A class this assessment (AS 2. 9 Statistical Inference) was really well done. 26 students Achieved with Excellence, 6 students Achieved with Merit (100% pass rate). Accelerated progress for 3 focus students. 1. 10 Achieved to 2. 9 Merit x 1 1. 10 Merit to 2. 9 Excellence x 2 fe n I L 2 r s e c en
s fe n I L 2 ce n e r
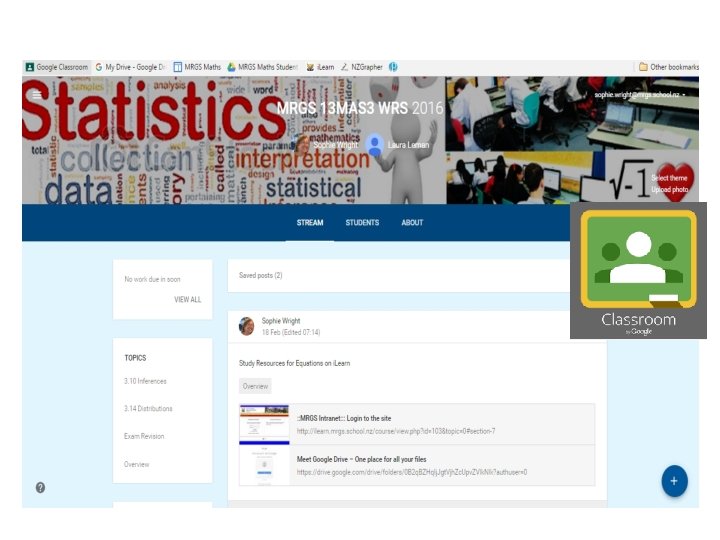
Next steps – using Google tools to support and develop PEEL writing
Assignments
What are your experiences? What has worked with your learners? Comments ….