Improving Remote Access of a DataIntensive Computing Application
- Slides: 1
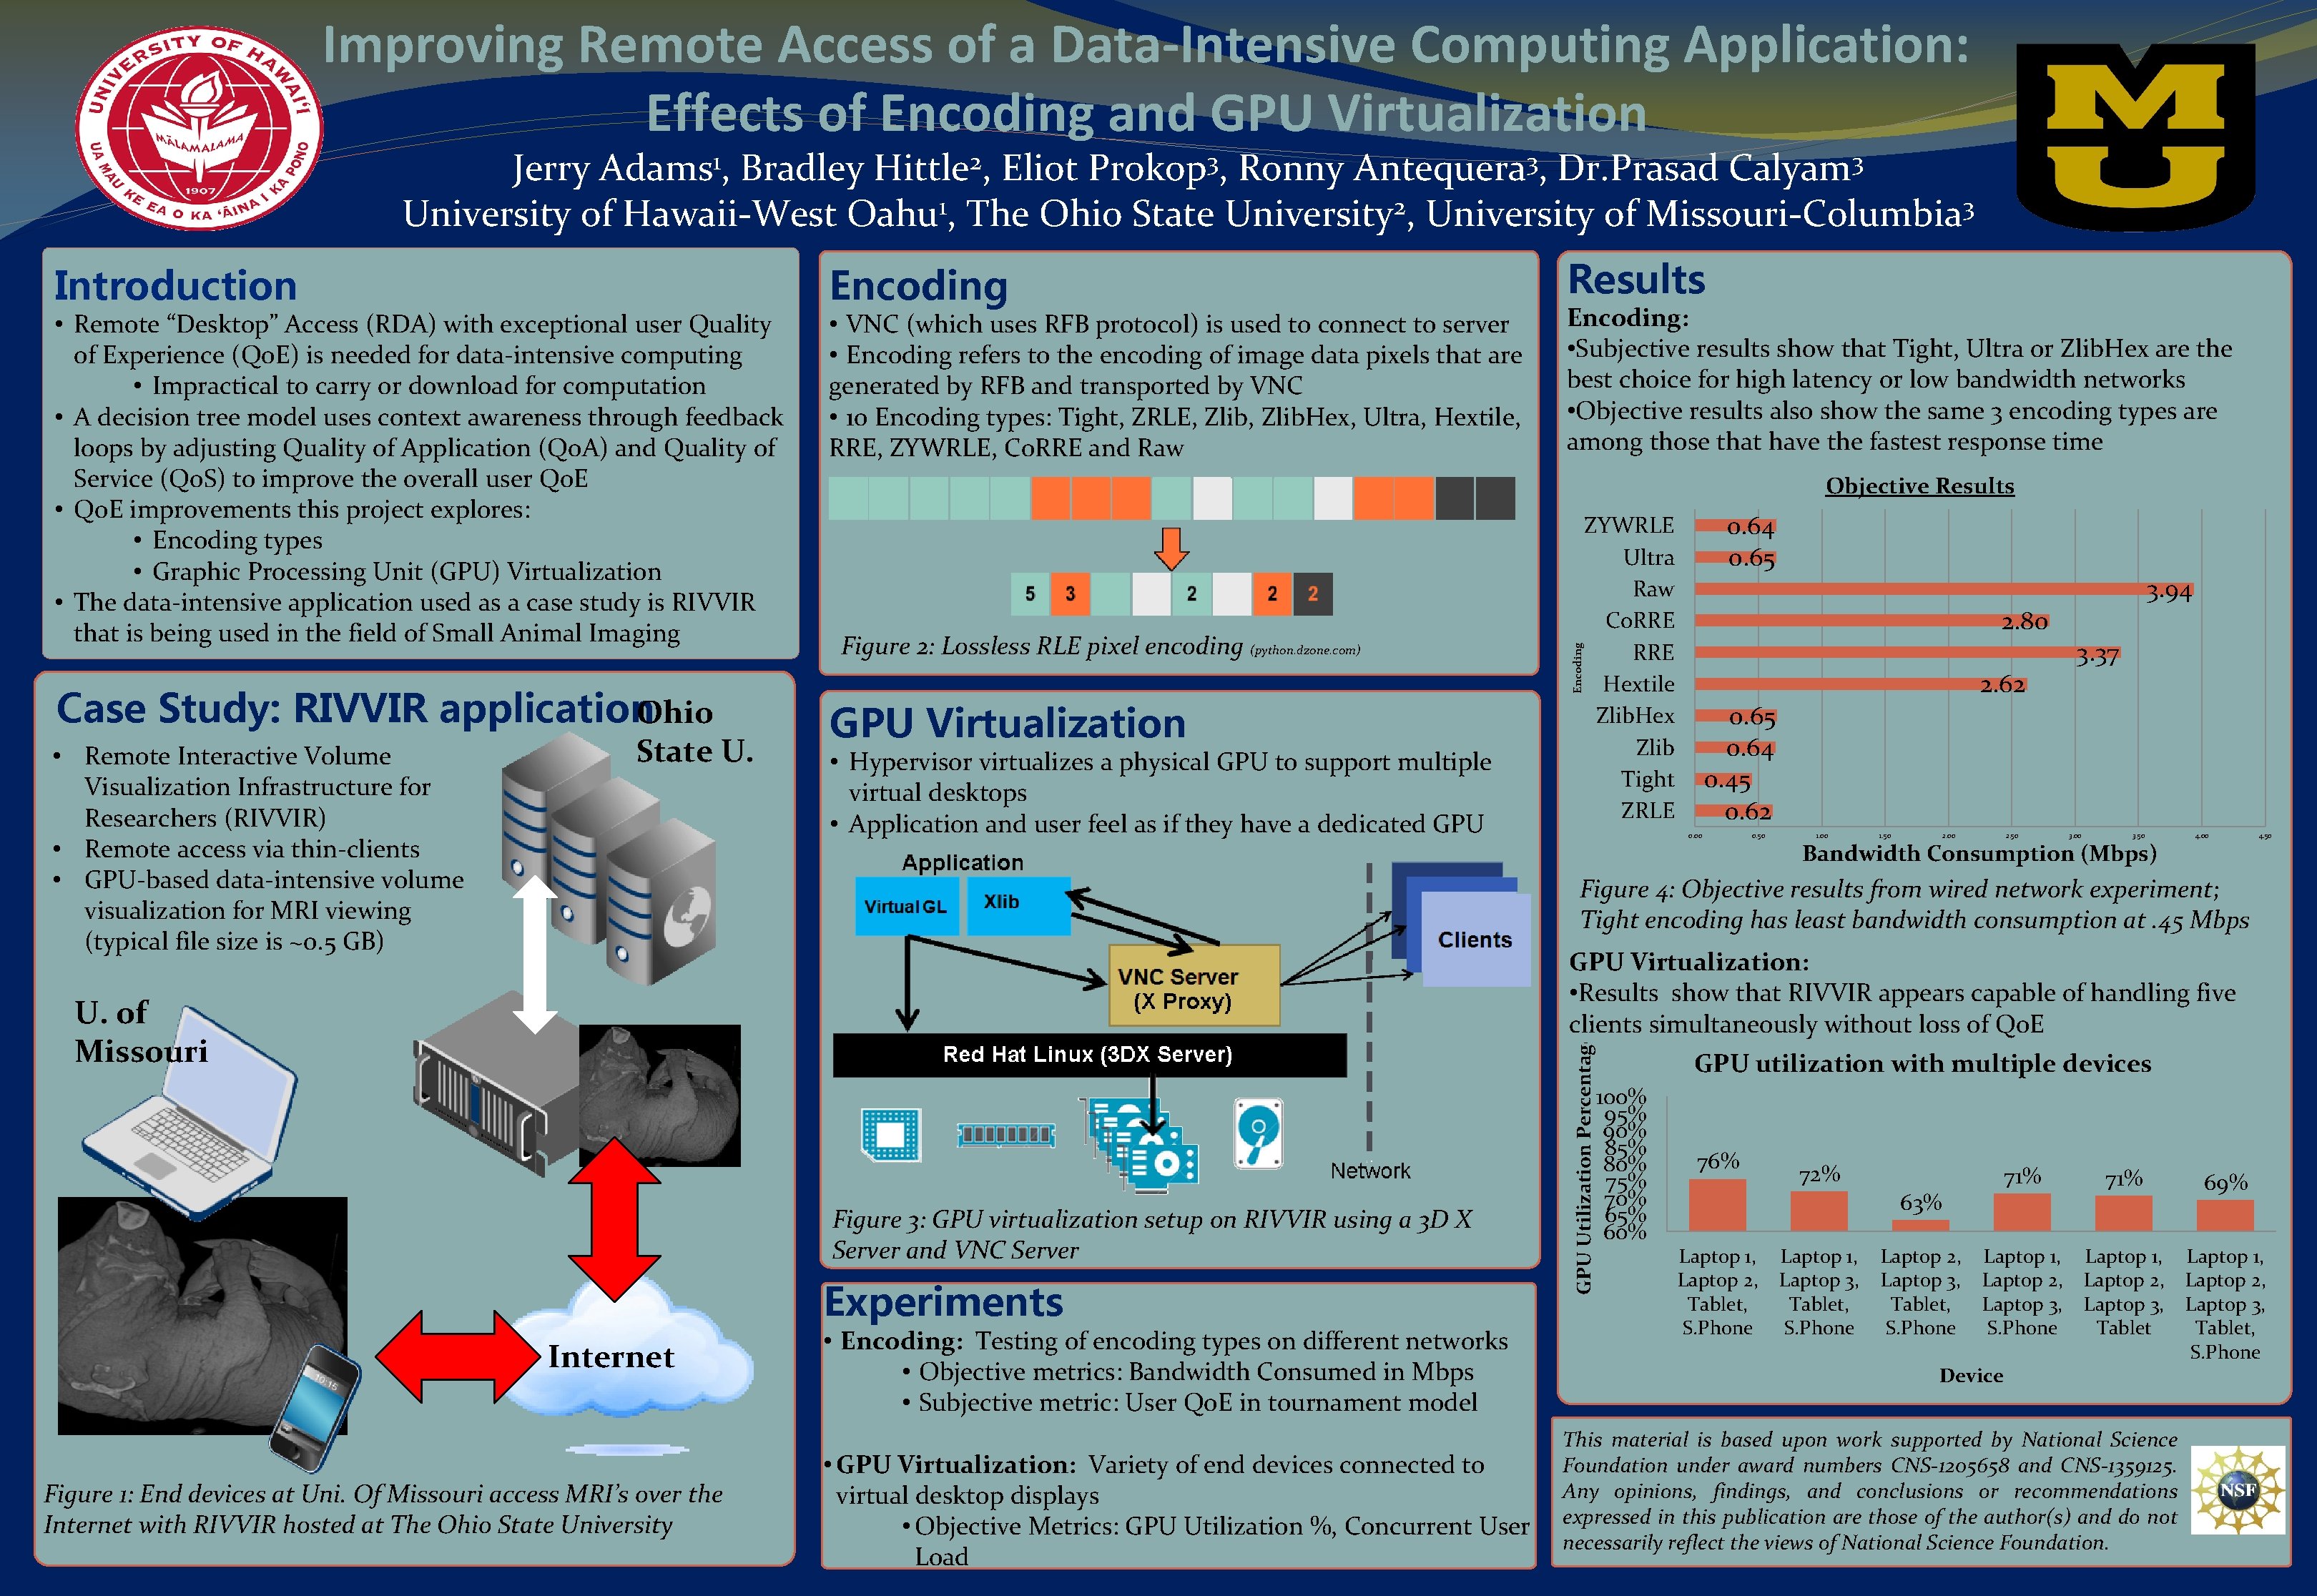
Improving Remote Access of a Data-Intensive Computing Application: Effects of Encoding and GPU Virtualization Jerry Bradley Eliot Ronny Dr. Prasad 1 2 3 University of Hawaii-West Oahu , The Ohio State University , University of Missouri-Columbia Introduction • Remote “Desktop” Access (RDA) with exceptional user Quality of Experience (Qo. E) is needed for data-intensive computing • Impractical to carry or download for computation • A decision tree model uses context awareness through feedback loops by adjusting Quality of Application (Qo. A) and Quality of Service (Qo. S) to improve the overall user Qo. E • Qo. E improvements this project explores: • Encoding types • Graphic Processing Unit (GPU) Virtualization • The data-intensive application used as a case study is RIVVIR that is being used in the field of Small Animal Imaging Case Study: RIVVIR application. Ohio State U. 3 Prokop , 3 Antequera , Encoding • VNC (which uses RFB protocol) is used to connect to server • Encoding refers to the encoding of image data pixels that are generated by RFB and transported by VNC • 10 Encoding types: Tight, ZRLE, Zlib. Hex, Ultra, Hextile, RRE, ZYWRLE, Co. RRE and Raw 3 Calyam Results Encoding: • Subjective results show that Tight, Ultra or Zlib. Hex are the best choice for high latency or low bandwidth networks • Objective results also show the same 3 encoding types are among those that have the fastest response time Objective Results Figure 2: Lossless RLE pixel encoding (python. dzone. com) GPU Virtualization • Hypervisor virtualizes a physical GPU to support multiple virtual desktops • Application and user feel as if they have a dedicated GPU 0. 64 0. 65 ZYWRLE Ultra Raw Co. RRE Hextile Zlib. Hex Zlib Tight ZRLE 3. 94 2. 80 3. 37 2. 62 0. 65 0. 64 0. 45 0. 62 0. 00 0. 50 1. 00 1. 50 2. 00 2. 50 3. 00 3. 50 Bandwidth Consumption (Mbps) 4. 00 4. 50 Figure 4: Objective results from wired network experiment; Tight encoding has least bandwidth consumption at. 45 Mbps GPU Virtualization: • Results show that RIVVIR appears capable of handling five clients simultaneously without loss of Qo. E U. of Missouri Figure 3: GPU virtualization setup on RIVVIR using a 3 D X Server and VNC Server Experiments Internet Figure 1: End devices at Uni. Of Missouri access MRI’s over the Internet with RIVVIR hosted at The Ohio State University • Encoding: Testing of encoding types on different networks • Objective metrics: Bandwidth Consumed in Mbps • Subjective metric: User Qo. E in tournament model • GPU Virtualization: Variety of end devices connected to virtual desktop displays • Objective Metrics: GPU Utilization %, Concurrent User Load GPU Utilization Percentage • Remote Interactive Volume Visualization Infrastructure for Researchers (RIVVIR) • Remote access via thin-clients • GPU-based data-intensive volume visualization for MRI viewing (typical file size is ~0. 5 GB) 2 Hittle , Encoding 1 Adams , GPU utilization with multiple devices 100% 95% 90% 85% 80% 75% 70% 65% 60% 76% 72% 71% 69% Laptop 1, Laptop 2, Laptop 3, S. Phone Laptop 1, Laptop 2, Laptop 3, Tablet, S. Phone 63% Laptop 1, Laptop 2, Tablet, S. Phone Laptop 1, Laptop 3, Tablet, S. Phone Laptop 2, Laptop 3, Tablet, S. Phone Device This material is based upon work supported by National Science Foundation under award numbers CNS-1205658 and CNS-1359125. Any opinions, findings, and conclusions or recommendations expressed in this publication are those of the author(s) and do not necessarily reflect the views of National Science Foundation.