Improving Marine Ecosystem Models Use of Data Assimilation


, PO 4 (0. 5")

")
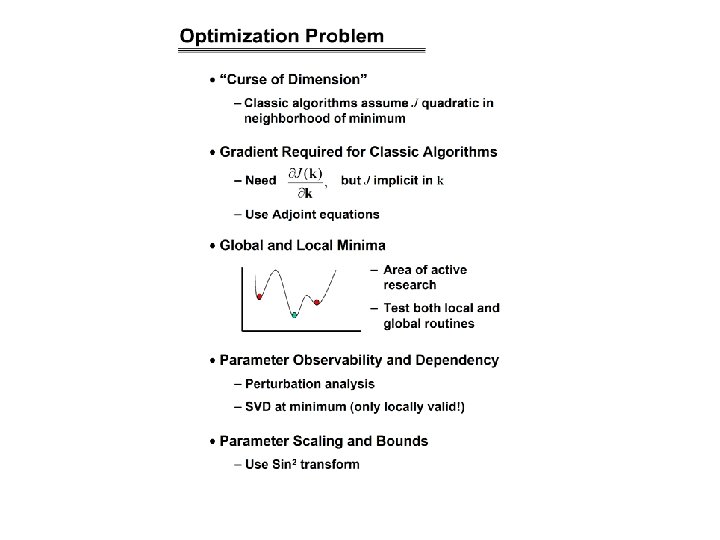


 L L a x Local Optima")


- Slides: 19
Improving Marine Ecosystem Models: Use of Data Assimilation and Mesocosm Experiments Joseph Vallino ASLO Meeting Santa Fe NM, Feb. 1999 Ecosystems Center Marine Biological Laboratory, Woods Hole MA
Mesocosm Experiment · Additions: – NO 3 (5 m. M), PO 4 (0. 5 m. M), Si (7 m. M) – Leaf litter leachate (300 m. M DOC) · Treatments: – Control: – Organic Matter: Bag B – Daily Nutrients: Bag C – DOM + Nutrients: · Samples Taken: – NO 3, NH 4, PO 4, Si, O 2 DIC – PAR – POC, PON, DOC, DON – Chl a – PP (14 C and O 2 incubations) – Bacterial No. and productivity – Phyto- and zooplankton counts – DI 13 C, DO 15 N – Size fractionated d 13 C and d 15 N D C B A Bag D
Mesocosm Food Web Model · Aggregated, coupled C and N model · Emphasis on OM processing · Holling type II and III growth kinetics · State Eqns: 10 – Auto. – Osomo. – Hetero. – Detritus – DIN – DOM-L – DOM-R C, N C N C N · Parameters – 29 Kinetic – 10 Initial cond.
Data Assimilation Problem · State Model: · Mapping to Observations: e. g. , POC(t) = A(t) + H(t) + B(t) + DC (t) · Objective Function: Measurement error
Optimization Routines Tested
Optimization Results
Local and Global Optima Raw Data Model y(x) L L a x Local Optima Solution y(x) G b Global Optima Solution y(x) x x
Model Errors · Aggregation Error Concentration True Model P 1 P 2 True parameter values Z Time P 1+2 = P 1 + P 2 · Process Errors Concentration Approx. Model P 1+2 Z Estimated aggregated parameter values N Time – Organic matter production and consumption. – Constant parameter values, such as C: N ratio of phytoplankton. – Mortality closure scheme. – Etc.
Conclusions · Mesocosms useful for process based modeling – However, should separately model bag walls, etc. · Optimization Routines – Simulated annealing, if computation limits permits – PRAXIS (no Grad. ) or Levenberg-Marquardt (w/ Grad. ) routines – Adjoint useful for computationally intense problems · Integrate model development with experimental observations · Improve model robustness based on aggregation techniques – Holistic versus reductionist approach · Establish modeling benchmarks
Acknowledgements Chuck Hopkinson Hap Garritt Linda Deegan Ishi Buffam Anne Giblin Michele Bahr John Hobbie Jane Tucker · Funding: - National Science Foundation, LMER and LTER programs - Lakian Foundation · Manuscript submitted: JMR – Available at: http: //eco 25. mbl. edu/