Improving Curtailment Representation in Utility Planning Tools Brady

Improving Curtailment Representation in Utility Planning Tools Brady Cowiestoll, Elaine Hale, Jennie Jorgenson, and Matt Irish USAEE Meeting 4 November 2019

Big Picture How does the value of renewable generation technologies change with increasing penetrations? VG curtailment is a critical part of the story. NREL | 2

RPM: a mixed nodal/zonal capacity expansion model aggregating all but focus region NREL | 3

RPM overview NREL | 4

Curtailment • Increased VG penetration tends to increase curtailment, but in a complex manner • RPM’s reduced dispatch does not fully capture curtailment drivers Preliminary Results – Do Not Distribute or Cite NREL | 5

Curtailment Regression • Run many RPM scenarios to create wide “surface space” for each focus region – Default – Low/high gas costs, storage costs, PV costs, load growth, carbon price – Combinations of above • Run each solve year in PLEXOS (production cost model) with hourly economic dispatch & unit commitment • Use computed PLEXOS curtailment to create regression used in RPM NREL | 6

Random Forest • Ensemble of decision trees <500 GWh PV Energy in region 1 ≥ 500 <500 GWh Wind Energy in GWh region 1 0 MWh 50 MWh ≥ 500 GWh <5000 GWh 100 MWh PV Energy in region 2 ≥ 5000 GWh 500 MWh NREL | 7

Random Forest • Ensemble of decision trees 1 2 Ntrees … Mean is prediction NREL | 8

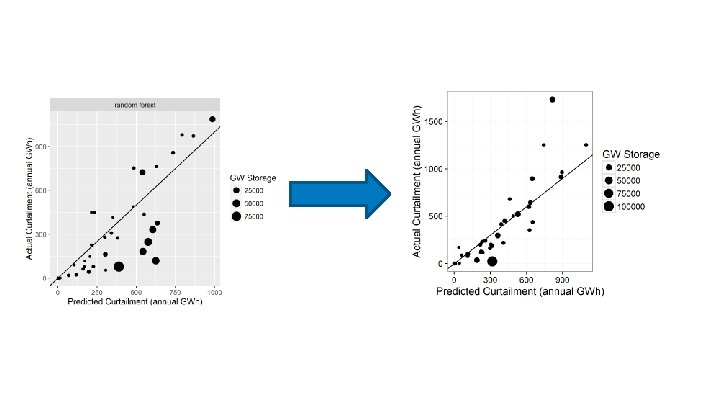
• Regression performs well for most cases • High curtailment scenarios typically under-predict curtailment • Low curtailment scenarios typically over-predict curtailment Preliminary Results – Do Not Distribute or Cite PLEXOS curtailment (GWh/yr) Curtailment Predictions % VRE Penetration Curtailment predicted by regression (GWh/yr) NREL | 9
 NLDC For each region, 1.")
Marginal Curtailment for New Variable Generation Demand LDC NLDC(δ) NLDC For each region, 1. Identify a “min-gen” line representing existing system curtailment (calculated through regression) 2. For each VG technology, calculate how increased VG changes the area under that line minimum thermal generation curtailment Hour incremental curtailment for new VG

Results without Exogenous Curtailment Preliminary Results – Do Not Distribute or Cite • Model basically ignores curtailment • Some does exist, but not a realistic amount

With Random Forest Regression Preliminary Results – Do Not Distribute or Cite • Curtailment present • Realistic growth in RE • Expected impacts on RE installations by technology

Conclusions • Regression requires many runs, but allows for complex interactions between variables Future development: • Ongoing efforts at NREL to model PCM-detail dispatch in CEM • Validation of marginal curtailment estimates with PCM results Discussion here and in the halls: • How can we further improve curtailment representation in CEMs? NREL | 13

Thanks! Questions? matthew. irish@nrel. gov This work was authored by the National Renewable Energy Laboratory, operated by Alliance for Sustainable Energy, LLC, for the U. S. Department of Energy (DOE) under Contract No. DE-AC 36 -08 GO 28308. The views expressed in the article do not necessarily represent the views of the DOE or the U. S. Government. The U. S. Government retains and the publisher, by accepting the article for publication, acknowledges that the U. S. Government retains a nonexclusive, paid-up, irrevocable, worldwide license to publish or reproduce the published form of this work, or allow others to do so, for U. S. Government purposes.

Overview The Resource Planning Model and curtailment Curtailment regression with PCM results Marginal curtailment estimation Summary and ideas for the future NREL | 15

Random Forest Regression Summary Challenges • Requires a large number of runs • Can’t extrapolate—must represent entire space of possibilities • Chosen hyperparameters don’t fully describe the system Benefits • Accounts for large number of possible contributing variables and correlated variables • Allows for complex interactions between variables NREL | 16

Marginal Curtailment for New Variable Generation NREL | 17

Random Forest • Ensemble of decision trees 1 2 Ntrees … Mean is prediction NREL | 18

Relative Importance of Hyperparameters NREL | 19
 reserve provision (MWh) actual curtailment")
Curtailment Requirements in Model • total available energy (MWh) reserve provision (MWh) actual curtailment (MW) d = period h = hour predicted curtailment as fraction of available energy q = resource c = class n = location NREL | 20

Peak day does not fully capture capacity value Low period doesn’t fully capture conflict between wind, solar, and thermal fleet inflexibility 96 dispatch hours per year Reduced order dispatch doesn’t fully address the variability seen throughout the year NREL | 21

Appendix NREL | 22

Curtailment Requirements in Model • NREL | 23

Residuals NREL | 24

Min-Gen, by NERC region

Annual curtailment in focus region

Annual curtailment in focus region Low pv costs – no storage Low pv costs, low storage costs, high NG, 80% RPS - 2025 Low pv costs, low storage costs, high NG, 80% RPS - 2030 Low pv costs, low storage costs, high NG, 80% RPS - 2035
- Slides: 28