Improved Earth Observation for Drought Monitoring Fatima Akhtar

Improved Earth Observation for Drought Monitoring Fatima Akhtar 14 -Arid-4218 Syeda Areeba Gillani 14 -Arid-5001 Sadaqat Hussain 14 -Arid-494 Hayat 14 -Arid-488

Introduction v Drought is the most complex but least understood phenomenon. v There is no universal definition of drought. v Broad definition of drought as “ severe water shortage” suggested by The Director of Common Wealth Bureau of Meteorology in 1965.

Drought is… Water Demand Water Supply

History of drought in Pakistan v Population growth and climate change cause of drought. v According to Economic Survey of Pakistan, it is responsible poor growth performance in the country. v Drought has become common in Pakistan in case of Monsoon season fails to deliver rainfall.

v Extreme drought of 1998 -2002 Balochistan and sind hardest hit v Moderate drought of 2004 till 2005 Again Balochistan and sind hardest hit v Weak drought of 2009 -mid 2010 This drought developed over the upper parts of Pakistan that is Punjab, Khyber, Gilgit, Kashmir and Northern Balochistan

Objectives v To analyze vegetation cover changed due to variation in rainfall v Identify areas facing high drought risk combination of satellite data and other information by

Study Area The study area choose for this research is Balochistan which extend is 30. 1200° N, 67. 0100° E v Balochistan, the largest of the four provinces of Pakistan, spreads over an area of 347, 190 Sq Km, forming 43. 6 per cent of the total area of Pakistan. v The landscape of Balochistan is composed of barren, rugged mountains and fertile, but dry land. Most of the land is barren, particularly on the Iranian and Afghan side of the region, and it is generally sparsely populated. In the south (Makran) lies the desert.

Study Area v Average annual precipitation in Balochistan varies from 2 to 20 inches (50 to 500 mm). Maximum precipitation falls in the northeastern areas with annual average rain fall ranging from 8 to 20 inches (200 to 500 mm). It decreases in the south and the eastern parts and is minimum in Naukundi, Kharan and Dalbandin area, rainfall ranges between 1 to 2 inches (25 to 50 mm). Evaporation rates are higher than the precipitation and generally vary from 72 to 76 inches (1830 1930 mm) per annum.

Map of Study Area FATA GB KPK Afghanistan IOK AJK PUNAB BALOCHISTAN INDIA SIND SEA
 v Metrological data (rainfall")
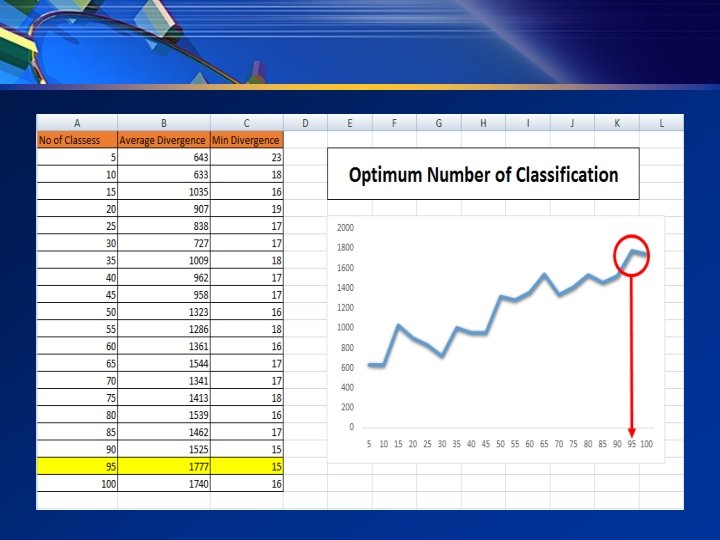
Material and Methodology Data………. v Satellite Imagery (MODIS, LP DAAC) v Metrological data (rainfall data, PMD) v Statistic data (Ministry of Agriculture Department) SOFTWERE ……… v Excel v Arc. GIS v Erdas Imagine

Methodology

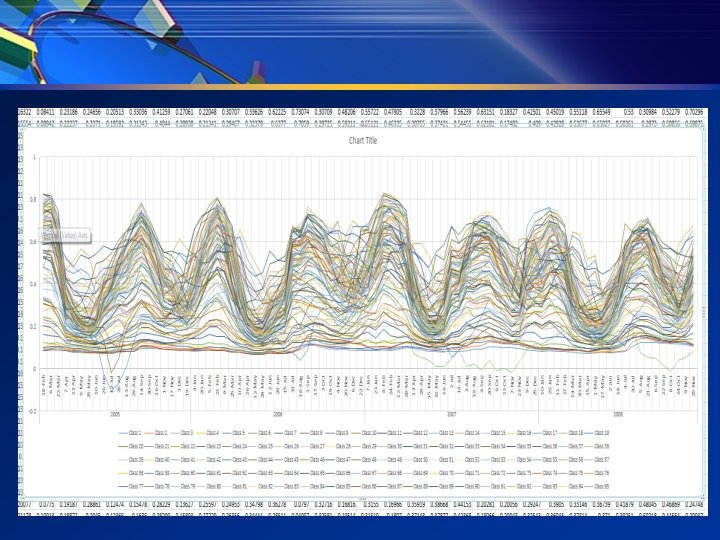
Output v Change in vegetation cover will be monitor by using temporal data with relation variation in rainfall. v Identify the areas which will be most effected by drought by using time series satellite data on the biases of these outputs one can be make plan how to overcome during such type of situations on early biases.

Thank You
- Slides: 15