
Improved disaster management with use of Statistics Netherlands

- Slides: 40
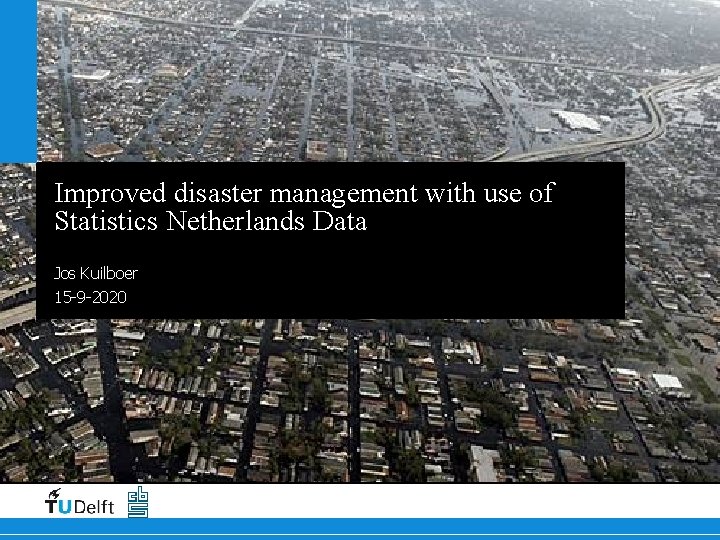
Improved disaster management with use of Statistics Netherlands Data Jos Kuilboer 15 -9 -2020
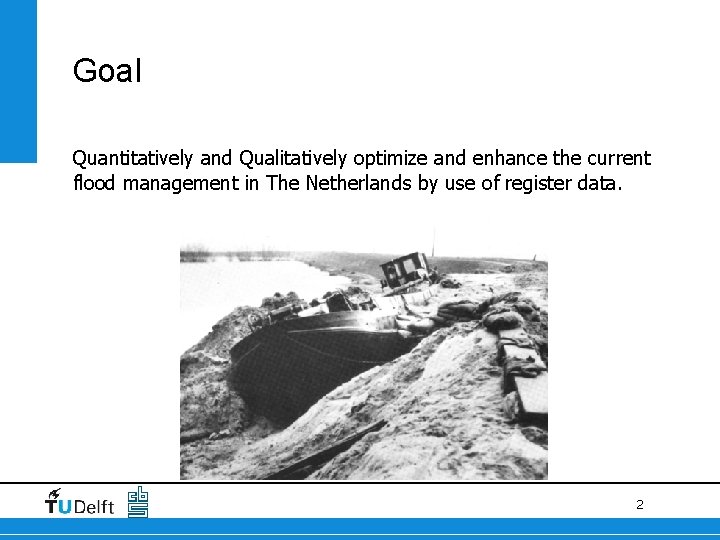
Goal Quantitatively and Qualitatively optimize and enhance the current flood management in The Netherlands by use of register data. 2
1. Introduction 2. Models characteristics 3. Stakeholders 4. SN data 5. Newly developed framework 6. Model, test-case 7. Conclusions and Recommendations 3
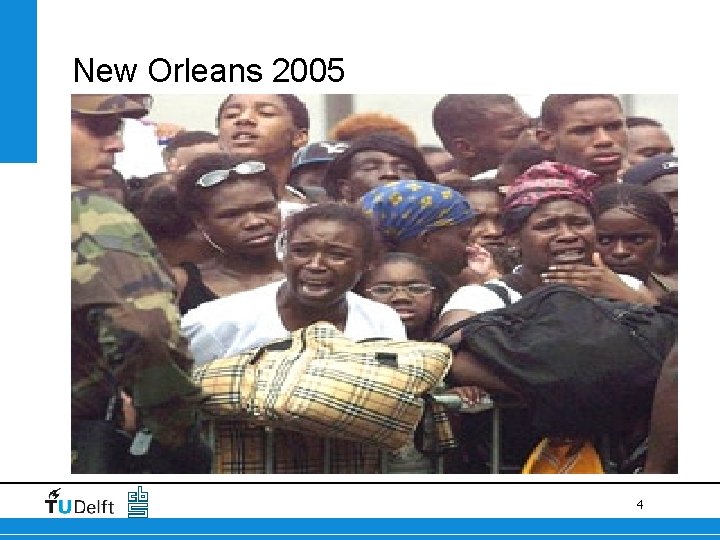
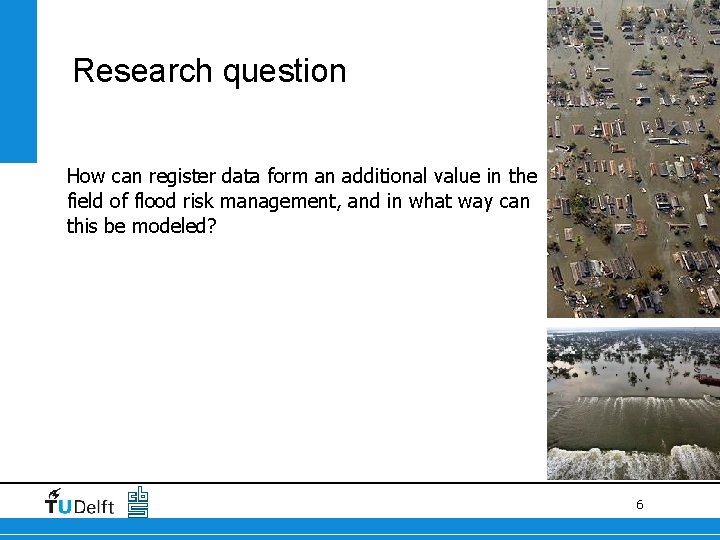
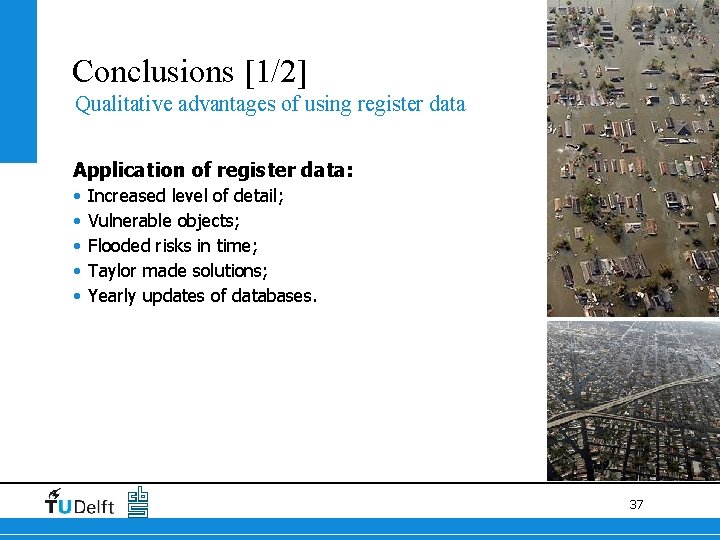
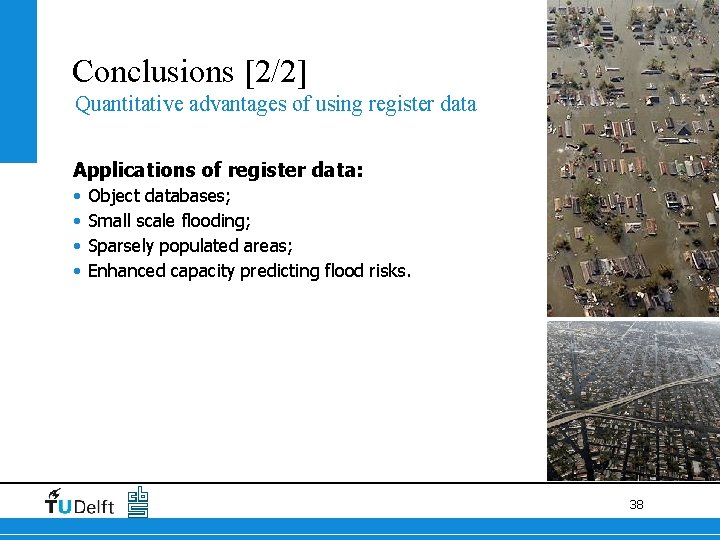
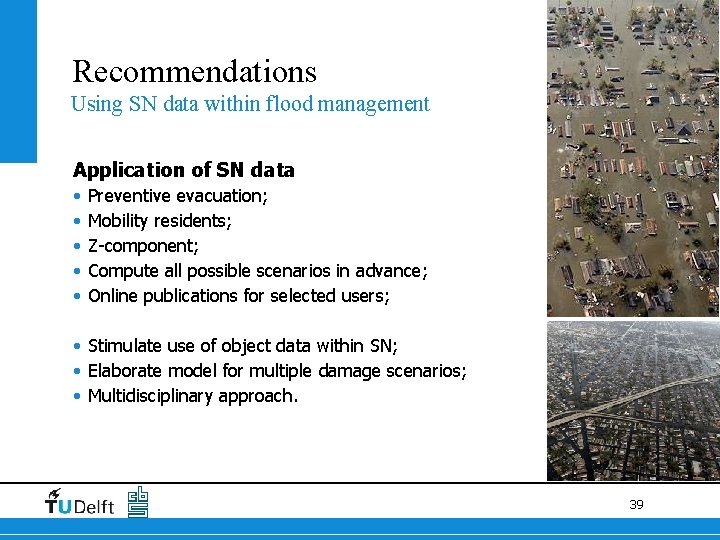
New Orleans 2005 4
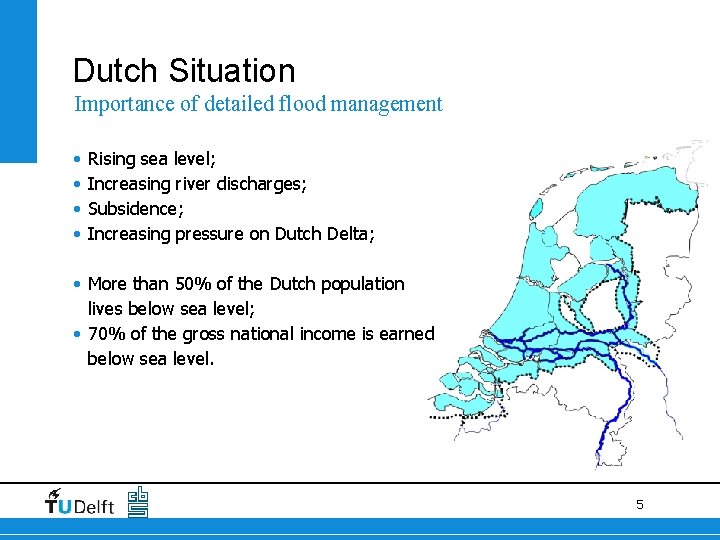
Dutch Situation Importance of detailed flood management • • Rising sea level; Increasing river discharges; Subsidence; Increasing pressure on Dutch Delta; • More than 50% of the Dutch population lives below sea level; • 70% of the gross national income is earned below sea level. 5
Research question How can register data form an additional value in the field of flood risk management, and in what way can this be modeled? 6
2. Models 1. Introduction 2. Model characteristics 3. Stakeholders 4. SN data 5. Newly developed framework 6. Model, test-case 7. Conclusions and Recommendations 7
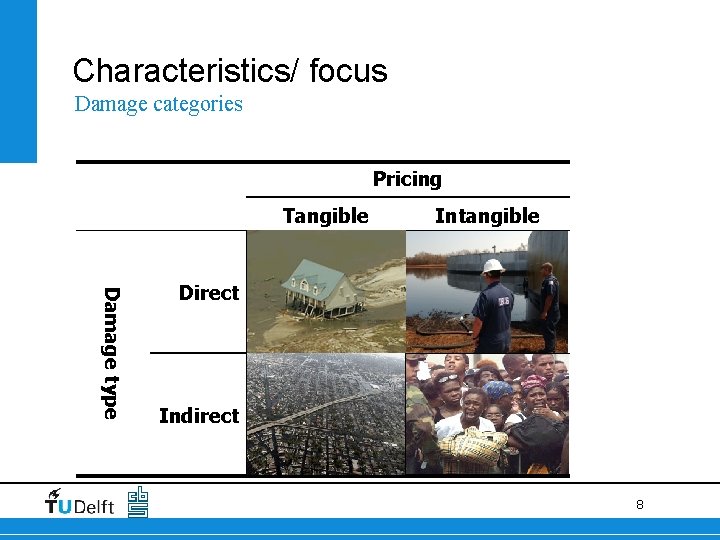
Characteristics/ focus Damage categories Pricing Tangible Intangible Damage type Direct Indirect 8
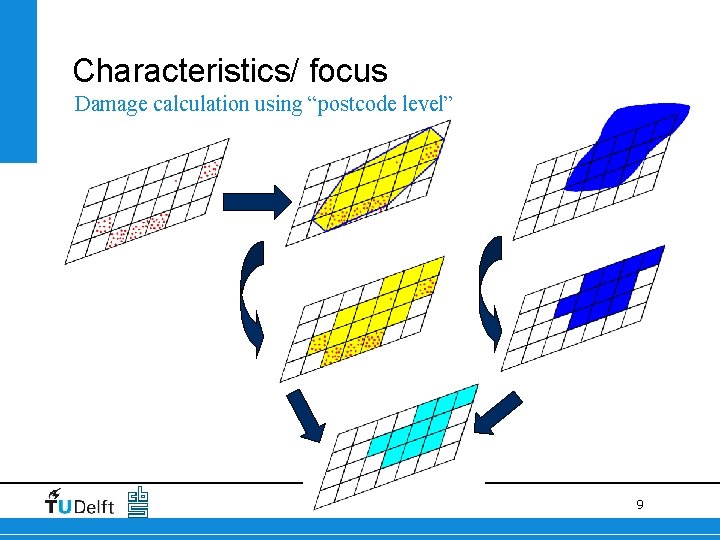
Characteristics/ focus Damage calculation using “postcode level” 9
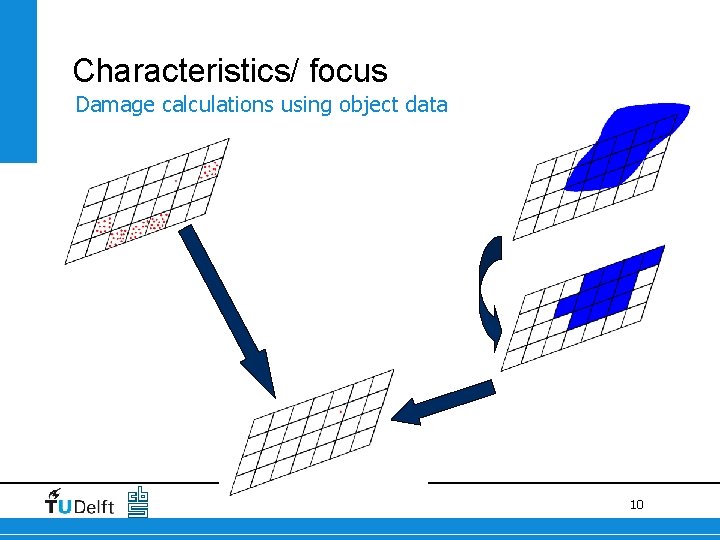
Characteristics/ focus Damage calculations using object data 10
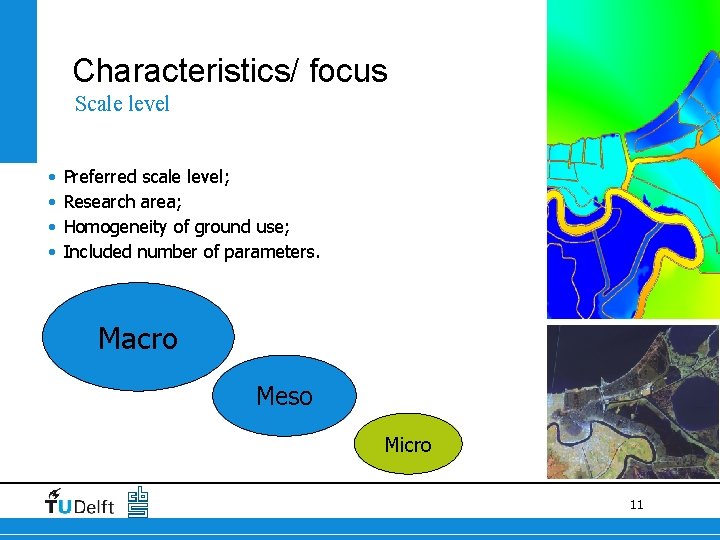
Characteristics/ focus Scale level • • Preferred scale level; Research area; Homogeneity of ground use; Included number of parameters. Macro Meso Micro 11
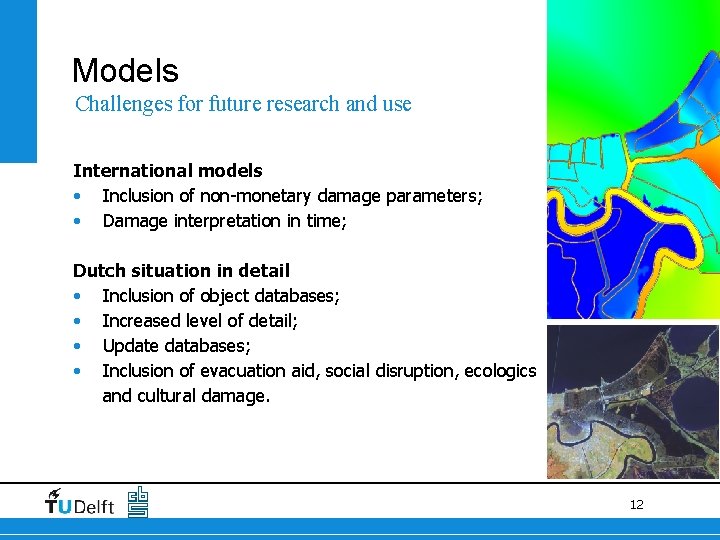
Models Challenges for future research and use International models • Inclusion of non-monetary damage parameters; • Damage interpretation in time; Dutch situation in detail • Inclusion of object databases; • Increased level of detail; • Update databases; • Inclusion of evacuation aid, social disruption, ecologics and cultural damage. 12
3. Stakeholders 1. Introduction 2. Model characteristics 3. Stakeholders 4. SN data 5. Newly developed framework 6. Model, test-case 7. Conclusions and Recommendations 13
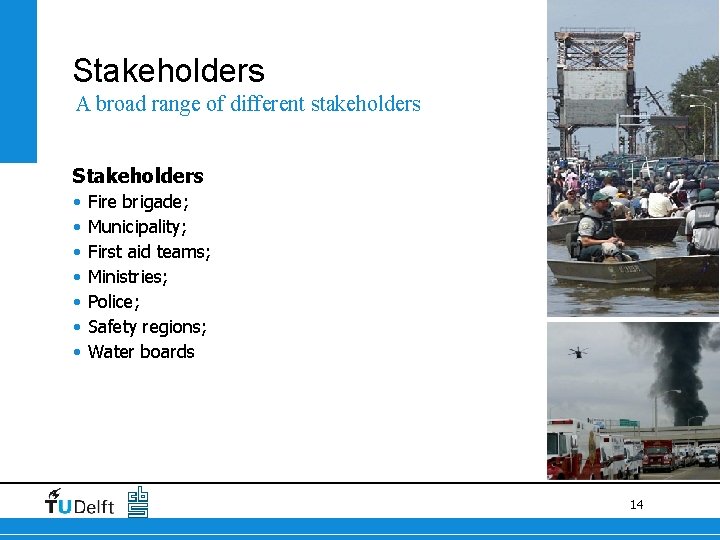
Stakeholders A broad range of different stakeholders Stakeholders • • Fire brigade; Municipality; First aid teams; Ministries; Police; Safety regions; Water boards 14
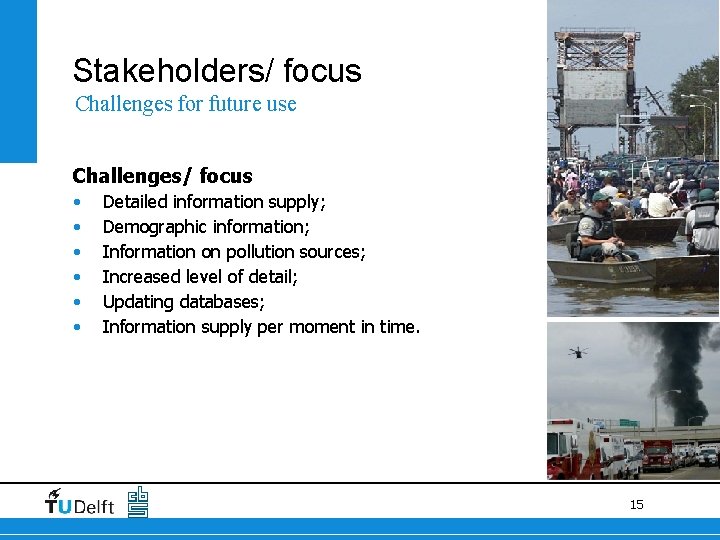
Stakeholders/ focus Challenges for future use Challenges/ focus • • • Detailed information supply; Demographic information; Information on pollution sources; Increased level of detail; Updating databases; Information supply per moment in time. 15
4. Statistics Netherlands data 1. Introduction 2. Model characteristics 3. Stakeholders 4. SN data 5. Newly developed framework 6. Model, test-case 7. Conclusions and Recommendations 16
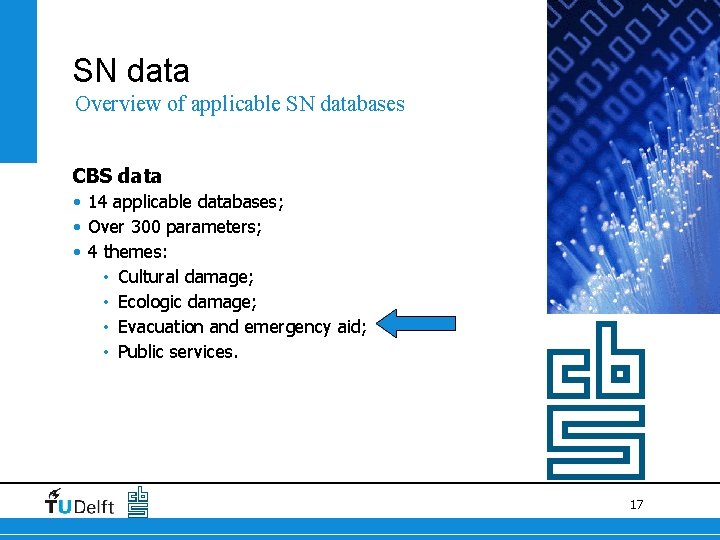
SN data Overview of applicable SN databases CBS data • 14 applicable databases; • Over 300 parameters; • 4 themes: • Cultural damage; • Ecologic damage; • Evacuation and emergency aid; • Public services. 17
How can register data form an additional value in the field of flood risk management, and in what way can this be modeled? 18
5. Newly developed framework 1. Introduction 2. Models 3. Stakeholders 4. SN data 5. Newly developed framework 6. Model, test-case 7. Conclusions and Recommendations 19
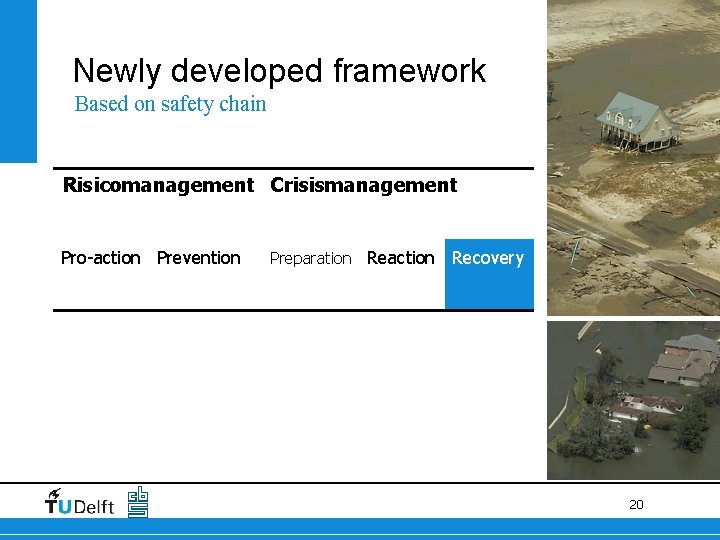
Newly developed framework Based on safety chain Risicomanagement Crisismanagement Pro-actie Prevention Pro-action Preventie Preparatie Reaction Reactie Preparation Herstel Recovery 20
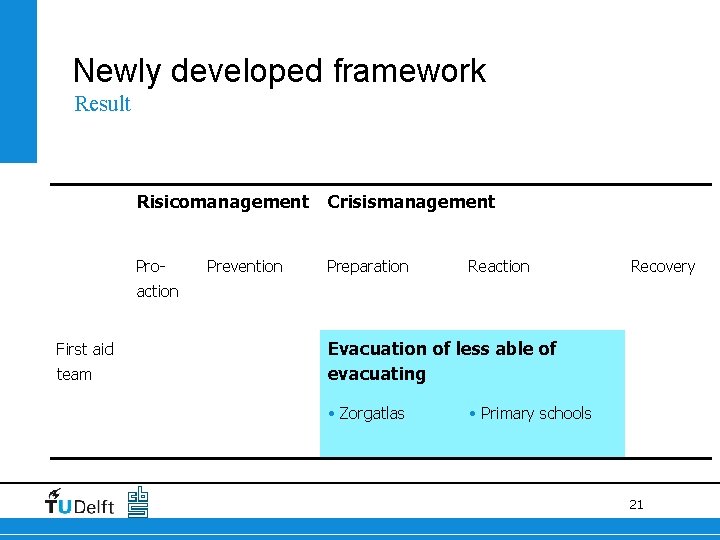
Newly developed framework Result Risicomanagement Crisismanagement Pro- Preparation Prevention Reaction Recovery action First aid team Evacuation of less able of evacuating • Zorgatlas • Primary schools 21
6. Model, test-case 1. Introduction 2. Models 3. Stakeholders 4. SN data 5. Newly developed framework 6. Model, test-case 7. Conclusions and Recommendations 22
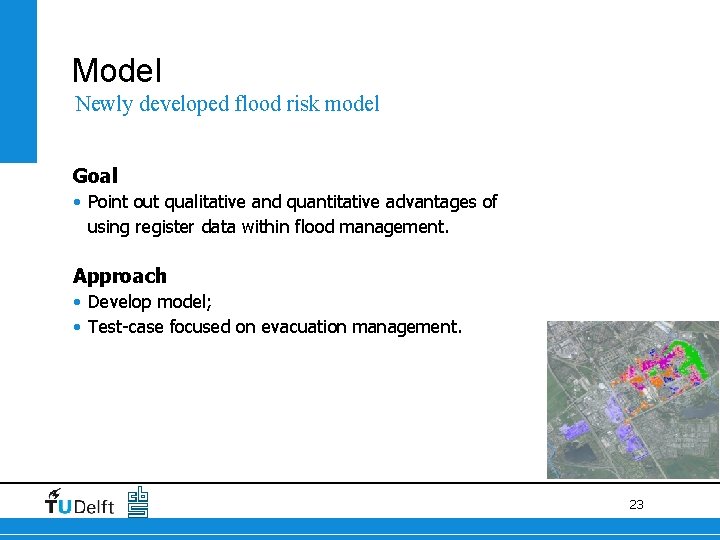
Model Newly developed flood risk model Goal • Point out qualitative and quantitative advantages of using register data within flood management. Approach • Develop model; • Test-case focused on evacuation management. 23
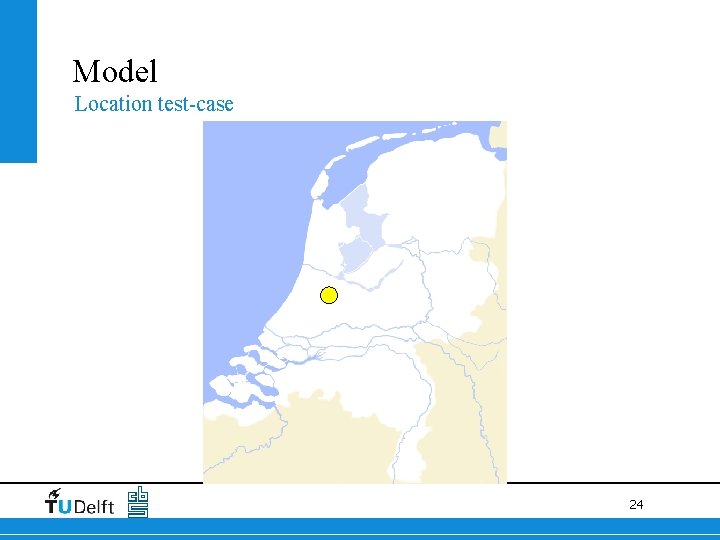
Model Location test-case 24
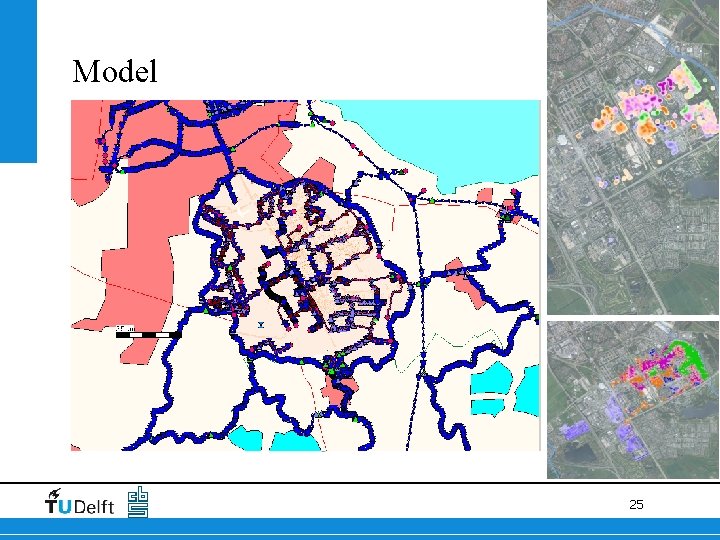
Model Structuur van model 25
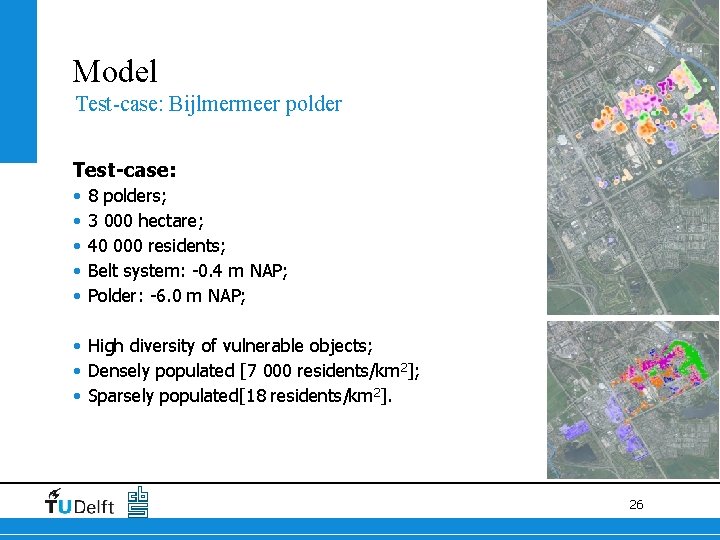
Model Test-case: Bijlmermeer polder Test-case: • • • 8 polders; 3 000 hectare; 40 000 residents; Belt system: -0. 4 m NAP; Polder: -6. 0 m NAP; • High diversity of vulnerable objects; • Densely populated [7 000 residents/km 2]; • Sparsely populated[18 residents/km 2]. 26
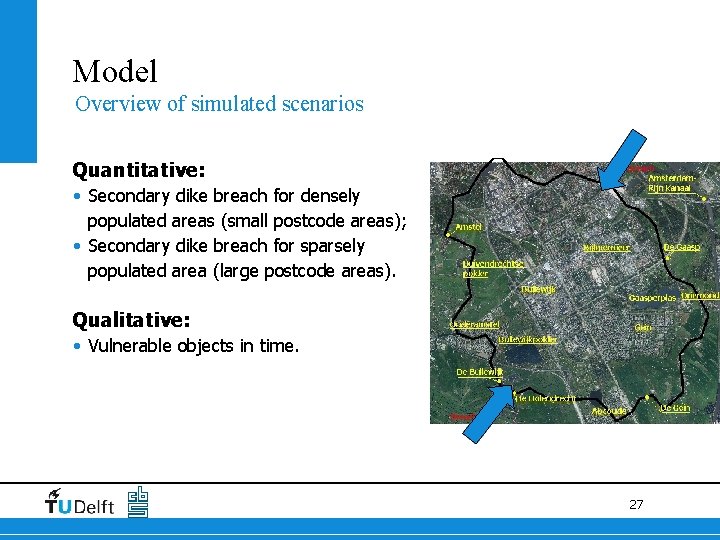
Model Overview of simulated scenarios Quantitative: • Secondary dike breach for densely populated areas (small postcode areas); • Secondary dike breach for sparsely populated area (large postcode areas). Qualitative: • Vulnerable objects in time. 27
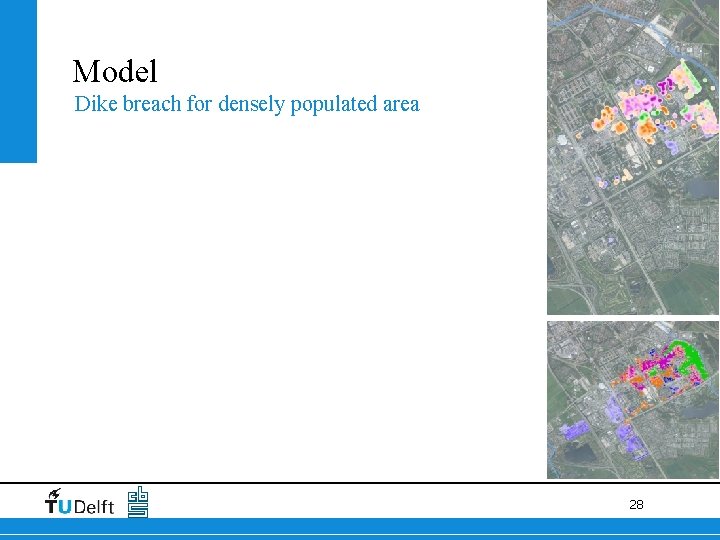
Model Dike breach for densely populated area 28
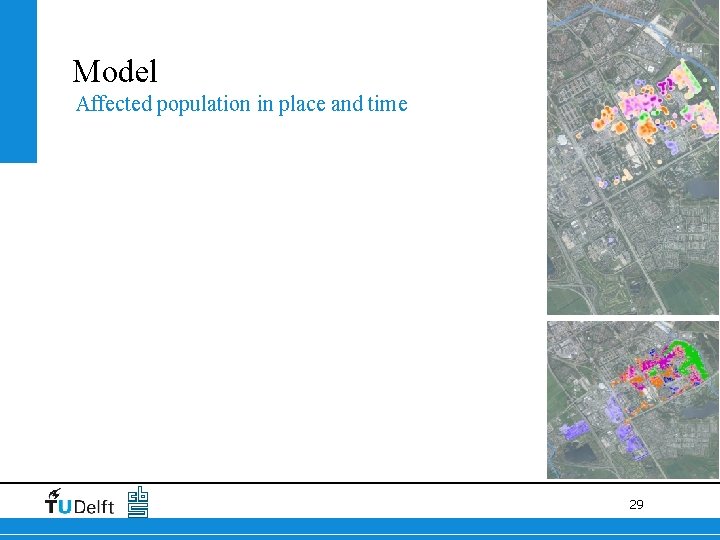
Model Affected population in place and time 29
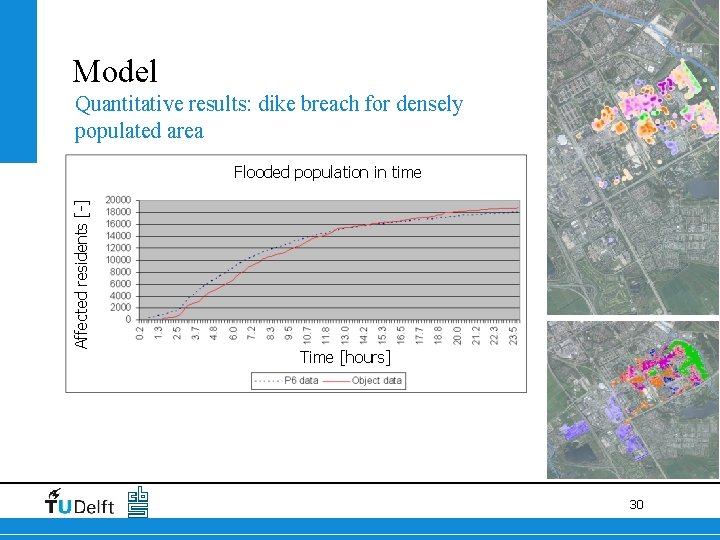
Model Quantitative results: dike breach for densely populated area Affected residents [-] Flooded population in time Time [hours] 30
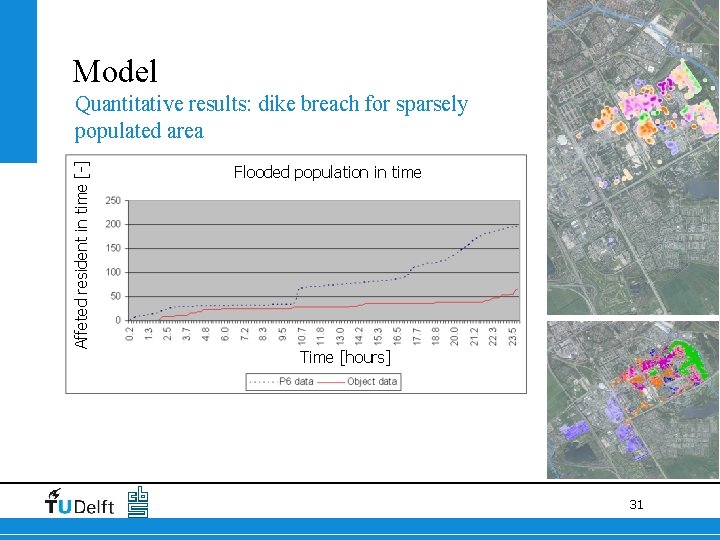
Model Affeted resident in time [-] Quantitative results: dike breach for sparsely populated area Getroffen Flooded population bevolking ininde time tijd Time [hours] 31
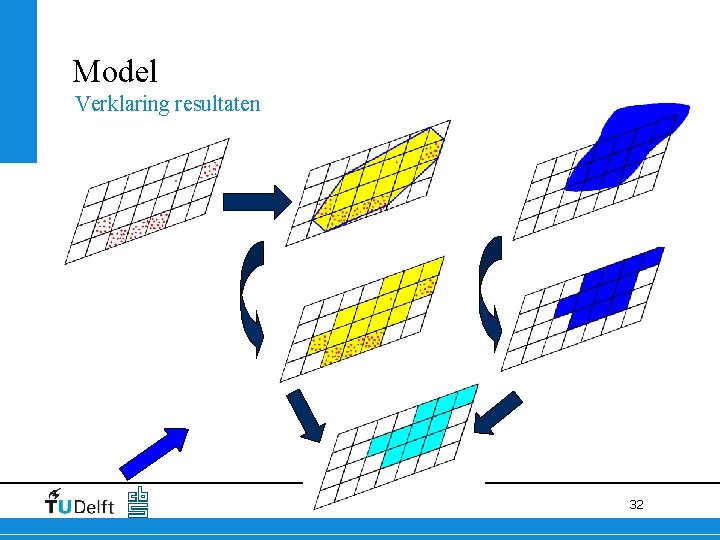
Model Verklaring resultaten 32
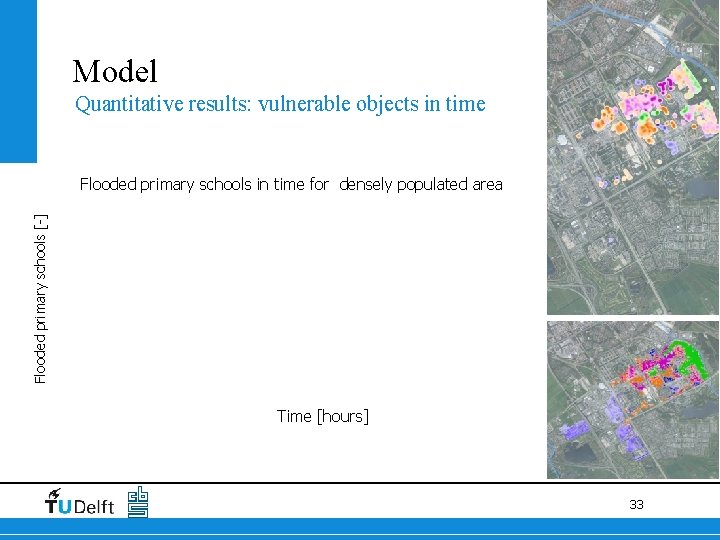
Model Quantitative results: vulnerable objects in time Flooded primary schools [-] Flooded primary schools in time for densely populated area Time [hours] 33
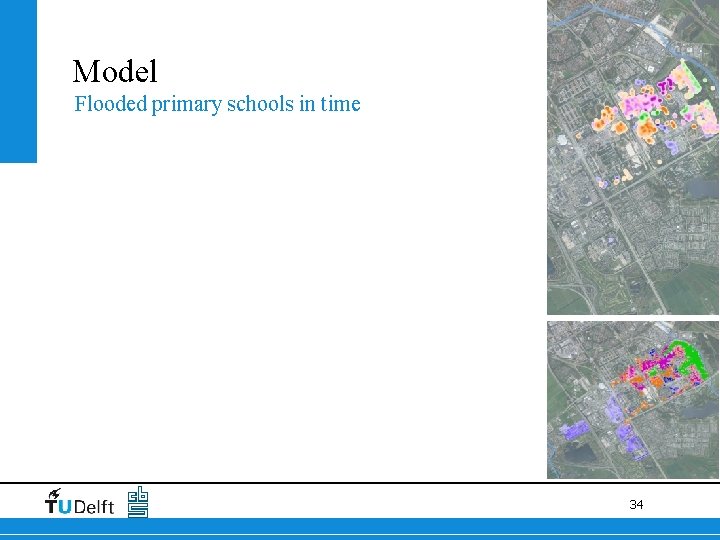
Model Flooded primary schools in time 34
How can register data form an additional value in the field of flood risk management, and in what way can this be modeled? 35
7. Conclusions and Recommendations 1. Introduction 2. Models 3. Stakeholders 4. SN data 5. Newly developed framework 6. Model, test-case 7. Conclusions and Recommendations 36
Conclusions [1/2] Qualitative advantages of using register data Application of register data: • • • Increased level of detail; Vulnerable objects; Flooded risks in time; Taylor made solutions; Yearly updates of databases. 37
Conclusions [2/2] Quantitative advantages of using register data Applications of register data: • • Object databases; Small scale flooding; Sparsely populated areas; Enhanced capacity predicting flood risks. 38
Recommendations Using SN data within flood management Application of SN data • • • Preventive evacuation; Mobility residents; Z-component; Compute all possible scenarios in advance; Online publications for selected users; • Stimulate use of object data within SN; • Elaborate model for multiple damage scenarios; • Multidisciplinary approach. 39
Questions? Contact: • n. vanleeuwen@cbs. nl • joskuilboer@hotmail. com 40