Importance of Changes in Greenland Ice Sheet Melt


- Slides: 6

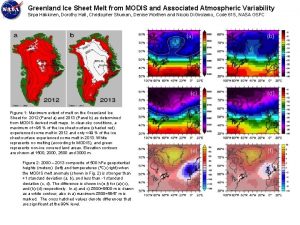
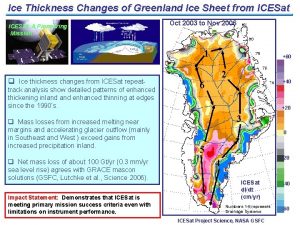
Importance of Changes in Greenland Ice Sheet Melt Study Melting on the Greenland ice sheet has direct and indirect effects on the ice sheet’s contributions to sea level. Direct Effects on sea level -runoff of meltwater -evaporation of meltwater Indirect Effects on sea level -Meltwater reaches the ice/bedrock interfaces through crevasses and moulins. This accelerates the ice flow and discharge of ice into the ocean. -Floating ice shelves and ice tongues form where glaciers terminate. These floating ice masses buttress the glaciers that feed them. As they shrink, their ability to do so causes the glaciers to accelerate, in some cases dramatically. Results The Greenland ice sheet is of great importance for assessing its contribution to sea level. Understanding changes in the melt on the Greenland ice sheet, which contains the equivalent of nearly 7 m of sea level. High resolution visible imagery provides an important complement to microwave techniques that captures different features of the melt. An analysis of data from the last 25 years reveals increases in melt and suggests a significant change in the last 4 years. Terms: meltwater-water that has melted from an ice sheet crevasses-open fissure in the glacier surface moulin-a nearly vertical channel in ice that is formed by flowing water ice shelves- portions of an ice sheet that spreads out over water ice tongues-long, narrow, projections of ice out from the coastline Joey Comiso/Cryospheric Sciences Branch, Hydrospheric & Biospheric Sciences Laboratory (josefino. c. comiso@nasa. gov)

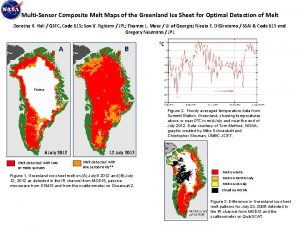
Increasing Greenland Ice Sheet Melt Area from AVHRR Surface Temperature Data • Satellite data from 1981 to 2005 indicate that surface melt over the ice sheet have increased, especially since 2002 • Areas which experienced melt temperatures for less than a week (blue line) increased by 5. 4% per decade • Areas with melt temperatures for less than two weeks (red dash line) increased by 3. 8 % per decade • The results indicate that an increasing proportion of the Greenland ice sheet is melting each summer Ref: Comiso, J. (2005) Warming signals in the Arctic from Satellite Observations, Weather (in press). Abdalati, W. and K. Steffen, (1997) Snowmelt on the Greenland ice sheet as derived from passive microwave satellite data. J. Climate, 10(165), pp. 165 -175.

Sea Surface Waves of Hurricanes Edward. Walsh@nasa. gov 25/10/2021 Charles. W. Wright@nas a. gov The hurricane wave field is determined by its size, intensity, and forward speed. The NASA Scanning Radar Altimeter, mounted onboard a NOAA hurricane research aircraft, has been measuring hurricane ocean waves since 1998. Hurricane Bonnie was Category 2, but because of its much larger size it had significantly greater waves than those generated by Category 3 Hurricane Lili. (1) Black radials extend in the wave propagation direction a distance proportional to the ocean wavelength ( wl). Their width is proportional to the significant wave height (Hs). Wind contours at 5 m/s, color changes at 10 m/s intervals. wind speed (m/s) (3)

Sensitivity of Numerical Land Surface Simulations to Model Physics, Parameters, and Forcing Matthew Rodell and Hiroko Kato, Hydrological Sciences Branch Background and History Numerical Land Surface Models (LSMs) use physical and empirical parameterizations to simulate the redistribution of water (from precipitation) and energy (from solar radiation) after they reach the land surface. They are valuable for water and energy cycle research, as components of weather and climate prediction models, and for water resource applications. LSMs have become abundant and highly sophisticated since they were introduced nearly four decades ago, but their output has failed to converge towards a consensus depiction of reality. Addressing this matter is complicated by the huge number of possible combinations of LSMs, parameters (e. g. , soils), and products available to force the models (e. g. , precipitation). Our Objective is to: Compare the impacts of LSM physics, parameters, and forcing on three output fields (evapotranspiration, sensible heat flux, and top layer soil moisture), towards the eventual goal of developing an intelligent strategy for improving realism and accuracy. Method A set of comparison experiments used of high quality datasets from field sites of the WCRP/GEWEX Coordinated Enhanced Observing Period (CEOP) initiative (Figure 1). Land cover, soil, and elevation parameters, and precipitation and downward radiation forcing data were then varied one at a time to test their influence on simulated evapotranspiration, sensible heat flux, and top layer soil moisture. Results from 96 total experiments were compared to assess sensitivity, and were also evaluated against field observations to gauge the potential for simulating reality given a reasonable set of inputs. Results and Discussion Evapotranspiration seems to be most sensitive to precipitation, land cover, and radiation (in that order); sensible heat flux to radiation, precipitation, and land cover; and soil moisture to precipitation, soil, and land cover. The three LSMs’ potential for simulating reality was fair for evapotranspiration, good for sensible heat flux (but problematic given its strong sensitivity to the inputs), and poor for soil moisture. These results emphasize that improving the LSMs themselves, and not just the inputs, will be essential for accurate simulation of surface water and energy processes. Terms: evapotranspiration-water lost from an area through the combined effects of evaporation from the ground surface and transpiration from the vegetation soil moisture-moisture contained in the soil above the water table heat flux-the flow rate of heat across or through a material.

Field Sites Selected for Evaluation of LSMs Tongyu Bondville (44º 25’N, 122º 52’E) (40 0'22. 356"N, 88 17'25. 476”W) Tumbarumba Lindenberg (35 39’ 20. 6’’S, 148° 09’ 07. 5”E) (52° 10'01" N, 14° 07'27" E)

Sensitivity (mm/month) Sensitivity of Numerical Land Surface Simulations to Model Physics, Parameters, and Forcing Sensitivity of Modeled Evapotranspiration Tongyu Lindenberg Bondville Tumbarumba Season Figure 2. Sensitivity of simulated seasonal evapotranspiration (mm/month) to parameter and forcing inputs and choice of land surface model. Results show that the simulations are more sensitive to the physics and calibration of the chosen land surface scheme than the input elevation, soil types, and vegetation parameters, and the precipitation and radiation forcing. Key Result: The land surface scheme itself is the dominant influence on modeled land surface states and fluxes, not the input parameters or forcing.
