Implementing the FHWA Quick Response Freight Model in


 Make use")


- Slides: 21
Implementing the FHWA Quick Response Freight Model in the Twin Cities Steve Wilson and Jonathan Ehrlich SRF Consulting Group, Inc. Dan Beagan Cambridge Systematics, Inc. Presented to Tenth Transportation Research Board Planning Applications Conference
Twin Cities Regional Freight Planning Model n Objectives n Approach/Methodology n Calibration Considerations n Applications
Objectives of the Project n n Improve New Regional Travel Demand Models Better Reflect Impact of Trucks on Traffic Flow Lay Groundwork for Multimodal Freight Analysis and Modeling Connect to Statewide Freight Plan
Approach n n n Based on FHWA Quick Response Freight Manual (1996) Make use of local data Make use of limited resources
Zonal Data • Employment Categories: n n Agriculture, Mining, Construction Manufacturing, Transportation, Communication, Utilities, Wholesale Trade Retail Trade Office and Services
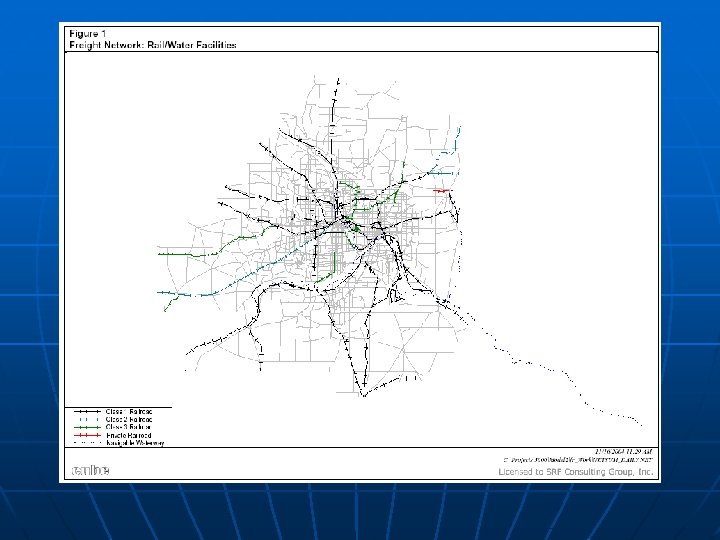
Zonal Data n Employment Data • Census vs. ES 202 n Freight Facility Inventory • Quality Control Issues
Network Data n Highways • • • n Prohibitions Grade Vehicle Classification Counts Navigable Waterways • Terminal Locations • Locks and Dams n Railways • At-Grade Crossings • Intermodal Terminals
Other Data n Freight Analysis Framework • National Freight Flow Database • Growth Rates for External Trips n External Origin-Destination Survey • Distribution of External Trips
Other Data n Light Commercial Vehicles • In the regional model (large portion of NHBW trips) • Difficult to quantify either in vehicle classification counts or in home-interview surveys • Mn. DOT Light Commercial Vehicle Study, 1999
Four Step Model: Trip Generation n By Vehicle Classification from QRFM • Single Unit • Combination • ‘Light Commercial’ n n n Function of Employment Type External Trips based on External Station Vehicle Classification Special Generator Capability
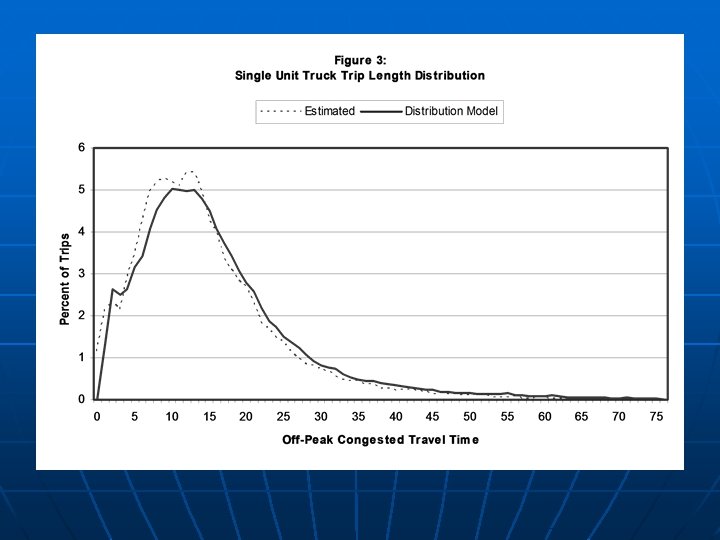
Four Step Model: Trip Distribution n Default gravity model friction factor curves from QRFM Modify trip table using matrix estimation Adjusted default curves based on estimated matrix
Four Step Model: Time of Day n n n Matches 24 time periods from Regional Model Constant factors for each time period for each vehicle classification Based on 24 -hour vehicle classification count data
Four Step Model: Assignment n Regional Model Assignment • Equilibrium Assignment • 24 Time Periods n Five Assignment Purposes • SOV, LCV, HOV, SU, CMB n Three Paths • SOV/LCV, HOV, Truck n Passenger Car Equivalency
Validation n Highway Link Volumes n VMT
Calibration Considerations n Data Availability • Vehicle Classification • Internal Origin-Destination • Trip Length Distribution • External Station Data • Commodity Data n n Concurrent Regional Model Calibration Regional Scope
Applications n Forecasting Truck Traffic • Pavement Design • Development Impacts n System Level Responses • Modal Shift Impacts • Value of Time/Benefit-Cost n n Truck Impacts on Congestion Grade Crossing Analysis
Recommendations for Further Improvement n Commercial Vehicle Tracking Survey n National/Multi-State Commodity Flow Model n External Truck Intercept Survey n Vehicle Classification Data
Questions?