
Implementing Lean Analytics 400 pages in 30 minutes














- Slides: 34
Implementing Lean Analytics 400+ pages in 30 minutes http: //leananalyticsbook. com
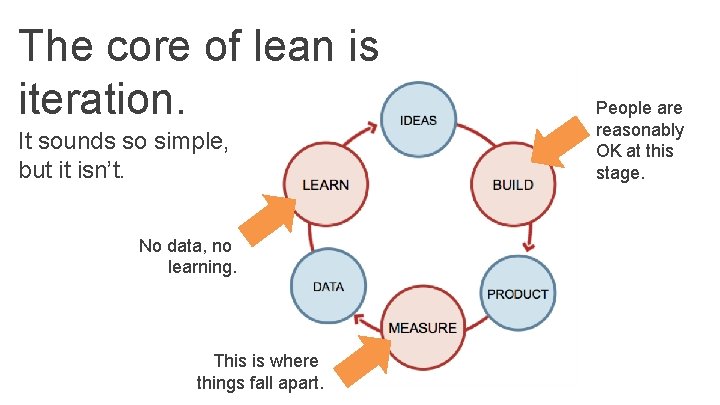
The core of lean is iteration. It sounds so simple, but it isn’t. No data, no learning. This is where things fall apart. People are reasonably OK at this stage.
So what do we measure, when?
Be intellectually honest with yourself. Don’t ignore your gut and instincts, but don’t be completely driven by them either.
First, let’s define analytics.
Analytics is the measurement of movement towards business goals.
The golden rule of metrics
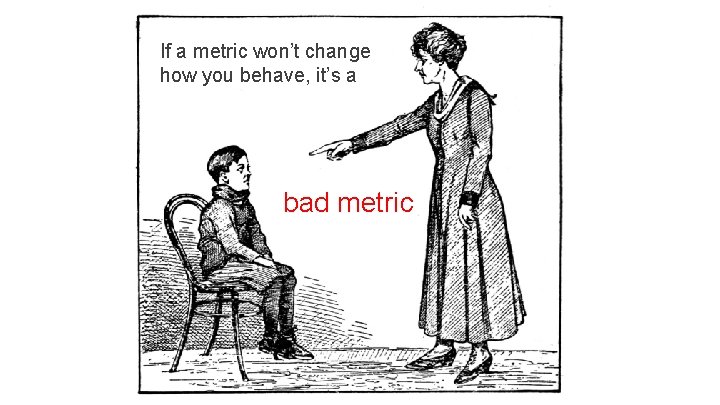
If a metric won’t change how you behave, it’s a bad metric
Let’s look at a few types of metrics. I can’t cover them all, but I think these ones will resonate with you.
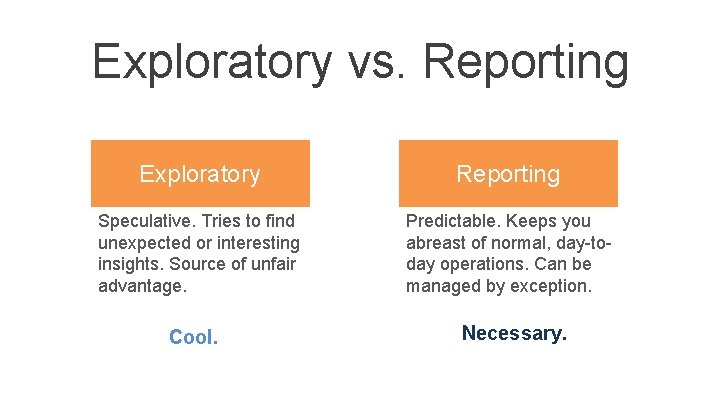
Exploratory vs. Reporting Exploratory Reporting Speculative. Tries to find unexpected or interesting insights. Source of unfair advantage. Predictable. Keeps you abreast of normal, day-today operations. Can be managed by exception. Cool. Necessary.
Digging into the data for answers • • • Started as Circle of Friends Leveraged Facebook early Grew to 10 M users ENGAGEMENT SUCKED
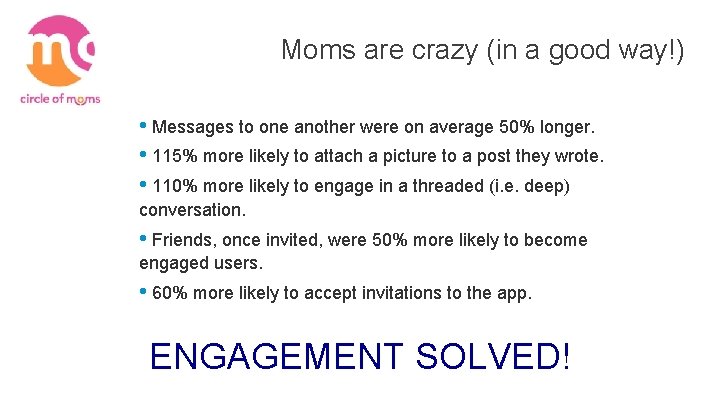
Moms are crazy (in a good way!) • Messages to one another were on average 50% longer. • 115% more likely to attach a picture to a post they wrote. • 110% more likely to engage in a threaded (i. e. deep) conversation. • Friends, once invited, were 50% more likely to become engaged users. • 60% more likely to accept invitations to the app. ENGAGEMENT SOLVED!
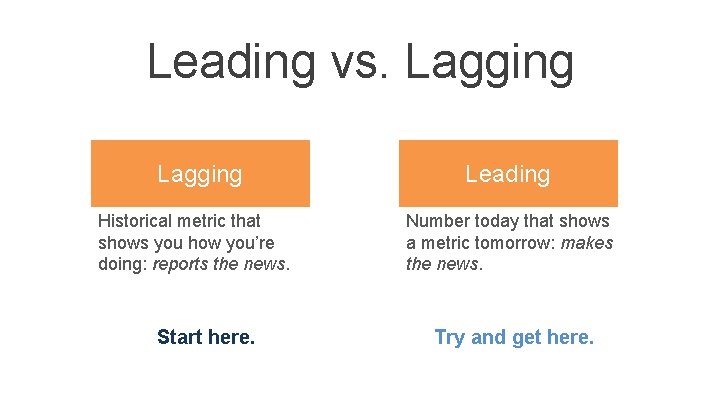
Leading vs. Lagging Historical metric that shows you how you’re doing: reports the news. Start here. Leading Number today that shows a metric tomorrow: makes the news. Try and get here.
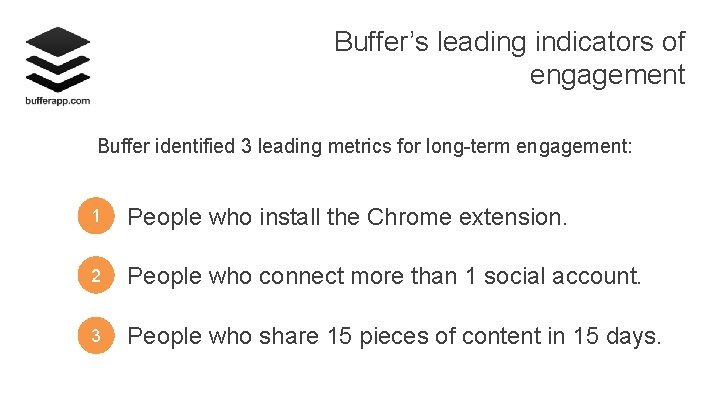
Buffer’s leading indicators of engagement Buffer identified 3 leading metrics for long-term engagement: 1 People who install the Chrome extension. 2 People who connect more than 1 social account. 3 People who share 15 pieces of content in 15 days.
Lean Analytics Stages
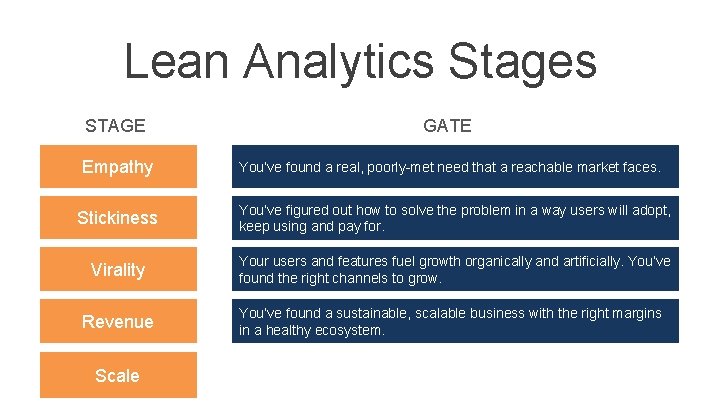
Lean Analytics Stages STAGE GATE Empathy You’ve found a real, poorly-met need that a reachable market faces. Stickiness You’ve figured out how to solve the problem in a way users will adopt, keep using and pay for. Virality Your users and features fuel growth organically and artificially. You’ve found the right channels to grow. Revenue Scale You’ve found a sustainable, scalable business with the right margins in a healthy ecosystem.
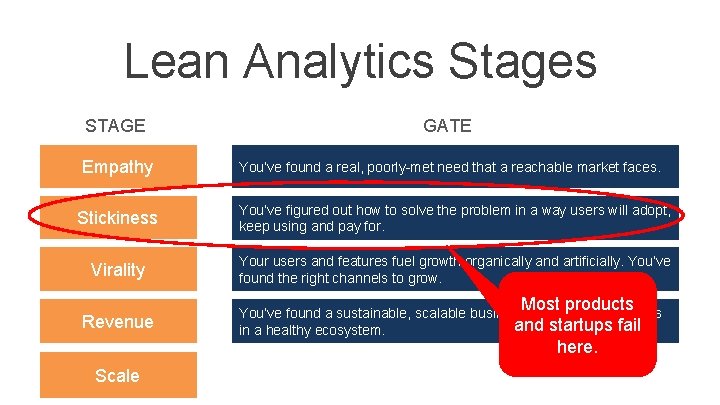
Lean Analytics Stages STAGE GATE Empathy You’ve found a real, poorly-met need that a reachable market faces. Stickiness You’ve figured out how to solve the problem in a way users will adopt, keep using and pay for. Virality Your users and features fuel growth organically and artificially. You’ve found the right channels to grow. Revenue Most products You’ve found a sustainable, scalable business with the right margins and startups fail in a healthy ecosystem. here. Scale
Business Models
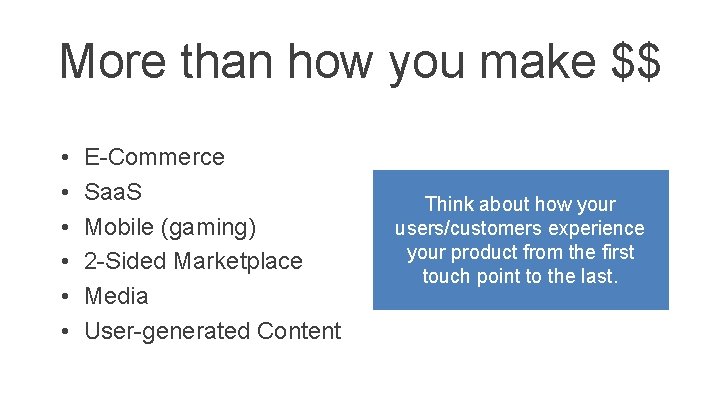
More than how you make $$ • • • E-Commerce Saa. S Mobile (gaming) 2 -Sided Marketplace Media User-generated Content Think about how your users/customers experience your product from the first touch point to the last.
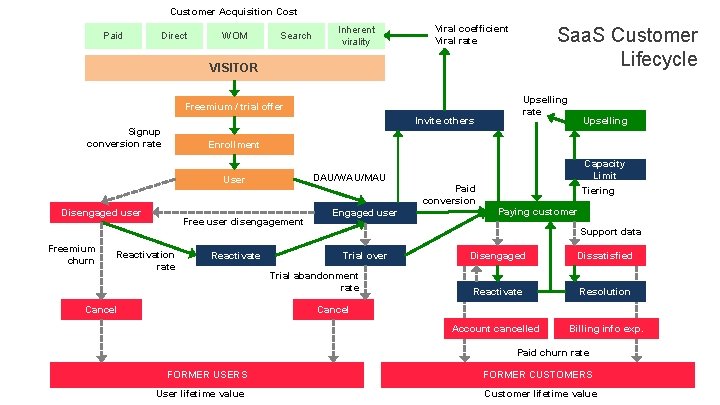
Customer Acquisition Cost Paid Direct WOM Search Inherent virality Viral coefficient Viral rate Saa. S Customer Lifecycle VISITOR Upselling rate Freemium / trial offer Invite others Signup conversion rate Enrollment DAU/WAU/MAU User Disengaged user Freemium churn Upselling Free user disengagement Reactivation rate Reactivate Cancel Engaged user Capacity Limit Paid conversion Tiering Paying customer Support data Trial over Trial abandonment rate Disengaged Dissatisfied Reactivate Resolution Account cancelled Billing info exp. Cancel Paid churn rate FORMER USERS User lifetime value FORMER CUSTOMERS Customer lifetime value
Does recurring revenue work for everyone? • Stage: Revenue / Scale • Model: Saa. S • Recruitment marketing & assessment software • Switched business models from monthly recurring revenue to pay-per-job posting
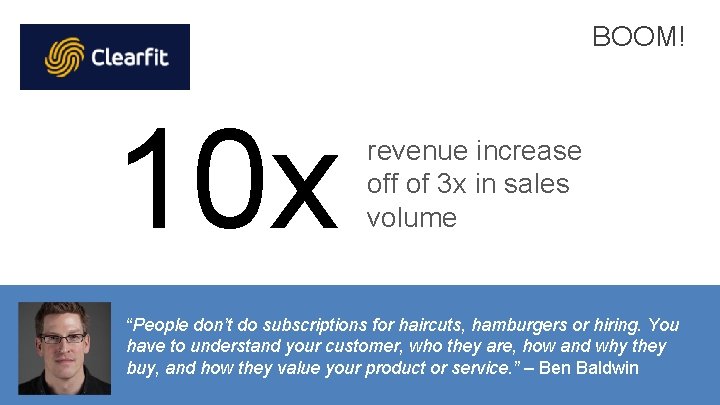
BOOM! 10 x revenue increase off of 3 x in sales volume “People don’t do subscriptions for haircuts, hamburgers or hiring. You have to understand your customer, who they are, how and why they buy, and how they value your product or service. ” – Ben Baldwin
The One Metric That Matters
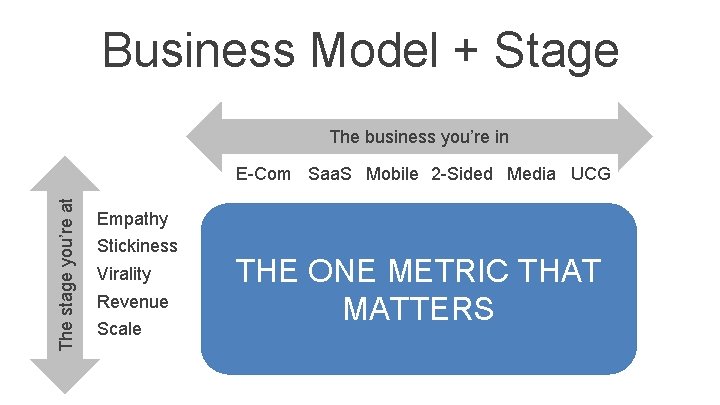
Business Model + Stage The business you’re in The stage you’re at E-Com Saa. S Mobile 2 -Sided Media UCG Empathy Stickiness Virality Revenue Scale THE ONE METRIC THAT MATTERS
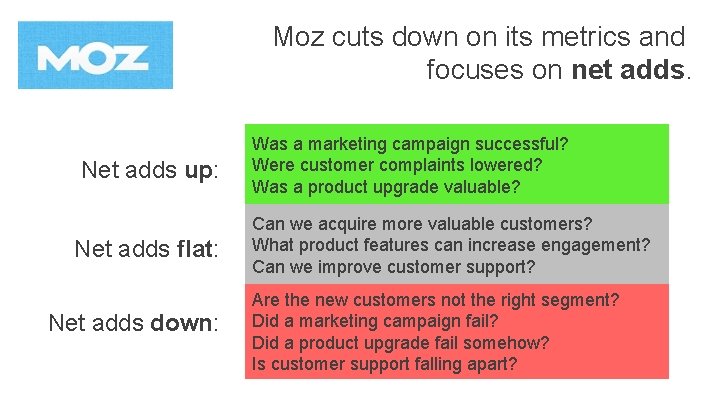
Moz cuts down on its metrics and focuses on net adds. Net adds up: Net adds flat: Net adds down: Was a marketing campaign successful? Were customer complaints lowered? Was a product upgrade valuable? Can we acquire more valuable customers? What product features can increase engagement? Can we improve customer support? Are the new customers not the right segment? Did a marketing campaign fail? Did a product upgrade fail somehow? Is customer support falling apart?
If only life were that simple, eh? It’s not, but still, the goal is to simplify as much as possible.
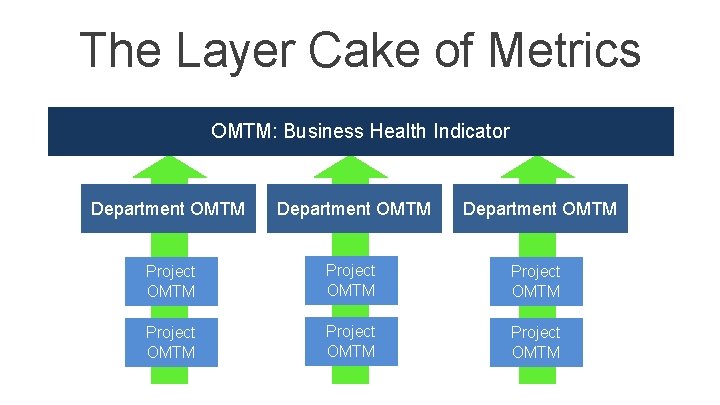
The Layer Cake of Metrics OMTM: Business Health Indicator Department OMTM Project OMTM Project OMTM
Metrics are like squeeze toys.
The Lean Analytics Cycle
TIME TO EXPERIMENT Identify a key business problem, pick the OMTM, draw a line in the sand get started.
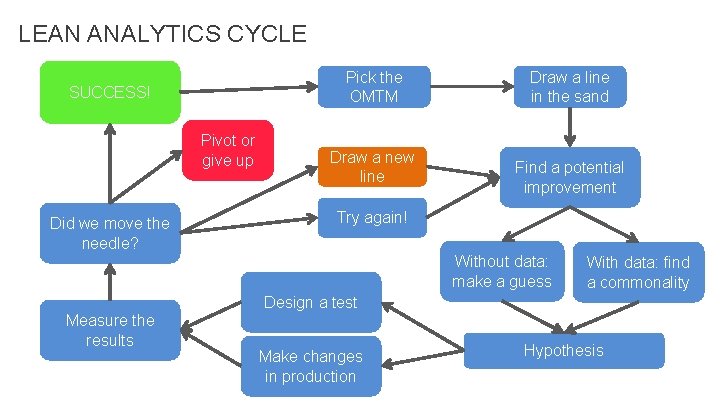
LEAN ANALYTICS CYCLE Pick the OMTM SUCCESS! Pivot or give up Did we move the needle? Draw a new line Draw a line in the sand Find a potential improvement Try again! Without data: make a guess With data: find a commonality Design a test Measure the results Make changes in production Hypothesis
Once, a leader convinced others in the absence of data.
Now, a leader knows what questions to ask.
THANK YOU! Benjamin Yoskovitz byosko@gmail. com @byosko http: //instigatorblog. com Alistair Croll acroll@gmail. com @acroll http: //solveforinteresting. com