Implementing Applied Behavior Analysis at Scales of Social

Implementing Applied Behavior Analysis at Scales of Social Importance: PBIS Rob Horner University of Oregon Frustra d Prou Con vinc ed ted

Main Messages • The strengths of Applied Behavior Analysis are: • Practical • Data-based • Theory driven

Main Messages • The need to define “what works” will be unending • But we already know a lot that is NOT being used • The need to define how to deliver what works with sustainability and scalability is forcing new considerations • Define evidence-based practices with precision • Define “core features” that EBPs should produce • Knowledge/ skill • New feature of a setting • Emphasis on fidelity • As part of the IV, not just a DV ion of t p o d a d e t The limi ociety is s o r c a ABA o our t t r a p n i due ding n e t t a n i t restrain tation n e m e l p m to i variables • Emphasis on efficiency • Emphasis on “implementation” as a unique technology
")
Goals Lessons Learned from Efforts to Implement School-wide Positive Behavioral Interventions and Supports (SWPBIS) • Participants will define three themes that are shaping implementation of ABA within Education • Participants will define the role of “core features” in the definition of effective practices, and the importance of defining core features for large scale implementation • Participants will define the role of “implementation fidelity measurement” both as a dependent variable and as an independent variables in large scale implementation • Participants will define the role of “efficiency” in adoption of new practices.

Themes Affecting Adoption of Behavior Analysis in Education Multi-tiered Systems, Evidence-based Practices, Implementation Science Evidence-based Practices Performance Assessment (Fidelity) rs ive Dr cy en et mp Decision Support Data System rs ive Effective Implementation Dr Co Facilitative Administration n tio za Multi-tiered Systems of Support ni Selection Systems Intervention ga Training Or Coaching Leadership Drivers Technical Adaptive Implementation Science

What is School-wide Positive Behavior Intervention and Support? • School-wide PBIS is: • A multi-tiered framework for establishing the social culture and behavioral supports needed for a school achieve behavioral and academic outcomes for all students. • Evidence-based features of SWPBIS • • Prevention Define and teach positive social expectations Acknowledge positive behavior Arrange consistent consequences for problem behavior On-going collection and use of data for decision-making Continuum of intensive, individual intervention supports. Implementation of the systems that support effective practices
 • The social culture of a school")
School-wide Positive Behavioral Interventions and Supports (SWPBIS) • The social culture of a school matters. • A continuum of supports that begins with the whole school and extends to intensive, wraparound support for individual students and their families. • Effective practices with the systems needed for high fidelity and sustainability • Multiple tiers of intensity

SCHOOL-WIDE POSITIVE BEHAVIOR SUPPORT ~5% ~15% Primary Prevention: School-/Classroom. Wide Systems for All Students, Staff, & Settings 27 Tertiary Prevention: Specialized Individualized Systems for Students with High-Risk Behavior Secondary Prevention: Specialized Group Systems for Students with At-Risk Behavior Main Ideas: 1. Invest in prevention first 2. Multiple tiers of support intensity 3. Early/rapid access to ~80% of Students support

Experimental Research on SWPBIS Bradshaw, C. P. , Koth, C. W. , Thornton, L. A. , & Leaf, P. J. (2009). Altering school climate through school-wide Positive Behavioral Interventions and Supports: Findings from a group-randomized effectiveness trial. Prevention Science, 10(2), 100 -115 Bradshaw, C. P. , Koth, C. W. , Bevans, K. B. , Ialongo, N. , & Leaf, P. J. (2008). The impact of school-wide Positive Behavioral Interventions and Supports (PBIS) on the organizational health of elementary schools. School Psychology Quarterly, 23(4), 462 -473. Bradshaw, C. P. , Mitchell, M. M. , & Leaf, P. J. (2010). Examining the effects of School-Wide Positive Behavioral Interventions and Supports on student outcomes: Results from a randomized controlled effectiveness trial in elementary schools. Journal of Positive Behavior Interventions, 12, 133 -148. Bradshaw, C. P. , Reinke, W. M. , Brown, L. D. , Bevans, K. B. , & Leaf, P. J. (2008). Implementation of school-wide Positive Behavioral Interventions and Supports (PBIS) in elementary schools: Observations from a randomized trial. Education & Treatment of Children, 31, 1 -26. Bradshaw, C. , Waasdorp, T. , Leaf. P. , (in press). Effects of School-wide positive behavioral interventions and supports on child behavior problems and adjustment. Pediatrics. Horner, R. , Sugai, G. , Smolkowski, K. , Eber, L. , Nakasato, J. , Todd, A. , & Esperanza, J. , (2009). A randomized, wait-list controlled effectiveness trial assessing school-wide positive behavior support in elementary schools. Journal of Positive Behavior Interventions, 11, 133 -145. Horner, R. H. , Sugai, G. , & Anderson, C. M. (2010). Examining the evidence base for school-wide positive behavior support. Focus on Exceptionality, 42(8), 1 -14. Ross, S. W. , Endrulat, N. R. , & Horner, R. H. (2012). Adult outcomes of school-wide positive behavior support. Journal of Positive Behavioral Interventions. 14(2) 118 -128. Waasdorp, T. , Bradshaw, C. , & Leaf , P. , (2012) The Impact of Schoolwide Positive Behavioral Interventions and Supports on Bullying and Peer Rejection: A Randomized Controlled Effectiveness Trial. Archive of Pediatric Adolescent Medicine. 2012; 166(2): 149 -156 SWPBIS E x perimental ly Related to: 1. Reducti on in prob lem behav 2. Increas ior ed academ ic perform 3. Improve ance d perceptio n of safety 4. Reducti on in bully ing behav 5. Improve iors d organiza tional effic 6. Reducti iency on in staff turnover 7. Increas ed percept ion of teac 8. Improve her efficac d Social E y motional c ompetenc e

Schools using PBIS 21, 278 August, 2015 25000 22500 20000 17500 15000 12500 10000 7500 5000 2500 01 02 03 04 05 06 07 08 09 10' 11' 12' 13' 14' 15' 16' 17' 18'
 by State August , 2015 16 States")
Number of Schools Implementation SWPBIS (Tier I) by State August , 2015 16 States with more than 500 schools

Proportion of Schools Implementing SWPBIS by State August, 2015 13 States with at least 40% of all schools using PBIS

Lessons Learned • Distinguish between • Practices • Core features • Valued outcomes

Defining a “Practice/ Program/ Intervention” • A “practice” is a procedure, or set of procedures, designed for use in a specific context, by individuals with certain skills/features, to produce specific changes in context or performance patterns that result in valued outcomes for specific individuals. ------------------------ • Operationally defined procedures • What you do • Target population/ Context • For whom • Implementer Characteristics • By whom • Defined outcomes • Valued impact • ------------------------ • (Evidence of functional relation) Procedure: What you do Core Feature: Impact on Setting/Context Outcome: Impact on behavior • Procedures Core Features Valued outcome Flay et al. , 2005

Tier I PBIS Core Features System to Acknowledge Behavior School-wide Expectations Leadership Team Consequences for Problem Behavior Tier I PBIS Classroom Systems Data and Decision System Bully Prevention Family Engagement


Practices Core Features Effective Practice Examples ------First Step Direct Instruction Effective Practice Technology Core Features Pivotal Response Training Science PECS FCT Valued Outcomes Values

Implications • Programs Combine “Practice” and “Core Feature” • Certification of Practice/Program • Certification of Trainers/Experts • Limits scalability • Distinguishing “Practice” from “Core Feature” • Measure fidelity by assessing if “core feature” is in place • Provide examples of multiple practices (ways) to achieve core features • Focus on “contextual fit” variables that guide selection of effective practices. • Research • Document functional relation between core feature and valued outcome • Document functional relation between practice and core feature • Document functional relation between implementation process and fidelity of practice.

Lessons Learned • Anticipate implementation error patterns

SCHOOL-WIDE POSITIVE BEHAVIOR SUPPORT ~5% ~15% Primary Prevention: School-/Classroom. Wide Systems for All Students, Staff, & Settings ~80% of Students 27 Tertiary Prevention: Specialized Individualized Systems for Students with High-Risk Behavior Secondary Prevention: Specialized Group Systems for Students with At-Risk Behavior

SCHOOL-WIDE POSITIVE BEHAVIOR SUPPORT Primary Prevention: School-/Classroom. Wide Systems for All Students, Staff, & Settings 27 Tertiary Prevention: Specialized Individualized Systems for Students with High-Risk Behavior Secondary Prevention: Specialized Group Systems for Students with At-Risk Behavior

School-Wide Positive Behavior Support Primary Prevention: School-/Classroom. Wide Systems for All Students, Staff, & Settings ~5% ~15% Tertiary Prevention: Specialized Individualized Systems for Students with High-Risk Behavior Secondary Prevention: Specialized Group Systems for Students with At-Risk Behavior 24 ~80% of Students

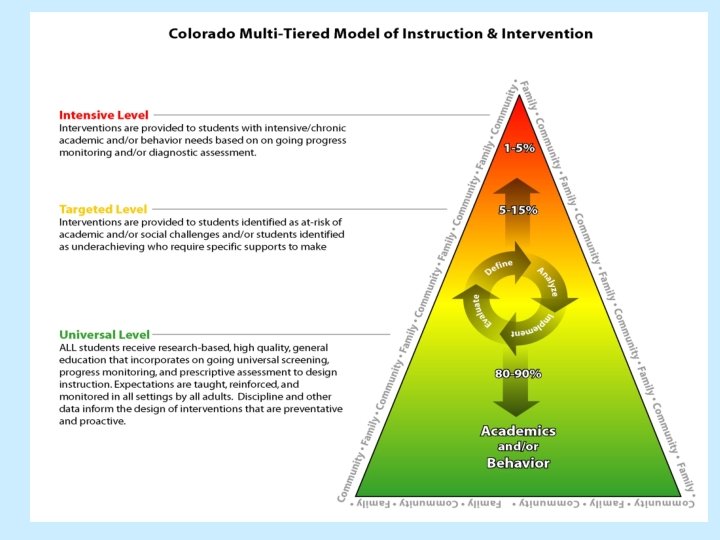
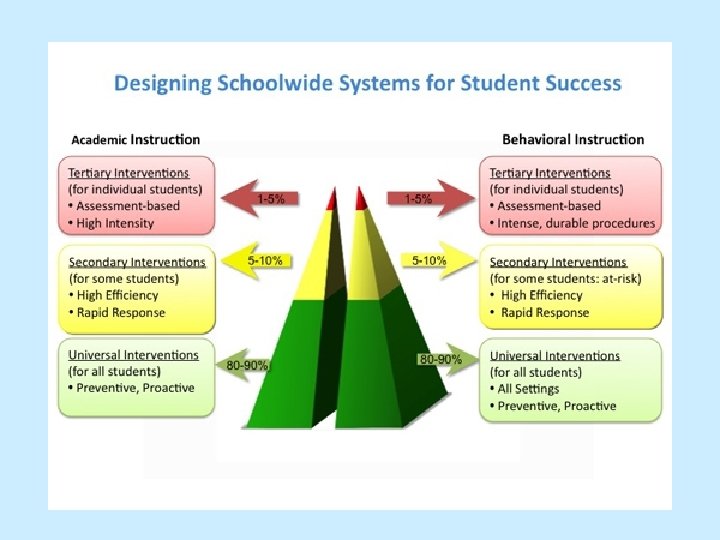
Multi-tier Model Academic Systems Behavioral Systems Intensive, Individual Interventions • Individual Students • Assessment-based • High Intensity • Of longer duration 5 -10% Targeted Group Interventions • Some students (at-risk) • High efficiency • Rapid response Universal Interventions • All students • Preventive, proactive 1 -5% 80 -90% Intensive, Individual Interventions • Individual Students • Assessment-based • Intense, durable procedures 1 -5% 5 -10% 80 -90% Targeted Group Interventions • Some students (at-risk) • High efficiency • Rapid response Universal Interventions • All settings, all students • Preventive, proactive Dona Meinders, Silvia De. Ruvo; West. Ed, California Comprehensive Center

Academic Continuum PBIS Is Integrated Continuum Mar 10 2010 Behavior Continuum

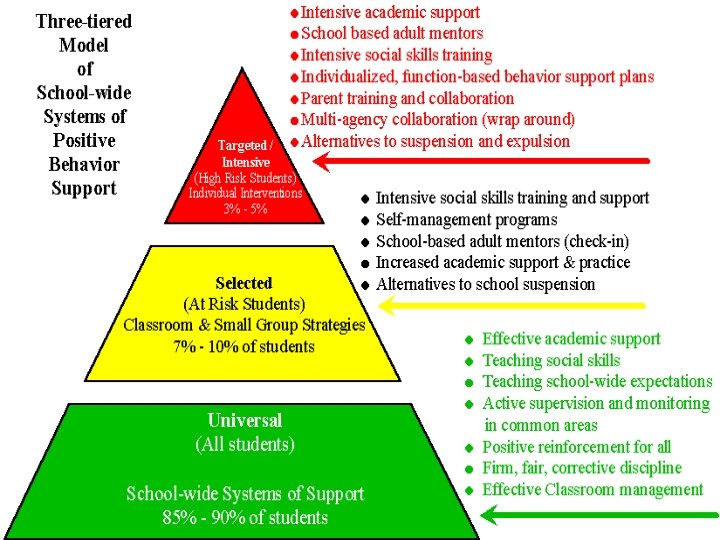
Examples of Behavior Supports Intensive Intervention • Individualized, functional assessment based behavior support plan Universal Prevention • Identify expectations • Teach • Monitor • Acknowledge • Correct Targeted Intervention • Check-in, Checkout • Social skills training • Mentoring • Organizational skills • Self-monitoring Continuum of Supports

Intensive Targeted Universal George Sugai Few Some All RTI Continuum of Support for ALL

Tier III For Approx 5% of Students Core + Supplemental + Intensive Individual Instruction …to achieve benchmarks 1. Where is the students performing now? 2. Where do we want him to be? 3. How long do we have to get him there? 4. What supports has he received? 5. What resources will move him at that rate? Tier III Effective if there is progress (i. e. , gap closing) towards benchmark and/or 32 progress monitoring goals. 32

Dr. Laura Riffel

Bethel’s Comprehensive Secondary Counseling Program Outcomes Individualized Targeted Te am s Da ta s Sc ho ol emic avio Acad Beh s am Te ta Da r (P BS) En ol ho Sc gag em en t Universal

Positive Behavior Support Universal School-Wide Data Collection and Analyses School-Wide Prevention Systems (rules, routines, arrangements) Targeted Group Interventions In Simple Student Interventions t en m Intensive te rv e ss se Interviews, Questionnaires, etc. nt io As n Analyze Student Data Observations and ABC Analysis Multi-Disciplinary Assessment & Analysis Complex Individualized Interventions Team-Based Wraparound Interventions Dr. Terry Scott: Adapted from George Sugai, 1996 © Terrance M. Scott, 2001

Tier I: Universal/Prevention for All Coordinated Systems, Data, Practices for Promoting Healthy Social and Emotional Development for ALL Students Tier 2: Early Intervention for Some Coordinated Systems for Early Detection, Identification, and Response to Mental Health Concerns Tier 3: Intensive Interventions for Few Individual Student and Family Supports Adapted from the ICMHP Interconnected Systems Model for School Mental Health, which was originally adapted from Minnesota Children’s Mental Health Task Force, Minnesota Framework for a Coordinated System to Promote Mental Health in Minnesota; center for Mental Health in Schools, Interconnected Systems for Meeting the Needs of All Youngsters.

Tertiary Prevention: Specialized Individualized Systems for Students with High. Risk Behavior ῀5 ῀15 Secondary Prevention: Specialized Group Systems for Students with At-Risk Behavior Primary Prevention: School-/Classroom. Wide Systems for All Students, Staff, & Settings School-wide Positive Behavioral Interventions and Supports Students will move up and down through services as needed ῀80

Math Remember that the multiple tiers of support refer to our SUPPORT not Students. Avoid creating a new disability labeling system. Behavior Health Reading

Lesson Learned • Measure “fidelity of implementation” • As a DV to assess implementation practices • As an IV to improve level of adoption.

The role of fidelity measures • Measure if a practice is being used as intended. • “Certify” implementation impact…not trainers or materials • Measuring fidelity as a Dependent Variable • For research or evaluation purposes • Need for high-quality measures of fidelity • Measuring fidelity as part of the Independent Variable • To assist implementation, sustainability and continuous improvement • Need for high-efficiency measures of fidelity

Fidelity Measures within SWPBIS ~5% ~15% ~80% of Students

Using Fidelity Data • Assessing the extent to which we are implementing what we claim to implement • Use of the data for decision-making

Sub-scale report

Sub-subscale report Tier I Teams Implementation Evaluation Tier II Teams Interventions Evaluation Tier III Teams Resources Assessment Support plan Monitoring and adaptation

Item Report

Action Planning 0 1. Team to propose teaching template and Fall teaching schedule at Feb 16 Faculty meeting. Alan Feb 16

1800 1600 1400 0 Alabama Alaska Arizona Arkansas California Colorado Connecticut Delaware District of Columbia Florida Georgia Guam Hawaii Idaho Illinois Indiana Iowa Kansas Kentucky Louisiana Maine Maryland Massachusetts Michigan Minnesota Mississippi Missouri Montana Nebraska Nevada New Hampshire New Jersey New Mexico New York North Carolina North Dakota Ohio Oklahoma Oregon Pennsylvania Rhode Island South Carolina South Dakota Tennessee Texas Utah Vermont Virginia Washington Wisconsin Wyoming Tier I Fidelity by School by State TFI, Bo. Q, SET, TIC Schools Implementing SWPBIS by State in 2014 -15 (Tier 1) Count of Schools Using PBIS Count of Schools Measuring Fidelity Met. Tier 1 Fidelity. Ctiterion Reporting. Tier 1 Fidelity 10, 705 schools with measured Tier I fidelity 1200 Count of Schools Achieving Fidelity 1000 800 600 400 200 Implementing. PBIS

The Effects of Monitoring Fidelity and Impact on Individual Behavior Support Sarah Pinkelman George Mason University

Research Question • Is there a functional relation between introduction of daily measures of BSP fidelity and impact (via the Individual Student Information System: ISIS), and change in (a) the fidelity of BSP implementation and (b) student behavior?

Participants • Three Teacher-student dyads • Each student nominated due to on-going problem behavior • Each teacher nominated due to difficulty implementing the behavior support plan

Baseline ISIS-SWIS Percentage BSP Components Observed Fidelity

Observed Treatment Fidelity & Academic Engagement ISIS-SWIS Baseline Observed Fidelity Percent 10 s Intervals AE Percentage BSP Components Academic Engagement

Baseline ISIS-SWIS Fidelity Academic Engagement Percentage 10 s Intervals Percentage BSP Components Problem Behavior

Lesson Learned • Focus on “efficiency” of practices • • Time Money Expertise of personnel Match with existing organizations/ systems. • 1. Efficiency for adoption • 2. Efficiency for sustained performance NOTE: Differences in Efficiency across Multiple Tiers of Support

Time Cost of a Discipline Referral (Avg. 45 minutes per incident for student 30 min for Admin 15 min for Teacher) 1000 Referrals/yr 500 Hours 2000 Referrals/yr 1000 Hours 250 Hours 500 Hours Student Time 750 Hours 1500 Hours Totals 1500 Hours 3000 Hours Administrator Time Teacher Time

Pre PBIS 3 Year 1 Year 2 Year

What does a reduction of 850 office referrals and 25 suspensions mean? Kennedy Middle School Savings in Administrative time Savings in Student Instructional time 13, 875 minutes 231 hours 43, 650 minutes 728 hours 29, 8 -hour days 121, 6 -hour school days ODR = 15 min Suspension = 45 min ODR = 45 min Suspension = 216 min

Lesson Learned • Use Implementation Science • Implementation Drivers • Stages of Implementation • Improvement Cycles

Implementation Science Frameworks WHO WHEN WHAT Teams Stages HOW Drivers Interventions HOW Cycles
 Performance Assessment (Fidelity) Dr iv cy")
Successful Student Outcomes Program/Initiative/Framework (e. g. Rt. I) Performance Assessment (Fidelity) Dr iv cy ete n mp Co rs ive Dr Implementation Drivers Facilitative Administration on ati niz Selection ga Training Systems Intervention Or ers Coaching Decision Support Data System Leadership Adaptive Technical © Fixsen & Blase, 2008

Stages of Implementation occurs in stages: • • • Exploration Installation Initial Implementation Full Implementation Innovation Sustainability Fixsen, Naoom, Blase, Friedman, & Wallace, 2005 2 – 4 Years

Stages of Implementation Focus Should we do it Stage Exploration/ Adoption Decision regarding commitment to adopting the program/practices and supporting successful implementation. Installation Set up infrastructure so that successful implementation can take place and be supported. Establish team and data systems, conduct audit, develop plan. Initial Implementation Try out the practices, work out details, learn and improve before expanding to other contexts. Elaboration Expand the program/practices to other locations, individuals, times- adjust from learning in initial implementation. Continuous Improvement/ Regeneration Make it easier, more efficient. Embed within current practices. Getting it right Making it better Description Steve Goodman

Scaling up School-wide Positive Behavioral Interventions and Supports: The Experiences of Seven States with Documented Success Rob Horner, Don Kincaid, George Sugai, Tim Lewis, Lucille Eber, Susan Barrett, Celeste Rossetto Dickey, Mary Richter, Erin Sullivan, Cyndi Boezio, Nancy Johnson Exploration Leadership Team Funding Visibility Political Support Policy Training Coaching Expertise Evaluation Demos Installation Initial Imp Full Imp Innovation Sustainability

Exploration and Adoption Installation What were critical issues that confronted the If you do, how was team as it began your first leadership to install systems team developed? changes? Leadership Team (coordination) Do you have a state leadership team? Who were members? Who supported/lead the team through the exploration process? Was any sort of selfassessment completed (e. g. the PBIS Implementation Blueprint Assessment)? What was the role of State agency personnel in the exploration phase? Initial Implementation Full Implementation Innovation and sustainability What were specific activities the team did to ensure success of the initial implementation efforts? Did the team change personnel or functioning as the # of schools/districts increased? What has the Leadership team done to insure sustainability? In what areas is the State “innovating” and contributing to the research and practice of PBIS (e. g. linking PBIS with literacy or math)?

Descriptive Summary: Oregon 700 Count of Schools Implementing PBIS 600 500 400 300 200 100 0 1995 -96 1996 -97 1997 -98 1998 -99 1999 -00 2000 -01 2001 -02 2002 -03 2003 -04 2004 -05 2005 -06 2006 -07 2007 -08 2008 -09 2009 -10 Exploration / Installation / Initial Imp /Full Imp & Innovate

Descriptive Summary: Missouri 700 600 500 400 300 200 100 0 97 -98 98 -99 99 -00 00 -01 01 -02 02 -03 03 -04 04 -05 05 -06 06 -07 07 -08 08 -09 09 -10 10 -11 Exploration / Installation /Initial Imp / Full Imp & Innovate

Descriptive Summary: North Carolina 1000 900 800 700 600 500 400 300 200 100 0 00 -01 01 -02 Exploration / 02 -03 03 -04 04 -05 Installation 06 -07& Full 07 -08 /05 -06 Initial Imp 08 -09 / Innovate 09 -10

Descriptive Summary: Colorado 800 700 600 500 400 300 200 100 0 02 -03 03 -04 04 -05 Exploration / Installation 05 -06 / 06 -07 07 -08 Initial & Full Imp / 08 -09 09 -10 Innovate 10 -11

Descriptive Summary: Florida 1200 1000 800 600 400 200 0 01 -02 02 -03 03 -04 04 -05 Imp 05 -06 06 -07 Exploration/ Installation/ Initial / Full Imp / 07 -08 09 -10 Innovate 08 -09

Descriptive Summary: Maryland 900 800 700 600 500 400 300 200 100 0 Exploration /2001 Installation 2000 2002 1999 / Initial / 2004 Imp 2005 2003 Full 2006 Imp 2007 / Innovate 2009 2008 2010

Descriptive Summary: Illinois 1600 1400 1200 1000 800 600 400 200 0 98 -99 00 -01 Exploration /99 -00 Installation /01 -02 02 -03 Initial 04 -05 Imp 03 -04 05 -06 06 -07 07 -08 08 -09 Imp 09 -10 10 -11 /Full & Innovate

Lessons Learned • Multiple approaches to achieving scaled implementation • Colorado: Started with Leadership Team • Illinois: Started with Leadership Advocates and built team only after implementation expanded. • Missouri: Strong initial demonstrations led to strong state support • All states began with small “demonstrations” that documented the feasibility and impact of SWPBIS. • Only when states reached 100 -200 demonstrations did scaling occur. Four core features needed for scaling: • Administrative Leadership / Support/ Funding • Technical capacity (Local training, coaching, evaluation and behavioral expertise) • Local Demonstrations of feasibility and impact (100 -200) • Evaluation data system (to support continuous improvement) • Essential role of Data: Fidelity data AND Outcome data

Lessons Learned • Scaling is NOT linear • Scaling requires sustainability/ continuous regeneration • Threats to Scaling: • • • Competing initiatives The seductive lure of the “new idea” Leadership turnover Legislative mandates Fiscal constraint Regular Dissemination of Fidelity and Impact data is the best “protective factor” for threats to scaling

Lessons Learned: • Scaling requires planned efficiency • The unit cost of implementation must decrease as the number of adoptions increases. Shift from external trainers to within state/district trainers Use local demonstrations as exemplars Increased coaching capacity can decrease investment in training Improved “selection” of personnel decreases turnover and development costs • Use existing professional development and evaluation resources differently • • • Basic Message: The implementation practices that are needed to establish initial exemplars may be different from the practices used to establish large scale adoption. • Jennifer Coffey, 2008

Priority Effectiveness Data. Based Prob. Solving Valued Outcomes Identifying & Modifying Practices Continuous Regeneration y cit g a p n Ca ildi Bu Co M e n t in as u o ur em u s en t Implementation Mc. Intosh, K. , Kim, J. , Mercer, S. H. , Strickland-Cohen, M. K. , & Horner, R. H. (2015). Variables associated with enhanced sustainability of school-wide positive behavioral interventions and supports. Assessment for Effective Intervention, 40(3), 184 -191. Efficiency

Summary • Implementation of ABA at scale is possible • Consider the cluster of core features needed for scaling • Admin support, Technical capacity, 100 -200 demonstrations • Small demonstrations may be necessary but insufficient • Build in system for adapting the program to fit the local context while retaining the core features. • Consider an implementation plan with established procedures for improving efficiency of implementation • Measure fidelity of implementation as a part of effective implementation. • Sustained implementation requires continuous regeneration • Always emphasize, measure and report on valued outcomes

- Slides: 76