Implemented in Rafeedia Surgical Hospital Students Names Haneen


 Beds")


 and utilization results are summarized in the")


")
) ((Caesarean giving birth room))")


) ((Caesarean giving birth room))")

 Total time (min) Resources")


 and utilization results are summarized in the")


 Simulation is recommended to be applied in other departments in the hospital,")

- Slides: 63
Implemented in Rafeedia Surgical Hospital Students’ Names: Haneen Khoury Nashwa Sharaf Mays Qaradeh Shireen Dawod Supervisors’ Names: Eng. Muhammad Al Sayed Eng. Tamer Haddad
Presentation Contents A. Introduction 1. 2. 3. 4. Objective Case study Methodology Literature review (Simulation) B. Field work 1. 2. 3. Operations Department Delivery Department Emergency Department C. Conclusions and Recommendations
Introduction
Objectives v Establishing a Decision Support System using analytical models to compare alternatives and choosing an optimized one. v. Enable related people to define weakness points that may raise risks and lower quality of services by simulating hospitals current situation. v. Enable the hospital to see the effects of its decisions before implementing it, as it will reduce time, efforts, costs, and risks, using the proposed DSS based on simulation methods.
Case Study v. Project was implemented in Rafedia Surgical Hospital in the following department: 1) Operations Department 2) Delivery Department 3) Emergency Department v. Main problem was beds and rooms utilization ( keeping the quality of service represented by the service and waiting times, and the capacity). v. Simulation Promodel
Methodology v Meeting with Mo. H representatives v. Choosing the hospital v. Field visits to study the system v. Introducing the departments and their interrelations v. Real data collecting v. Analyzing data and building the current models v. Suggesting improved scenarios and simulating them
Literature Review v. Simulation is the attempt to duplicate the features, appearance, and characteristics of a real system. v It is used to estimate the effects of various variables and changes in the systems. v. It provides an alternative approach for problem solving that are very complex mathematically.
Without simulation System Costs With simulation Design phase Implementation phase System stage Operation phase
Field Work
Operations Department General major and minor operations complete awakening and recovery
Description of the process
Assumptions used to build the models : 1. The locations Rooms (capacity =1) Beds (capacity =1) Queues ( infinite capacity) 1. The entities Patients 2. The arrivals Built in terms of the entities, locations, quantities, occurrences and frequencies. 3. The processing Built in terms of the entities, current locations and the operation there in each step, followed with the destinations and rules of the process. 4. Each path in processing building must end with the exit destination.
Results
First Step: Real Data Collection Room 1 in operations department No Date Start time End time (hr: min) Service time (hr: min) Resources numbers Doctors Nursing Others 1 1122010 8: 15 08. 45 0: 30 4 2 3 2 1122010 09. 00 10. 00 1: 00 3 2 3 3 1122010 10. 20 12. 00 1: 40 3 2 2 4 1122010 12. 50 0: 40 2 2 1 5 1122010 01. 00 01. 35 0: 35 2 2 1 6 1422010 09. 00 10. 00 1: 00 1 2 2 7 1422010 10. 25 0: 15 1 2 2 8 1422010 11. 00 12. 00 1: 00 1 2 2
Second Step: Statistical Fitting Analysis determine the most appropriate distributions that represent service time and time between arrivals. Service time Exponential Room 1 Room 3 Room 2 Room 4
Exponential Room 1 Room 3 Arrival rate Room 2 Room 4
Third Step: Establishing the current model v. The model was built using Pro. Model software, in collaboration with Microsoft Visio for drawing department’s layout. v. The simulation model was built taking into account the real sequence of operations. v. The current recovery room contains four beds and is assumed to have an exponential distribution with β equals 17. 5 minutes which is the average time the patient spends in this room.
5 replications 2000 hrs simulation 100 hrs warm up Total Exits Avg. Time in Sys. (hr) 10124 21. 6 Avg. Time Waiting (hr) 19. 97 Avg. Time in Operation (hr) 0. 9963
These two figures show the utilization and the percentage of idle time of the four rooms, respectively 94. 66 88. 68 69. 38 Min 25% 99. 96 36 -37% Max 75% 30. 62 0. 04 11. 32 5. 34
The following figure exactly shows distribution of working and idle periods of time for each room in the department, where the green color represents working periods, and the blue ones shows idle periods. 69. 38% 99. 96% 88. 68% 94. 66% 144. 2 99. 92% 15. 8 47. 95% 33. 4 79. 07% 49. 6 88. 85%
Results
The improved scenarios and their description in the operations department: Operations Department Scenario No. Scenario Name Scenario Description 1 4 main rooms 4 main independent rooms- current situation 2 4 main rooms + 1 stand by room (whole) 1 stand by room holds the load of the whole department 3 4 main rooms + 2 stand by rooms (whole) 2 stand by rooms hold the load of the whole department 4 4 main rooms + 1 stand by room (distributed) 1 stand by room to replace room number 2 only 5 4 main rooms + 2 stand by room 1 to replace room 1 and room 2, stand by by rooms (distributed) room 2 to replace room 3 and room 4
The total entries (number of patients served) and utilization results are summarized in the following table: Current arrivals Utilization Scenario description Total entries Max value is 75% Room 1 Room 2 Room 3 Room 4 Stand by room 1 room 2 1 4 independent rooms 10124 69. 38 99. 96 88. 68 94. 66 _ _ 2 +1 stand by for whole 10224 56. 28 71. 75 71. 89 69. 03 90. 44 _ 3 +2 stand by for whole 10194. 80 40. 12 51. 47 47. 62 47. 66 84. 25 84. 30 4 +1 stand by for room 2 10178 66. 48 59. 86 89. 52 92. 99 43. 89 _ 5 +2 stand by rooms distributed 10174. 6 51. 30 63. 87 59. 88 58. 34 62. 26 62. 73
This idea of increasing the arrival can be actually supported by showing that: 1. Rafedia Surgical Hospital will hold the load of the National Hospital after locking it. 2. Rafedia Surgical Hospital has supported new type of operations that are not available in other hospitals such as vascular operations. 3. This hospital is a regional one that serves patients from outside Nablus.
Results of the scenarios with 20% increased arrival rate Increased arrivals by 20% Scenario 6 7 8 9 10 description 4 independent rooms +1 stand by for whole +2 stand by for whole +1 stand by for room 2 +2 stand by rooms distributed Total entries Utilization Max value is 75% Stand by Room 4 room 1 room 2 Room 1 Room 2 Room 3 11266. 6 85. 71 100 99. 99 _ _ 12723. 40 74. 85 89. 58 94. 69 89. 23 99. 41 _ 11715. 20 45. 82 57. 24 52. 57 54. 11 100. 00 11843. 40 85. 85 71. 99 100. 00 60. 69 _ 12732 63. 14 76. 31 74. 60 72. 30 77. 67 81. 16 Results of the scenarios with 15 % increased arrival rate Increased arrivals by 15% Scenario 11 12 13 14 description 4 independent rooms +1 stand by for whole +2 stand by rooms distributed Total entries Utilization Max value is 75% Stand by Room 4 room 1 room 2 Room 1 Room 2 Room 3 11102. 4 79. 93 100 99. 72 99. 84 _ _ 12015. 4 68. 14 84. 59 87. 48 82. 97 97. 77 - 11510. 4 44. 57 55. 67 51. 72 52. 96 99. 87 99. 89 12111 60. 44 73. 11 71 69. 08 74. 42 76. 9
Comparison between scenarios that have 4 main rooms + 2 stand by rooms (distributed) Utilization Scenario Arrival rate Total entries Max value is 75% Room 1 Room 2 Room 3 Room 4 Stand by room 1 room 2 5 current 10174. 6 51. 30 63. 87 59. 88 58. 34 62. 26 62. 73 10 +20 % 12732 36. 14 76. 31 74. 60 72. 30 77. 67 81. 16 14 +15% 12111 60. 33 73. 11 71 69. 08 74. 42 76. 9 15 +13% 11793. 8 58. 68 72. 52 69. 66 66. 60 72. 33 74. 97 16 +10% 11337. 6 54. 37 69. 24 67. 89 64. 72 68. 21 73 Total Exits Avg. Time in Sys. (hr) Avg. Time Waiting (hr) Avg. Time in Operation (hr) 11793. 80 1. 629 0. 396 1. 0053
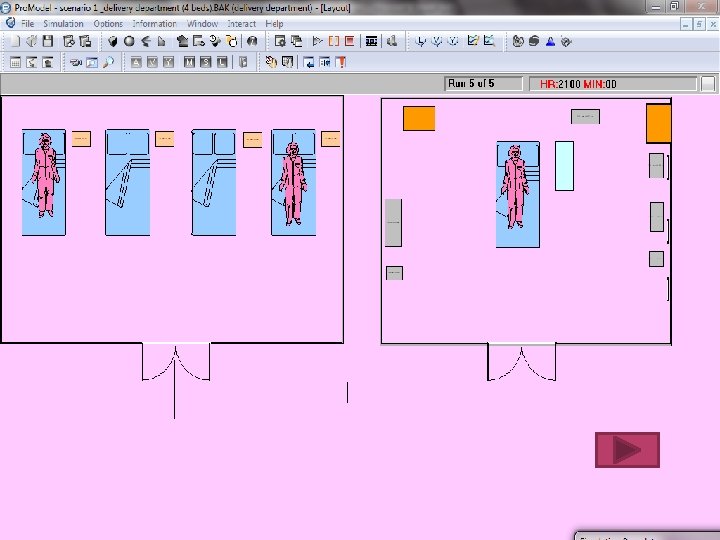
Delivery department ((Normal giving birth room)) ((Caesarean giving birth room))
This department consists of five rooms as summarized in this table: Room name Room use Capacity Admission room First check for the pregnant 2 Second stage active labor Giving birth 2 First stage early labor Giving birth 4 Extra room Rest after giving birth 1 Operation room Caesarean operations 1 Resources The resources are summarized in the next table
Description of the process
Current operations department ((Normal giving birth room)) ((Caesarean giving birth room))
Results
First Step: Real Data Collection Start time End time (min) Total time (min) Resources numbers No Date Type 1 23 -1 -10 Normal 6: 30 14: 00 7: 30 0 1 0 2 23 -1 -10 Normal 9: 30 15: 00 5: 30 0 1 0 3 23 -1 -10 Normal 10: 00 17: 10 0 1 0 4 23 -1 -10 Normal 14: 10 17: 10 3: 00 0 1 0 5 23 -1 -10 Normal 12: 00 20: 00 8: 00 0 1 0 6 23 -1 -10 Normal 20: 00 20: 20 0 1 0 7 23 -1 -10 normal 21: 30 21: 55 0: 25 2 0 0 8 23 -1 -10 C/S A day b 4 21: 50 2 0 0 9 24 -1 -10 C/S A day b 4 9: 00 0 1 0 Doctors Midwif Others e
Second Step: Statistical Fitting Analysis determine the most appropriate distributions that represent service time and time between arrivals. Service time for normal delivery Exponential for caesarean delivery
Arrival rate Exponential Table below shows arrival rate stat fit for delivery department
11. 36 20. 97 21. 32 21. 27 Max normal 45% 22. 33 Third Step: Establishing the current model 88. 62 79. 03 78. 68 78. 73 77. 67 Max delivery 80%
The following figure exactly shows distribution of working and idle periods of time for each room in the department, where the green color represents working periods, and the blue ones shows idle periods.
Results
First we improve scenario to compare between current state with 4 beds and if we have only 3 beds Current arrivals with ( 77. 7 normal : 22. 3 C/S) distribution ratio Utilization Scenario no. Description Max value is 80% Max value is 45 % Total entries Bed 1 Bed 2 Bed 3 Bed 4 C/S Room 11. 38 1 4 normal beds + 1 C/S bed room 637 22. 33 21. 27 21. 32 20. 97 2 3 normal beds + 1 C/S bed room 636. 60 29. 23 26. 94 28. 54 _ 11. 72
The improved scenarios and their description in the operations department: Delivery Department Scenario No. Scenario Name Scenario Description 3 delivery department 3 4 beds normal room + 1 C/S room (85: 15 ) 4 delivery department 4 3 beds normal room + 1 C/S room (85: 15 ) 5 delivery department 5 4 beds normal room + 1 C/S room (65: 35 ) 6 delivery department 6 3 beds normal room + 1 C/S room (65: 35 )
The total entries (number of patients served) and utilization results are summarized in the following table: Comparison between scenario 1, scenario 3 and scenario 5 that contain 4 normal beds and 1 C/S at different distribution probabilities with the current arrival Utilization Scenario no. Distribution probability Max value is 80% Max value is 45 % Total entries Bed 1 Bed 2 Bed 3 Bed 4 C/S Room 1 77. 7: 22. 3 637 22. 33 21. 27 21. 32 20. 97 11. 38 3 85: 15 648 24. 31 24. 79 24. 65 23. 69 7. 50 5 65: 35 653. 8 19. 05 17. 74 18. 15 18. 86 19. 84
Comparison between scenario 2, scenario 4 and scenario 6 that contain 3 normal beds and 1 C/S at different distribution probabilities with the current arrival Utilization Scenario Distribution probability Max value is 80% Max value is 45 % Total entries Bed 1 Bed 2 Bed 3 Bed 4 C/S Room 2 77. 7: 22. 3 636. 60 29. 23 26. 94 28. 54 - 11. 77 4 85: 15 637. 80 32. 98 31. 03 32. 28 - 7. 22 6 65: 35 631. 4 22. 43 22. 92 24. 2 - 18. 83 To study the capability of the delivery department, another group of scenarios were suggested and investigated. The idea was based on suggesting an increase in patients’ arrival rates
Results of the scenarios with 30% increased arrival rate Comparison between scenario 1 and scenario 7 that contain 4 normal beds and 1 C/S at different arrival rates at probability of ( 77. 7 : 22. 3) Utilization Max value is Total Max value is 45 % Scenario Arrival rate 80% entries Bed Bed C/S 1 2 3 4 Room 1 Current arrival 637 22. 33 21. 27 21. 32 20. 97 11. 38 7 + 30 % increased arrival 918. 4 30. 93 30. 62 28. 86 29. 19 17. 40 Comparison between scenario 2 and scenario 8 that contain 3 normal beds and 1 C/S at different arrival rates at probability of ( 77. 7 : 22. 3) Utilization Max value is Total Max value is 45 % Scenario Arrival rate 80% entries Bed Bed C/S 1 2 3 4 Room 2 Current arrival 636. 60 29. 23 26. 94 28. 54 - 11. 77 8 + 30 % increased arrival 925. 00 41. 94 40. 62 39. 58 - 17. 37
Emergency Department
Description of the process
Results
First Step: Real Data Collection
Second Step: Statistical Fitting Analysis Service time Arrival rate Exponential
Third Step: Establishing the current model
The figures show the utilization and the percentage of idle time for the nine beds respectively 71. 94 0. 00 28. 06 72. 01 28. 31 27. 99 71. 69 71. 95 28. 05 71. 68 28. 32 28. 02 71. 98 28. 22 71. 78 28. 01 71. 99 72. 14 27. 86 Max 80% Min 20%
The figures show working and idle periods for emergency department
Results
The improved scenarios and their description in the emergency department Emergency Department Scenario No. Scenario Name Scenario Description 1 9 beds room - current 9 beds with current arrival rates 2 7 beds room - current 7 beds with current arrival rates 3 6 beds room - current 6 beds with current arrival rates 4 9 beds room – increased 9 beds with 30% increase in arrival rates 5 7 beds room – increased 7 beds with 30% increased arrival rates 6 6 beds room – increased 6 beds with 30% increased arrival rates
Current arrivals Utilization Scena rio no. Description Total entries Max value is 80 % Bed Bed Bed 1 2 3 4 5 6 7 8 9 1 9 beds 36210. 2 27. 86 28. 01 28. 22 28. 02 28. 32 28. 05 28. 31 27. 99 28. 06 2 7 beds 36389. 4 36. 61 36. 30 36. 38 36. 27 35. 84 36. 11 - - 3 6 beds 36343. 2 42. 53 42. 44 42. 01 42. 40 42. 09 42. 18 - - - 30% increase in arrival rates Utilization Scena rio no. Description Total entries Max value is 80 % Bed Bed Bed 1 2 3 4 5 6 7 8 9 4 9 beds 51864. 2 40. 50 40. 24 40. 38 40. 41 40. 30 40. 10 40. 41 40. 26 5 7 beds 51570. 0 51. 81 51. 74 51. 68 51. 79 51. 67 51. 21 51. 44 - - 6 6 beds 51657. 2 59. 98 60. 23 59. 96 60. 05 59. 97 59. 86 - - -
on s i ar p m Co Current 1 Comparison between scenario 1 and scenario 4 that include 9 beds within different arrival rate Utilization Max value is 80 % Scen ario no. Arrival rate Total entries Bed Bed Bed 1 2 3 4 5 6 7 8 9 1 current 36210. 2 27. 86 28. 01 28. 22 28. 02 28. 32 28. 05 28. 31 27. 99 28. 06 4 + 30% 51864. 2 40. 50 40. 24 40. 38 40. 41 40. 30 40. 10 40. 41 40. 26
on s i ar p m Co Current 2 Comparison between scenario 2 and scenario 5 that include 7 beds within different arrival rate Utilization Max value is 80 % Scen ario no. Arrival rate Total entries Bed Bed Bed 1 2 3 4 5 6 7 8 9 36. 28 36. 27 35. 84 36. 11 - - 51. 79 51. 67 51. 21 51. 44 - - 2 current 36389. 4 36. 61 36. 30 5 + 30% 51570. 0 51. 81 51. 74 36. 38 51. 68
on s i ar p m Co Improved Comparison between scenario 3 and scenario 6 that include 6 beds within different arrival rate Utilization Max value is 80 % Scena rio no. Arrival rate Total entries Bed Bed Bed 1 2 3 4 5 6 7 8 9 3 current 36343. 2 42. 53 42. 44 42. 01 42. 40 42. 09 42. 18 - - - 6 + 30% 51657. 2 59. 98 60. 23 59. 96 60. 05 59. 97 59. 86 - - -
Conclusions General conclusions v. Simulation is straightforward and flexible tool that helps to analyze different types of situations. v. It enables the decision takers to take effective decisions according to its results. v. It gives freedom to try out different alternative improvements without the real risk of costing effort, money, time and ineffective solutions. Specific conclusions v. It was a very effective tool that has been succeeded to simulate the current situations exactly as they are, in clear representing models. v The simulated models succeeded to show which beds or rooms were over utilized and which were underutilized, and up to which limit their utilization could be increased or decreased.
Operations Department Current situation v Problems with the high percentage of utilization in its four main rooms. v. The waiting time in the system has been relatively long. Improved scenarios v Combinations in scenario 5 was the best (serves all patients without overloading beds, provides enough time to prepare the rooms, keeps the average waiting time in the system at a low value that equals 10 minutes) v. This combination can withstand an increase in arrival rate up to 13%.
Delivery department Current situation v. Good situation where the utilization of both the normal and caesarean room didn’t exceed the limit. Improved scenarios v It could be accepted to operate only three normal beds. v The department will withstand an arrival increase up to 30%. (scenario 7 & 8) v. They were underutilized with no congestion in the queue lines. v. The average waiting time in the system was zero (good quality index). v Changes in the pregnant distribution between normal and caesarean delivery can be conducted.
Emergency department Current situation v. Underutilized considering the beds. v There is no congestion in the queue line as most of the time it is idle. v. The average waiting time in the system was zero, (each patient can immediately occupy a bed waiting his treatment). Improved scenarios v. The department can work with 6 beds (keep U< 80%). v. Scenario 2 was really implemented. v. Increasing the arrival rate up to 30% with current number of beds will increase the utilization to 40%, while with using seven beds it will be increased to 51%, and using only six beds will utilize the beds to 60% (all<80%)
Recommendations 1) Simulation is recommended to be applied in other departments in the hospital, and in any other organization. 2) It should be applied to study other issues. 3) Applying simulation on larger scale than this project needs the full version of this software, so it is very worth and economic to buy it. 4) For operations department: i. Follow scenario number (5) for current and increased arrival. 5) For delivery department: the current situation can still be used in the future but for improvements: i. One normal delivery bed could be excluded. ii. The department should welcome any case as it could withstand delivery distribution changes. 6) For emergency department: i. It is recommended to exclude some beds from the department, and to utilize them in other services (scenario 2 , 3) ii. For best results use only six beds. ( because that will utilize the beds to 60%.
THANK YOU