
IMPLEMENTATION OF THE NEW TOOL METT 3 What





- Slides: 16
IMPLEMENTATION OF THE NEW TOOL (METT 3) What can we expect wrt Marine Protected Areas Mr Caiphus Ernest Khumalo, DEA, Directorate: Protected Areas Governance Biodiversity and Conservation MPA Forum, Dolphin Leap Conference, PE 25 -27 October 2016
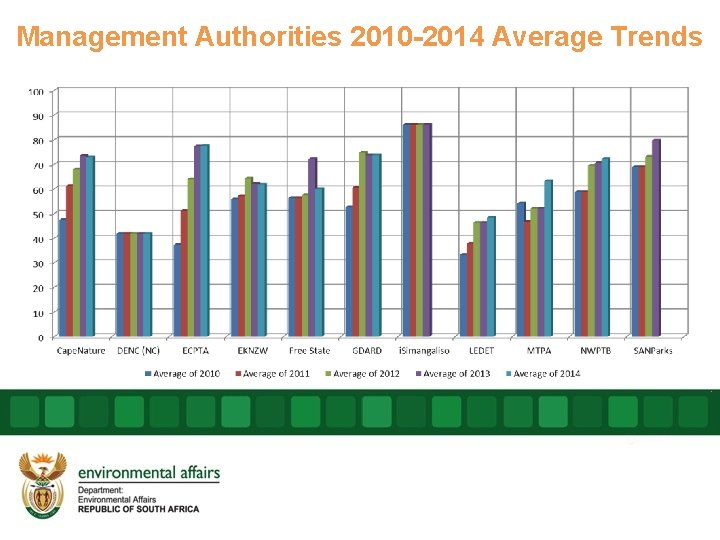
Introduction • Since the 2010 baseline assessment RSA has been submitting METT data to DEA • Ambitious target of “ 60% of state managed PA to have a METT score above 67% by 2015 was once set • From the baseline, progress was monitored against target • All MAs required to conduct annual assessments • Results are collated, pooled & analysed by DEA to determine the national score
Management Authorities 2010 -2014 Average Trends
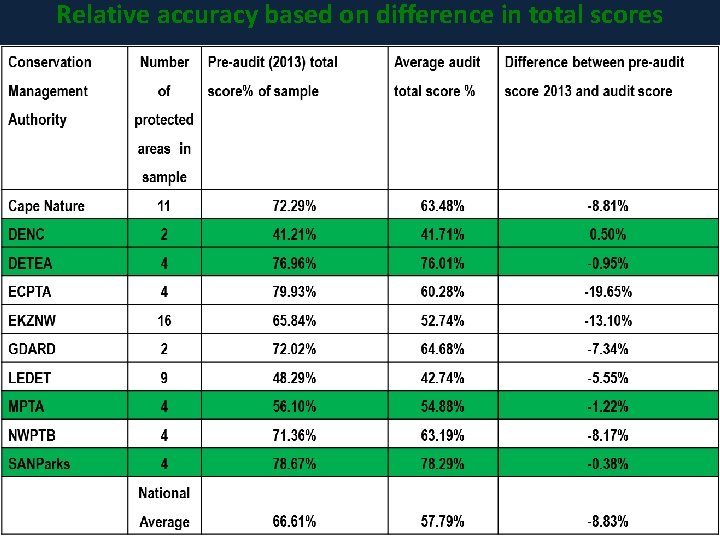
Data Verification & Determination of Reliability Index • The trends were satisfactory but the issue of reliability of the data remained elusive • DEA saw a need to test the reliability of the submitted scores owing to the fact that the process was also through self-assessment • To determine whether increase was attributed to applied interventions or to contrived score increase. • DEA then commissioned verification/audit for 2013 data
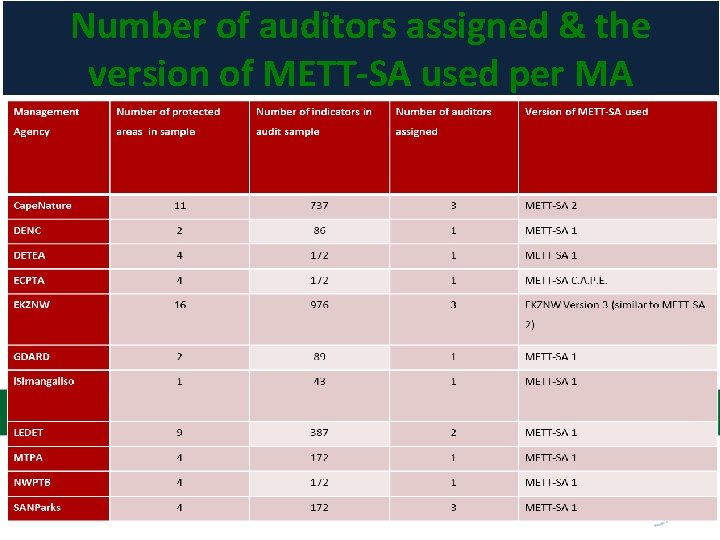
Number of auditors assigned & the version of METT-SA used per MA
Relative accuracy based on difference in total scores
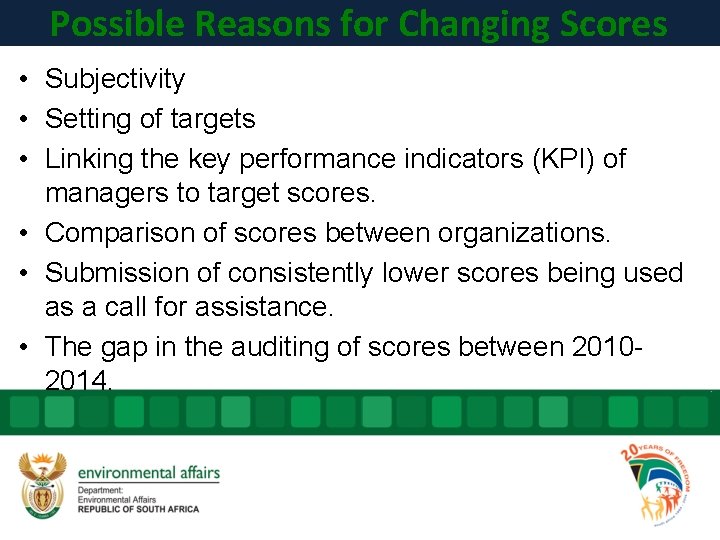
Possible Reasons for Changing Scores • Subjectivity • Setting of targets • Linking the key performance indicators (KPI) of managers to target scores. • Comparison of scores between organizations. • Submission of consistently lower scores being used as a call for assistance. • The gap in the auditing of scores between 20102014.
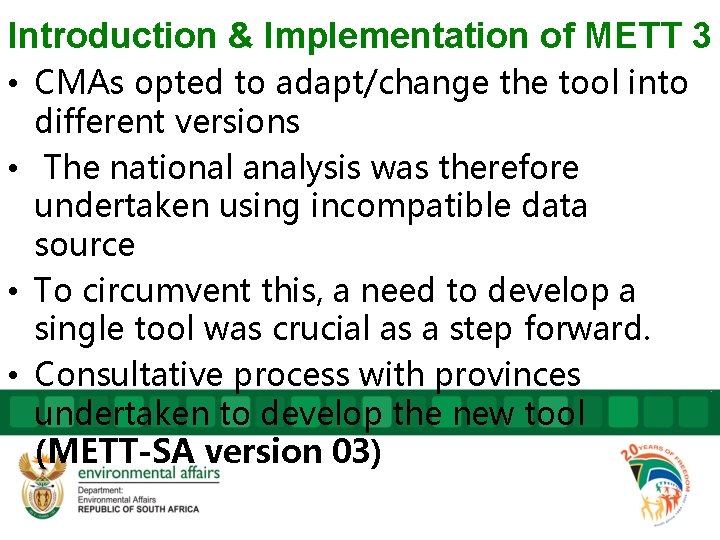
Introduction & Implementation of METT 3 • CMAs opted to adapt/change the tool into different versions • The national analysis was therefore undertaken using incompatible data source • To circumvent this, a need to develop a single tool was crucial as a step forward. • Consultative process with provinces undertaken to develop the new tool (METT-SA version 03)
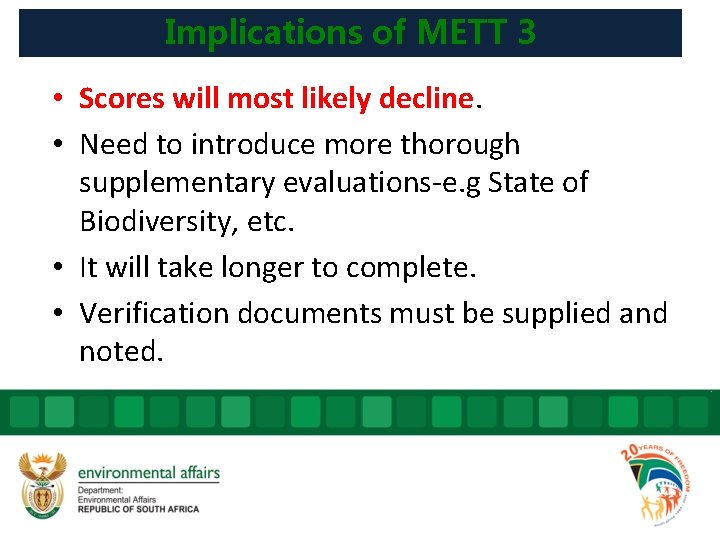
Implications of METT 3 • Scores will most likely decline. • Need to introduce more thorough supplementary evaluations-e. g State of Biodiversity, etc. • It will take longer to complete. • Verification documents must be supplied and noted.
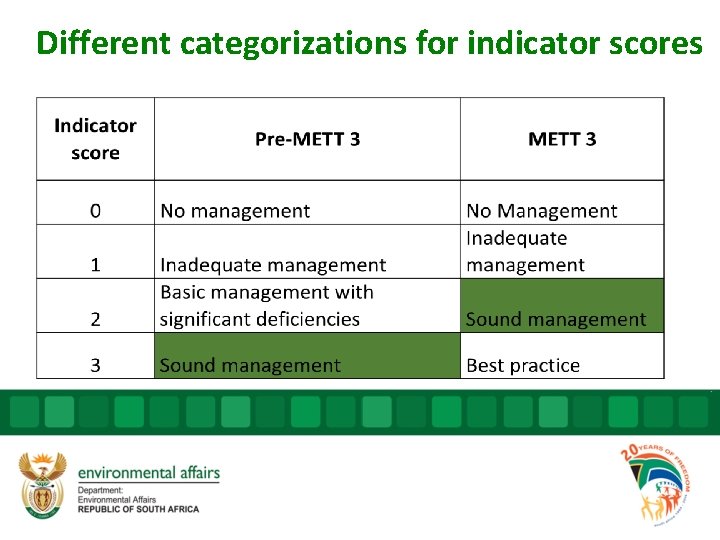
Different categorizations for indicator scores
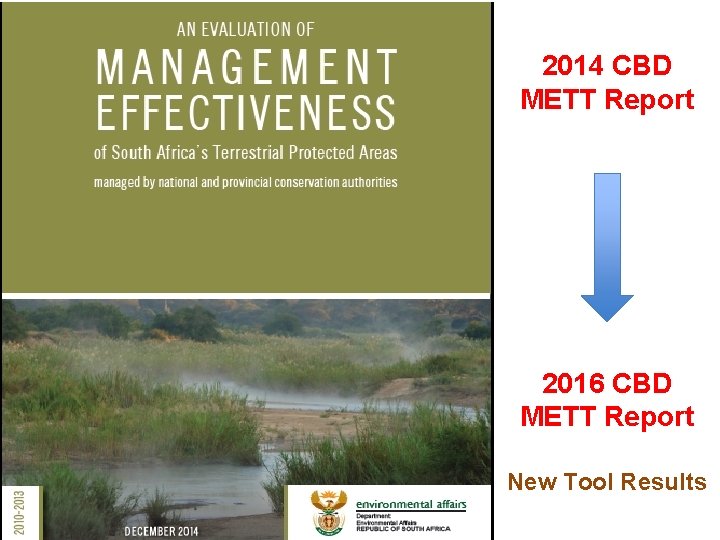
2014 CBD METT Report 2016 CBD METT Report New Tool Results
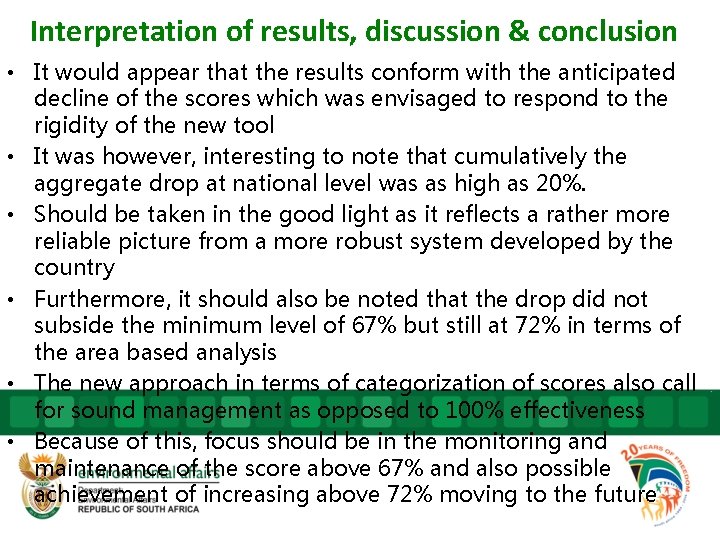
Interpretation of results, discussion & conclusion • It would appear that the results conform with the anticipated decline of the scores which was envisaged to respond to the rigidity of the new tool • It was however, interesting to note that cumulatively the aggregate drop at national level was as high as 20%. • Should be taken in the good light as it reflects a rather more reliable picture from a more robust system developed by the country • Furthermore, it should also be noted that the drop did not subside the minimum level of 67% but still at 72% in terms of the area based analysis • The new approach in terms of categorization of scores also call for sound management as opposed to 100% effectiveness • Because of this, focus should be in the monitoring and maintenance of the score above 67% and also possible achievement of increasing above 72% moving to the future
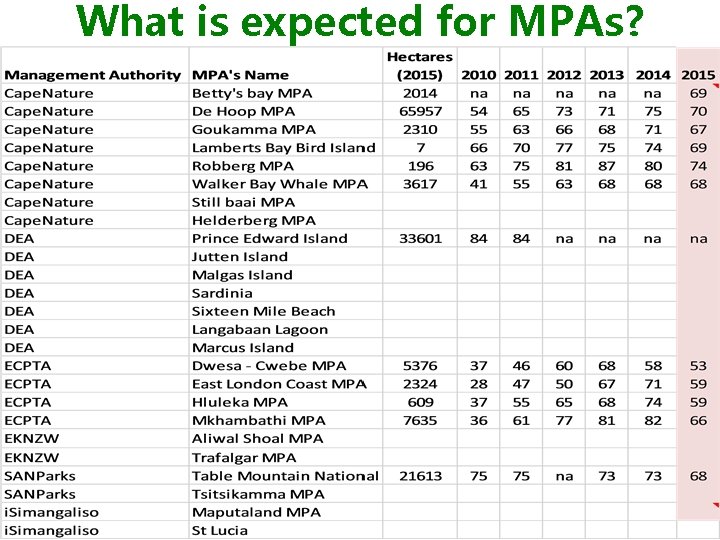
What is expected for MPAs?
Enquiries Mr Caiphus Khumalo Director: Protected Areas Governance Department of Environmental Affairs Email: CKhumalo@environment. gov. za Telephone: 012 399 9539/0824898051