
Implementation and Statistical Analysis of a Differential GPS






- Slides: 61
Implementation and Statistical Analysis of a Differential GPS System Team Members: Jim Connor Jon Kerr Advisor: Dr. In Soo Ahn
Abstract n Normal GPS (Global Positioning System) is not accurate enough for the applications here at Bradley University. For greater accuracy, a Differential GPS system will be implemented. To do this, two GPS units are required. A base station, with a known position, sends error correction data to a mobile unit. The error correction data is sent wirelessly through a radio link. The data can then be viewed on a laptop computer for statistical analysis.
Project Purpose n n n Previous project: Autonomous Vehicle with GPS Navigation - Jason Seelye and Bryan Everett Problem: GPS not accurate enough to control vehicle Our focus: Create GPS system with the greatest accuracy possible for the control of autonomous vehicles (sidewalk)
Topics of Discussion n n n n Explanations and Terminology Equipment used Project description Hardware implementation process Software implementation process Problems encountered and solutions Data gathering Statistical Analysis of data Conclusions and Recommendations
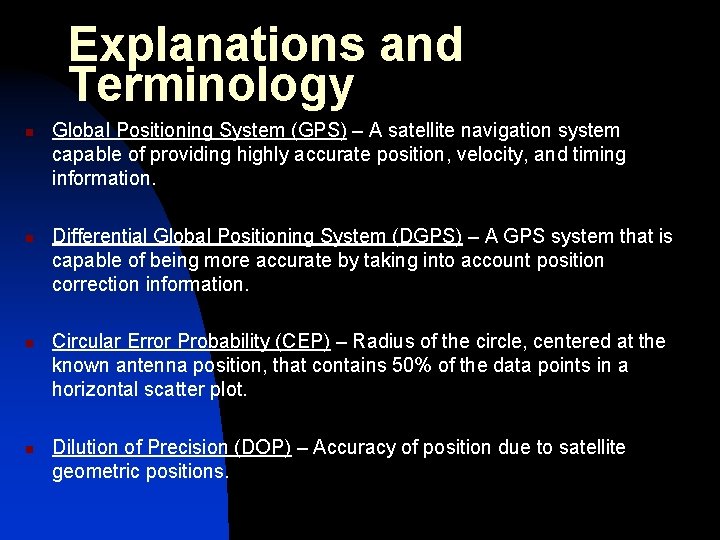
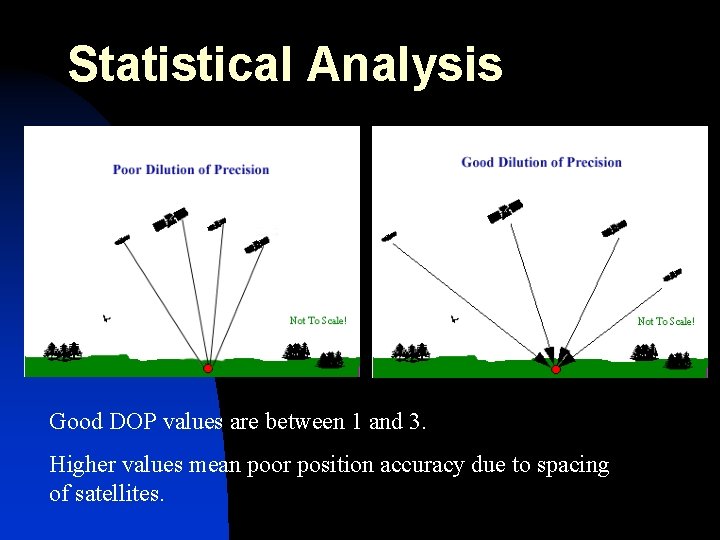
Explanations and Terminology n n Global Positioning System (GPS) – A satellite navigation system capable of providing highly accurate position, velocity, and timing information. Differential Global Positioning System (DGPS) – A GPS system that is capable of being more accurate by taking into account position correction information. Circular Error Probability (CEP) – Radius of the circle, centered at the known antenna position, that contains 50% of the data points in a horizontal scatter plot. Dilution of Precision (DOP) – Accuracy of position due to satellite geometric positions.
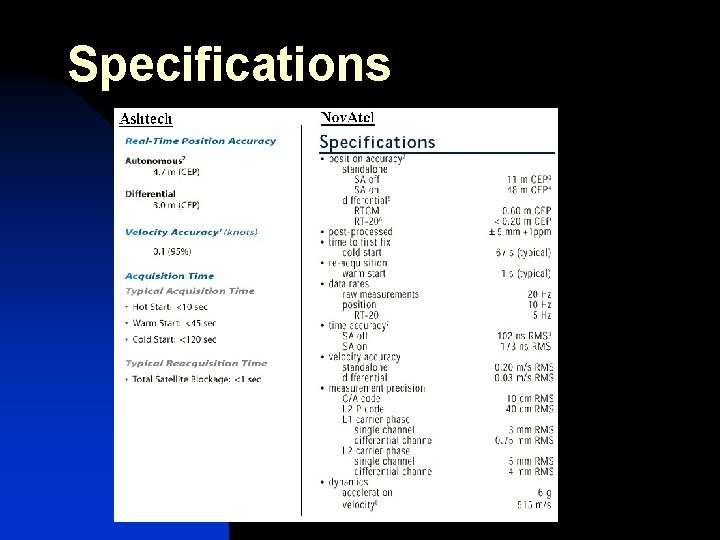
Specifications
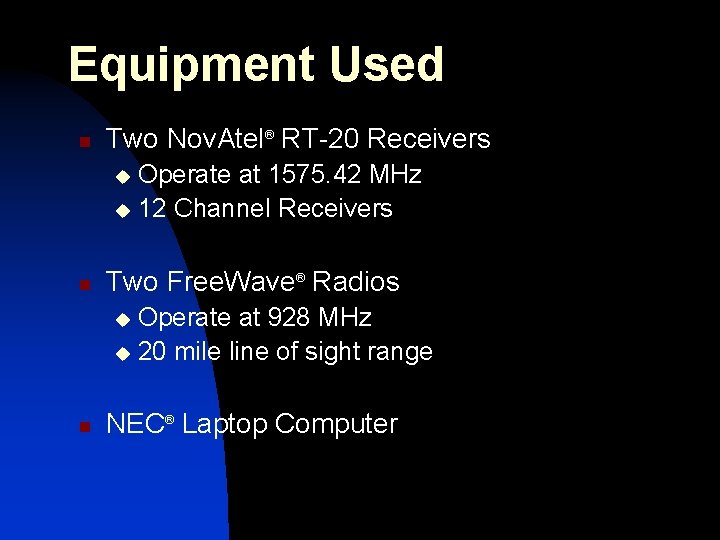
Equipment Used n Two Nov. Atel® RT-20 Receivers Operate at 1575. 42 MHz u 12 Channel Receivers u n Two Free. Wave® Radios Operate at 928 MHz u 20 mile line of sight range u n NEC® Laptop Computer
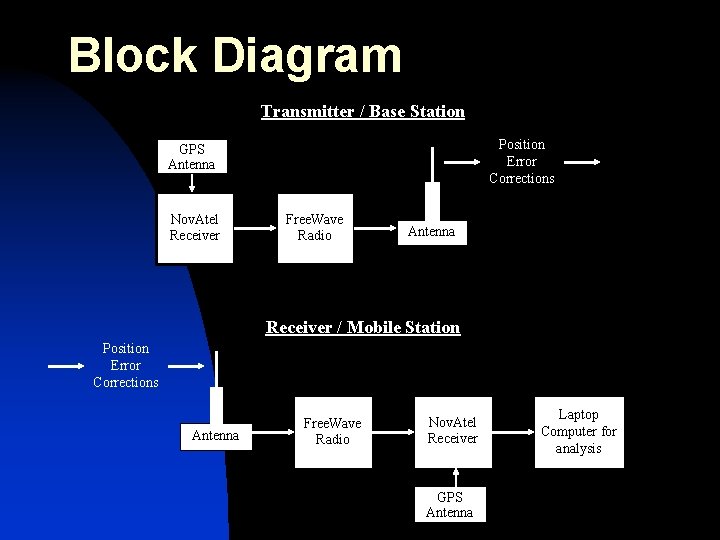
Block Diagram Transmitter / Base Station Position Error Corrections GPS Antenna Nov. Atel Receiver Free. Wave Radio Antenna Receiver / Mobile Station Position Error Corrections Antenna Free. Wave Radio Nov. Atel Receiver GPS Antenna Laptop Computer for analysis
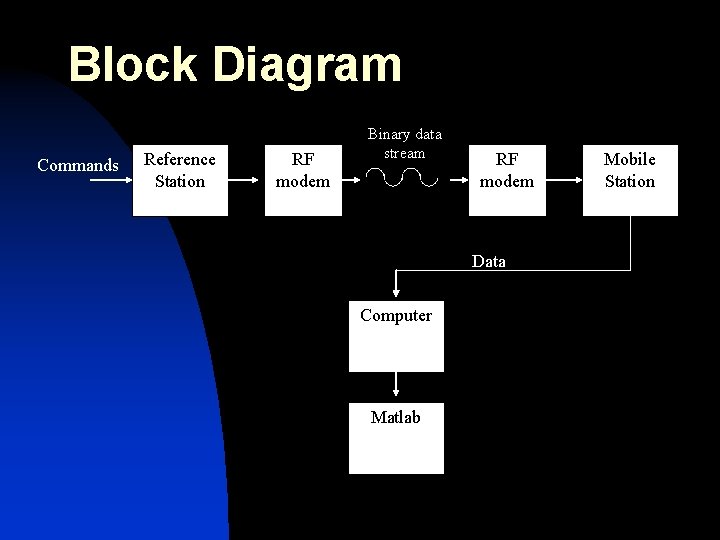
Block Diagram Commands Reference Station RF modem Binary data stream RF modem Data Computer Matlab Mobile Station
Functional Description n An exact geographical position is determined. n Reference station placed at this point. n Since at a known position, able to calculate errors from GPS satellites. n Sends error corrections across a wireless radio link to remote station. n n Remote station receives error corrections and also position information from same satellite constellation that reference station sees. Remote station uses both satellite data and error corrections to calculate position. Nov. Atel® Receiver Base Station Serial Correction Data Nov. Atel® Receiver Remote Station
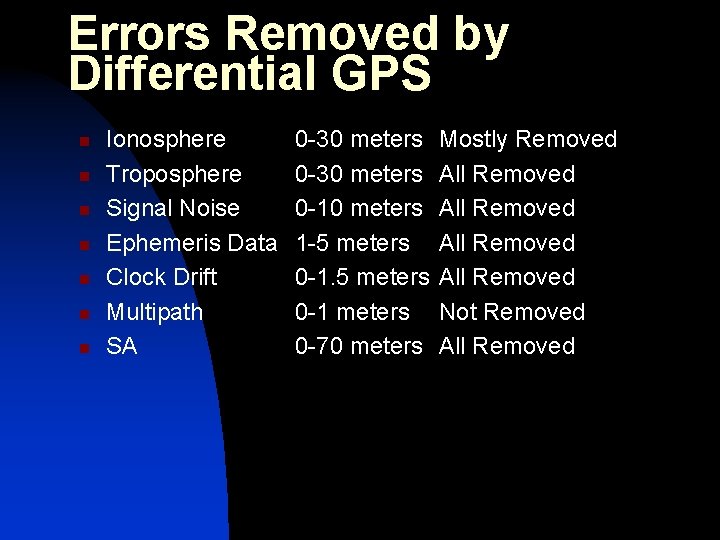
Errors Removed by Differential GPS n n n n Ionosphere Troposphere Signal Noise Ephemeris Data Clock Drift Multipath SA 0 -30 meters 0 -10 meters 1 -5 meters 0 -1 meters 0 -70 meters Mostly Removed All Removed Not Removed All Removed
Design Approach n n n Correct operation of Nov. Atel receivers borrowed from CAT Correct operation of Free. Wave Radio communication link borrowed from Dr. Sennott (TISI) Successful GPS receiver – radio link integration
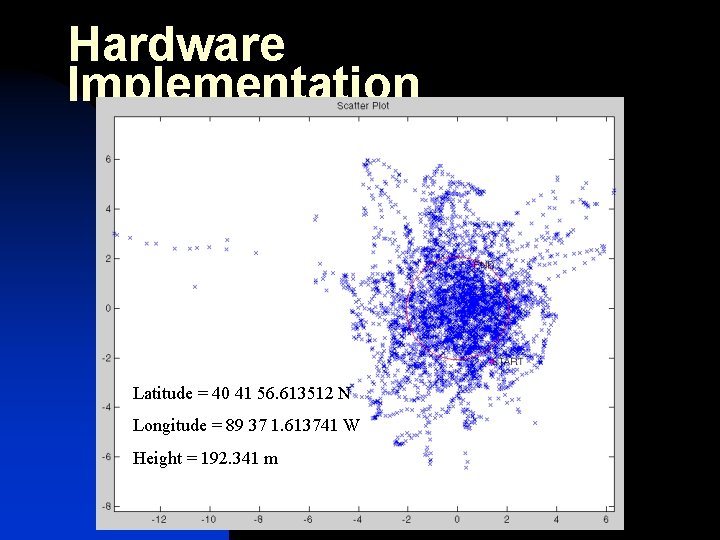
Hardware Implementation Reference Point n Placed Nov. Atel GPS Receiver on Jobst Hall and collected position information (scatter plot) for about two hours. n Used the average Latitude and Longitude of this plot as our reference point.
Hardware Implementation Latitude = 40 41 56. 613512 N Longitude = 89 37 1. 613741 W Height = 192. 341 m
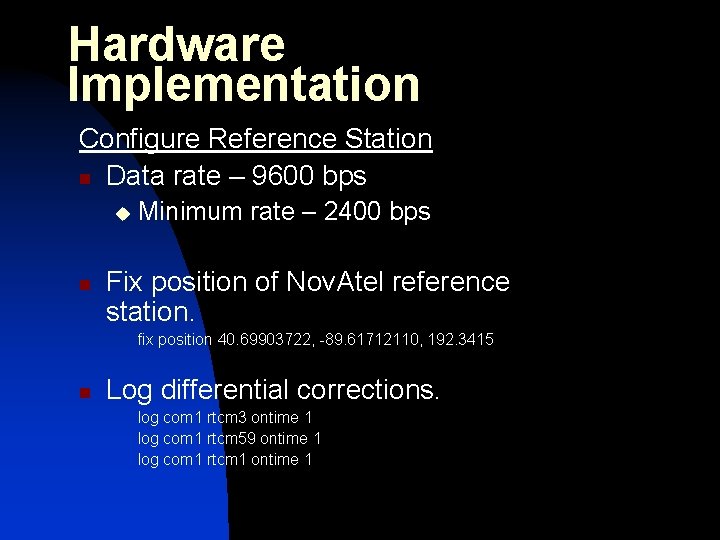
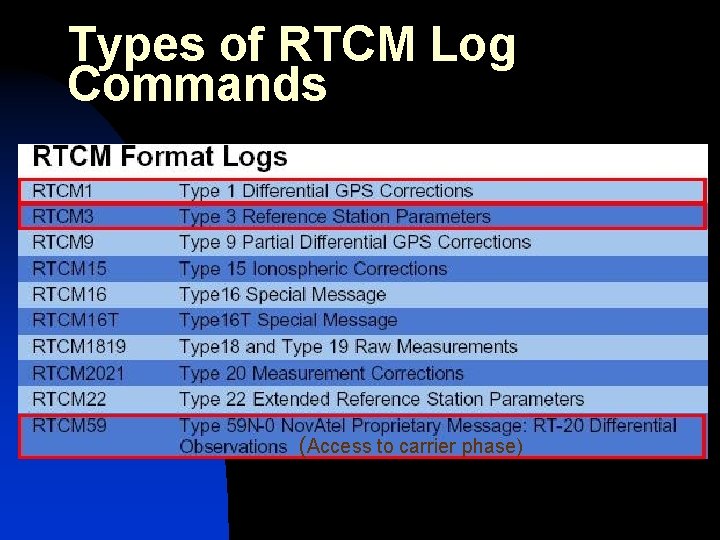
Hardware Implementation Configure Reference Station n Data rate – 9600 bps u n Minimum rate – 2400 bps Fix position of Nov. Atel reference station. fix position 40. 69903722, -89. 61712110, 192. 3415 n Log differential corrections. log com 1 rtcm 3 ontime 1 log com 1 rtcm 59 ontime 1 log com 1 rtcm 1 ontime 1
RTCM Corrections n n n Radio Technical Commission for Maritime Services (RTCM) set up a team composed of representatives of US federal authorities, GPS manufacturers and users. In early 1990, they adopted a first standard for the transmission format and contents for DGPS applications Special Committee 104 (SC 104)
Types of RTCM Log Commands (Access to carrier phase)
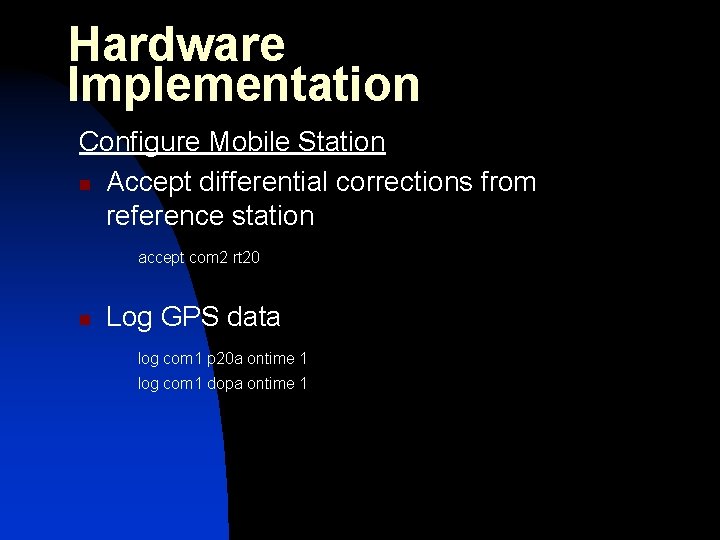
Hardware Implementation Configure Mobile Station n Accept differential corrections from reference station accept com 2 rt 20 n Log GPS data log com 1 p 20 a ontime 1 log com 1 dopa ontime 1
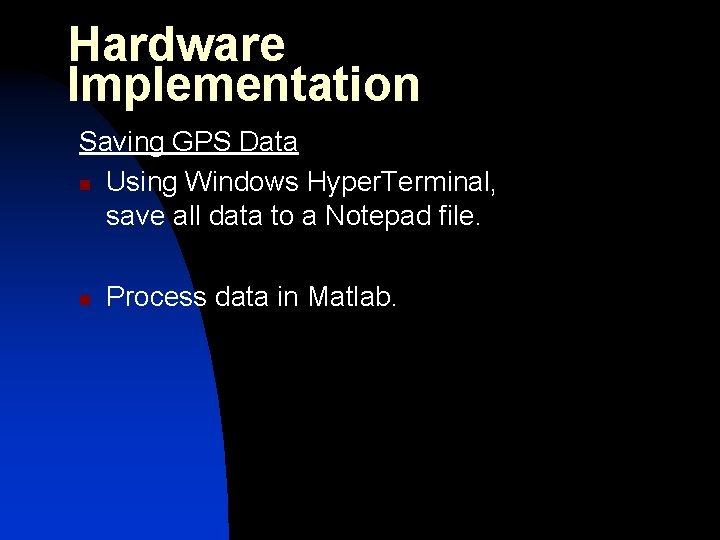
Hardware Implementation Saving GPS Data n Using Windows Hyper. Terminal, save all data to a Notepad file. n Process data in Matlab.
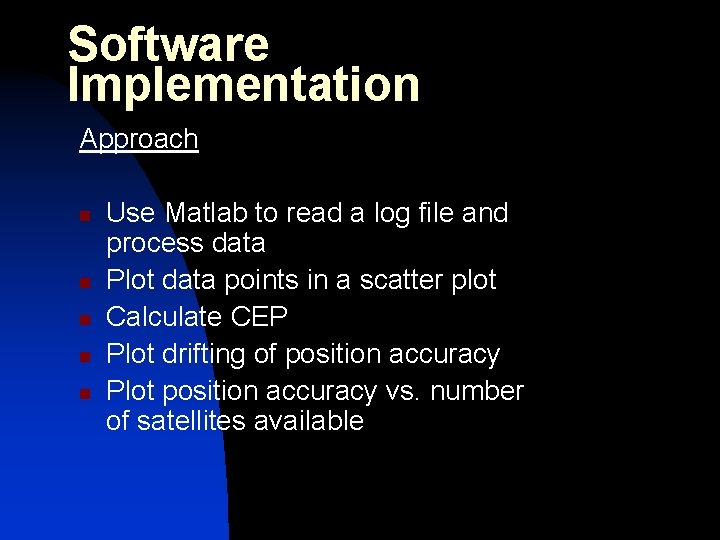
Software Implementation Approach n n n Use Matlab to read a log file and process data Plot data points in a scatter plot Calculate CEP Plot drifting of position accuracy Plot position accuracy vs. number of satellites available
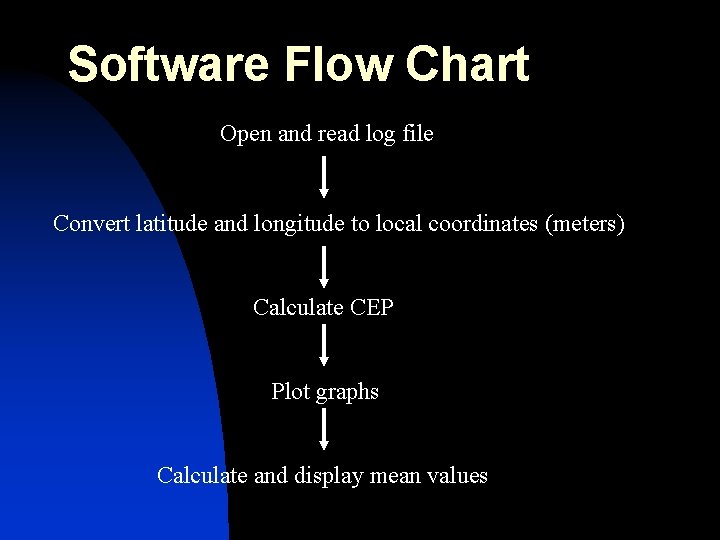
Software Flow Chart Open and read log file Convert latitude and longitude to local coordinates (meters) Calculate CEP Plot graphs Calculate and display mean values
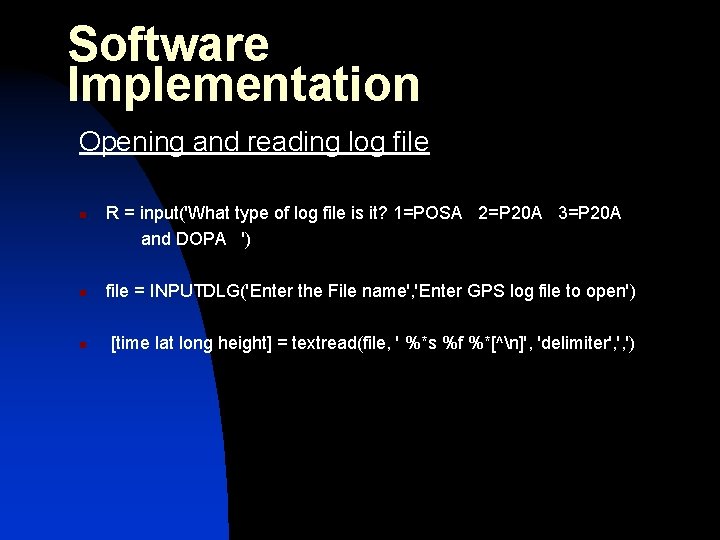
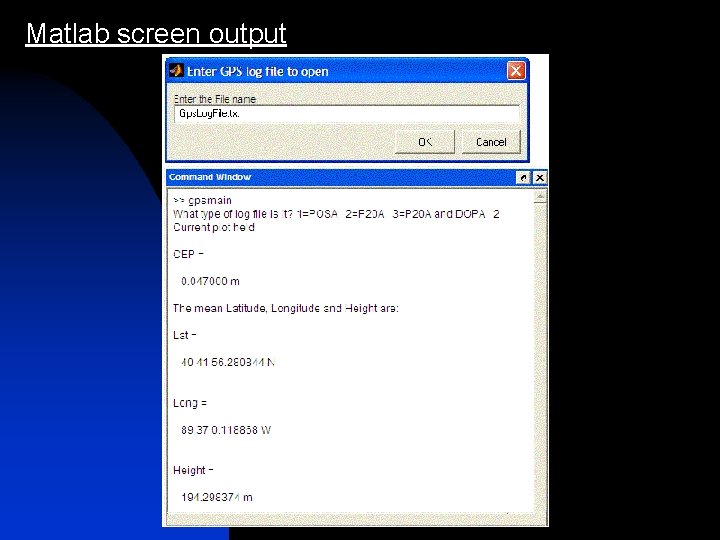
Software Implementation Opening and reading log file n R = input('What type of log file is it? 1=POSA 2=P 20 A 3=P 20 A and DOPA ') n file = INPUTDLG('Enter the File name', 'Enter GPS log file to open') n [time lat long height] = textread(file, ' %*s %f %*[^n]', 'delimiter', ', ')
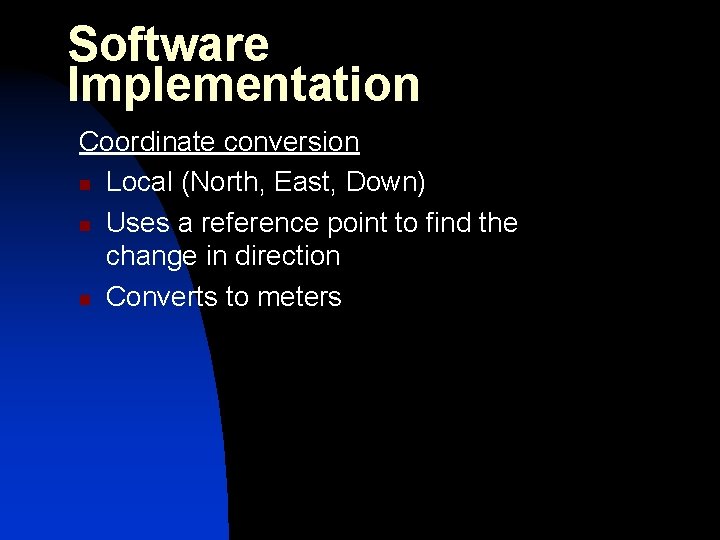
Software Implementation Coordinate conversion n Local (North, East, Down) n Uses a reference point to find the change in direction n Converts to meters
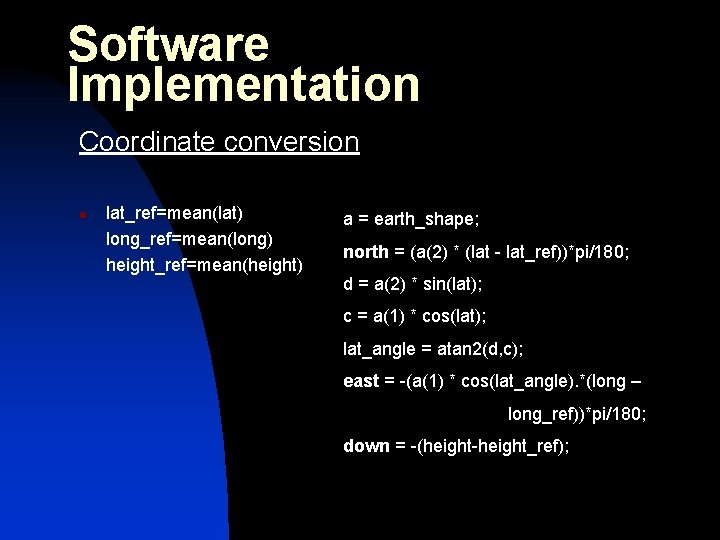
Software Implementation Coordinate conversion n lat_ref=mean(lat) long_ref=mean(long) height_ref=mean(height) a = earth_shape; north = (a(2) * (lat - lat_ref))*pi/180; d = a(2) * sin(lat); c = a(1) * cos(lat); lat_angle = atan 2(d, c); east = -(a(1) * cos(lat_angle). *(long – long_ref))*pi/180; down = -(height-height_ref);
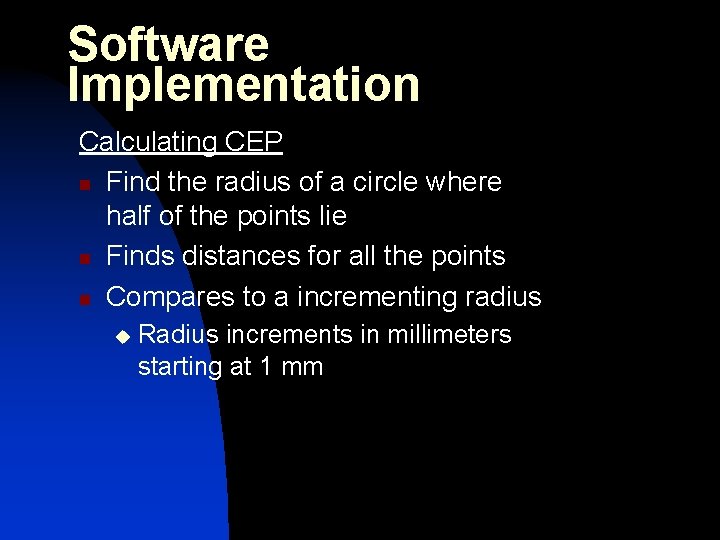
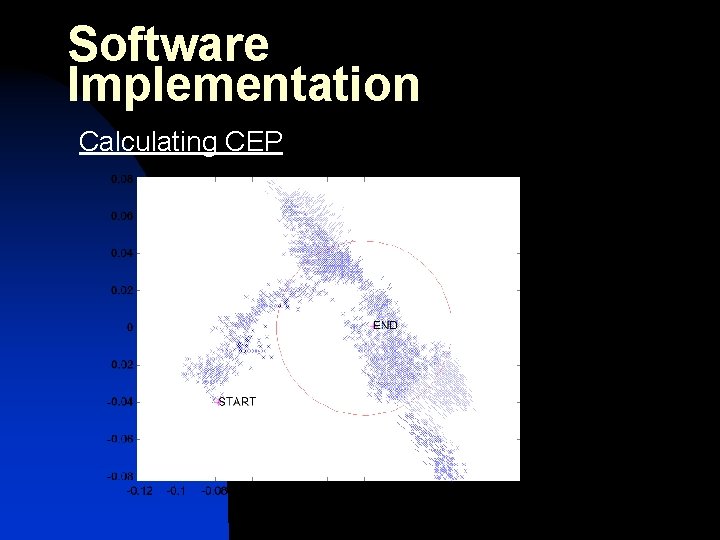
Software Implementation Calculating CEP n Find the radius of a circle where half of the points lie n Finds distances for all the points n Compares to a incrementing radius u Radius increments in millimeters starting at 1 mm
Software Implementation Calculating CEP
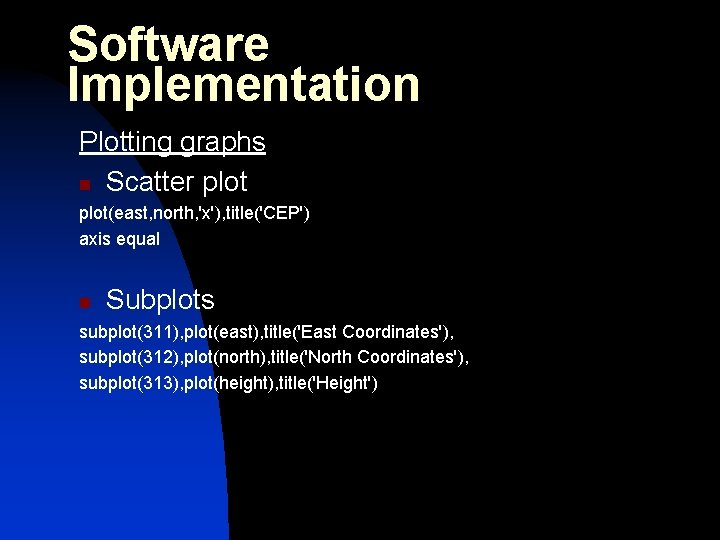
Software Implementation Plotting graphs n Scatter plot(east, north, 'x'), title('CEP') axis equal n Subplots subplot(311), plot(east), title('East Coordinates'), subplot(312), plot(north), title('North Coordinates'), subplot(313), plot(height), title('Height')
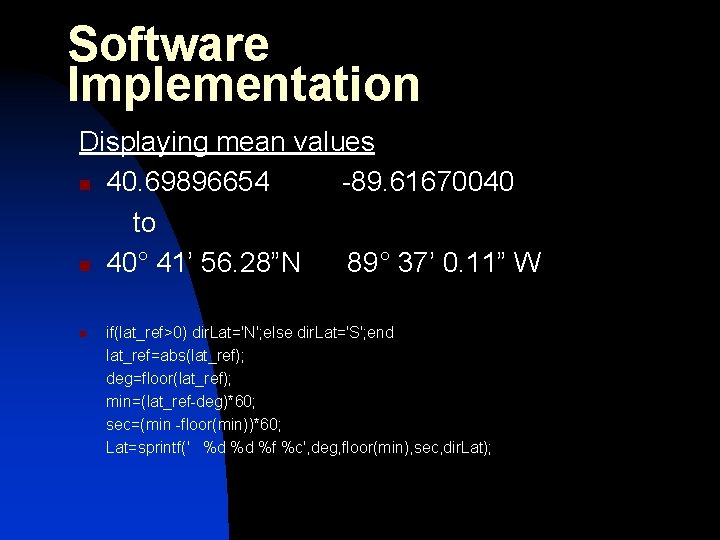
Software Implementation Displaying mean values n 40. 69896654 -89. 61670040 to n 40° 41’ 56. 28”N 89° 37’ 0. 11” W n if(lat_ref>0) dir. Lat='N'; else dir. Lat='S'; end lat_ref=abs(lat_ref); deg=floor(lat_ref); min=(lat_ref-deg)*60; sec=(min -floor(min))*60; Lat=sprintf(' %d %d %f %c', deg, floor(min), sec, dir. Lat);
Matlab screen output
Problems Encountered n n n CAT Nov. Atel receiver missing software Radio transmitter link doesn’t work or transmit data when connected to GPS receiver Can’t find geographic benchmark data
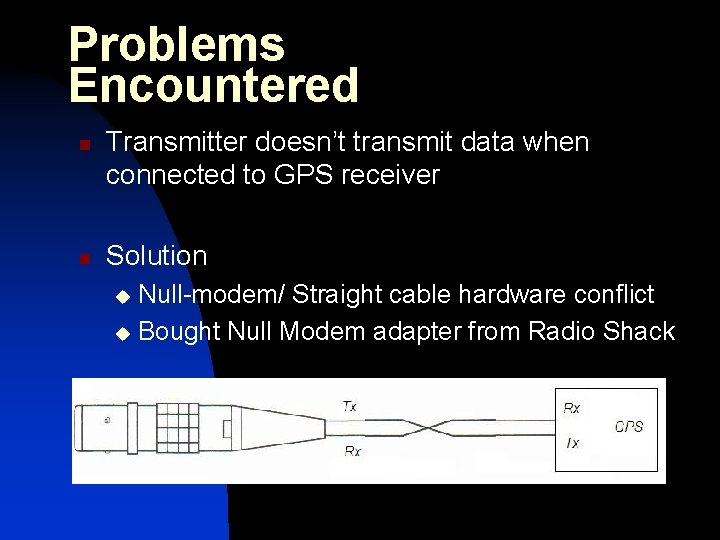
Problems Encountered n n Transmitter doesn’t transmit data when connected to GPS receiver Solution Null-modem/ Straight cable hardware conflict u Bought Null Modem adapter from Radio Shack u
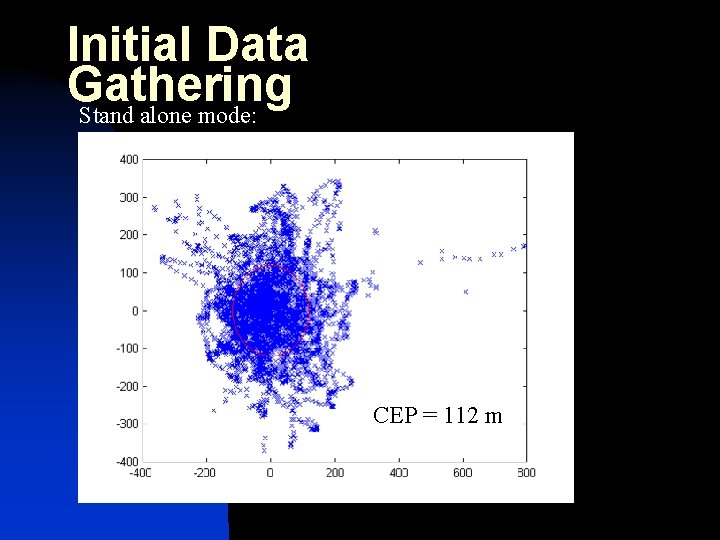
Initial Data Gathering Procedure n n n Set up base station Set up remote station far away Start sending corrections Use laptop to capture remote station data Process in Matlab CEP = 112 m
Initial Data Gathering Stand alone mode: CEP = 112 m
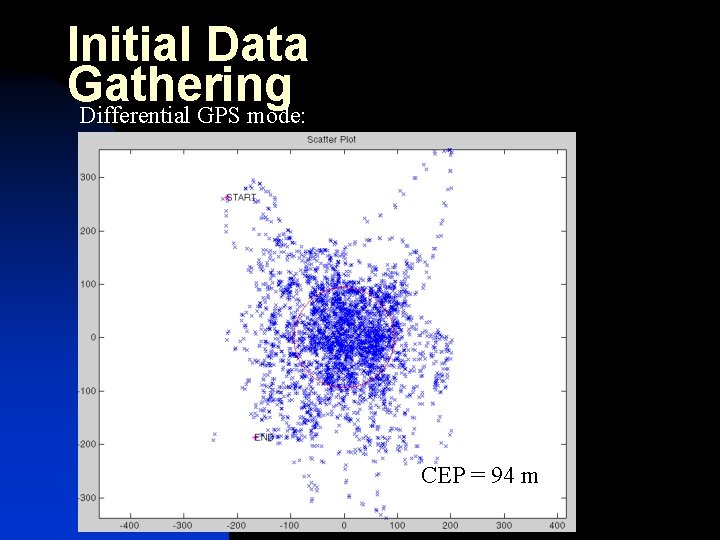
Initial Data Gathering Differential GPS mode: CEP = 94 m
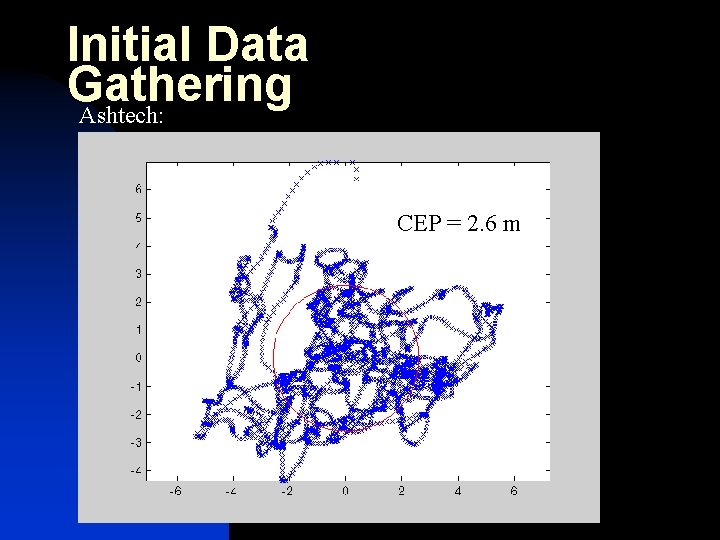
Initial Data Gathering Ashtech: CEP = 2. 6 m
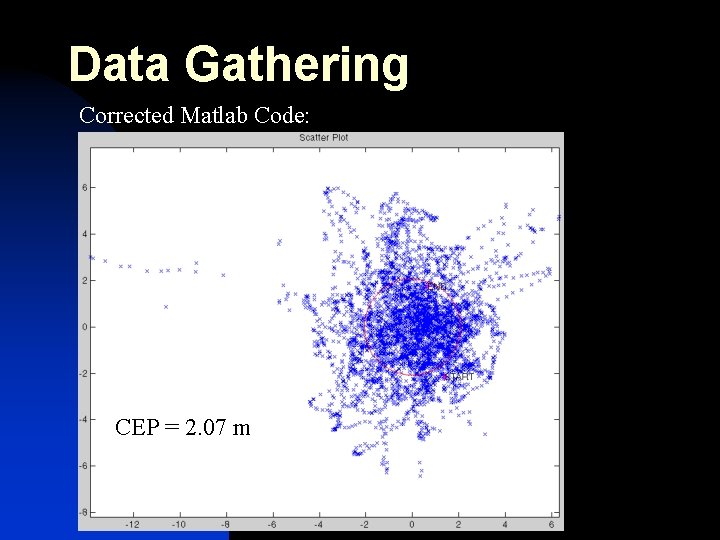
Code Problem n n n We were converting Latitude and Longitude to meters without first converting to radians All our conversions were off by a factor of about 57 1 radian = 57. 3 degrees
Data Gathering Corrected Matlab Code: CEP = 2. 07 m
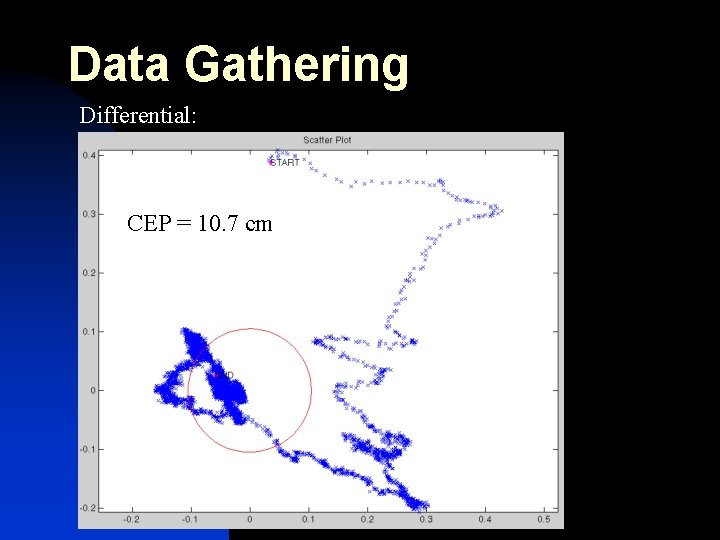
Data Gathering Differential: CEP = 10. 7 cm
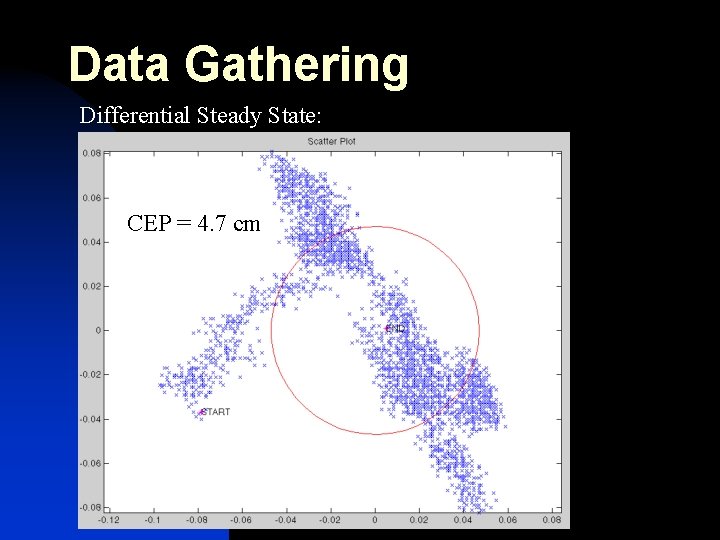
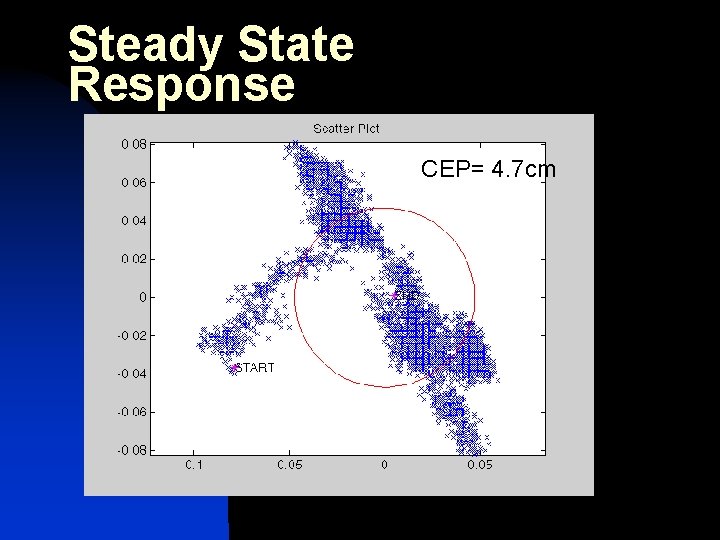
Data Gathering Differential Steady State: CEP = 4. 7 cm
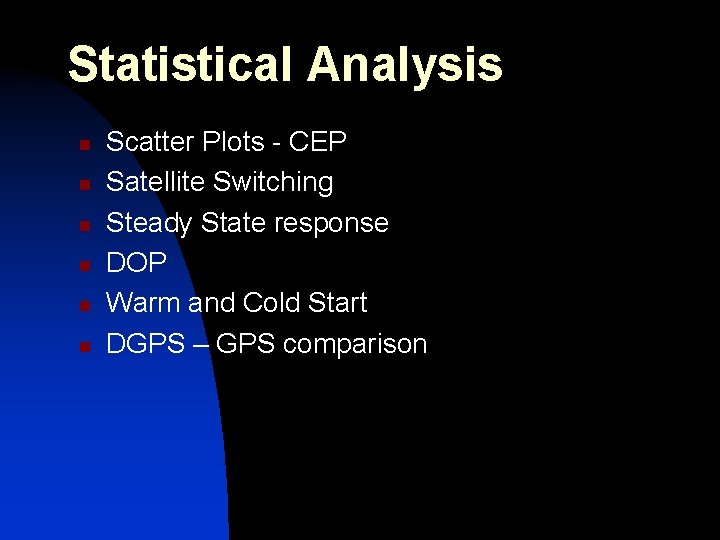
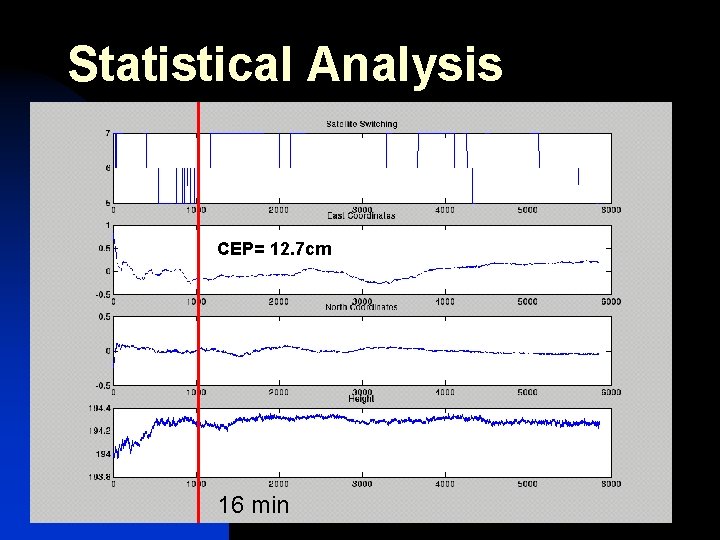
Statistical Analysis n n n Scatter Plots - CEP Satellite Switching Steady State response DOP Warm and Cold Start DGPS – GPS comparison
Statistical Analysis DGPS system operating n CEP n Satellite effects n Time to steady state
Statistical Analysis CEP= 12. 7 cm 16 min
Steady State Response CEP= 4. 7 cm
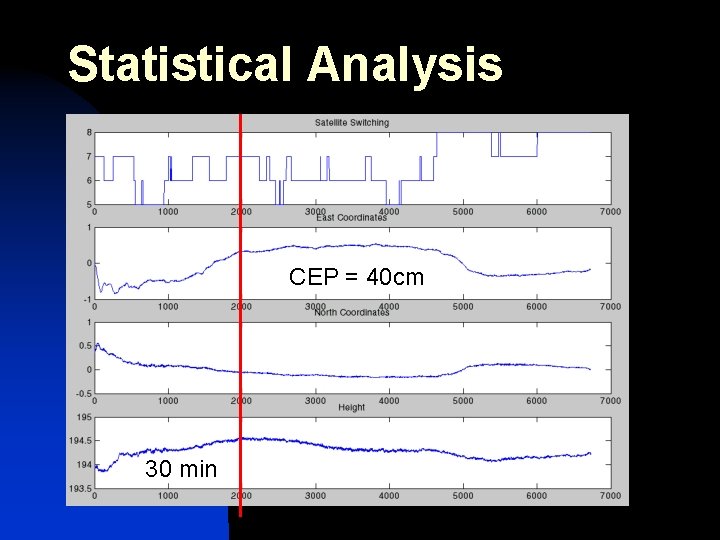
Statistical Analysis DGPS system operating n Fix base station position with less accuracy n What are the effects?
Statistical Analysis CEP = 40 cm 30 min
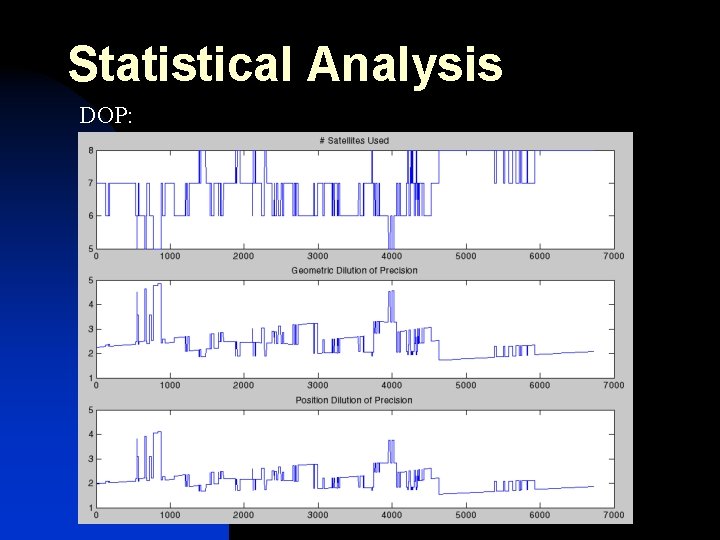
Statistical Analysis Good DOP values are between 1 and 3. Higher values mean poor position accuracy due to spacing of satellites.
Statistical Analysis DOP:
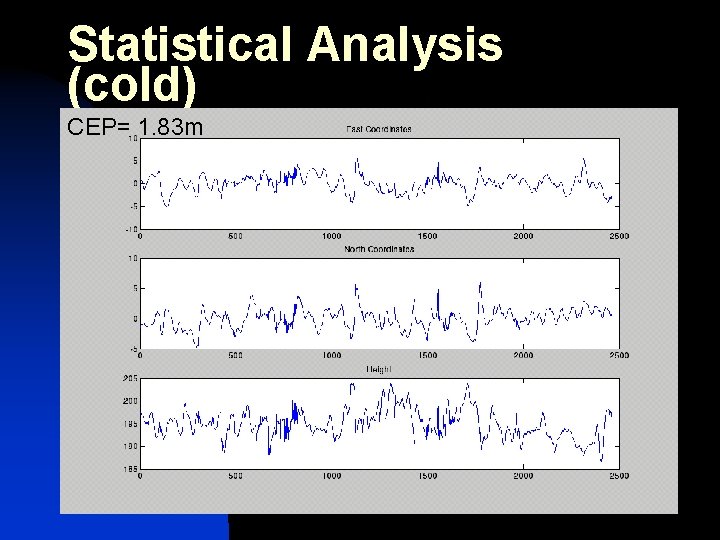
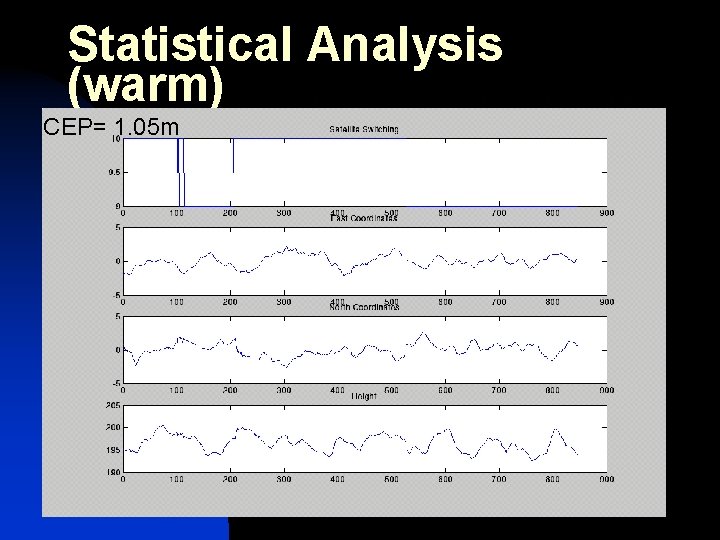
Statistical Analysis DGPS system operating n What are the effects of taking GPS data at warm and cold starts? n n Cold start: Initial startup Warm start: Been running for a while
Statistical Analysis (cold) CEP= 1. 83 m
Statistical Analysis (warm) CEP= 1. 05 m
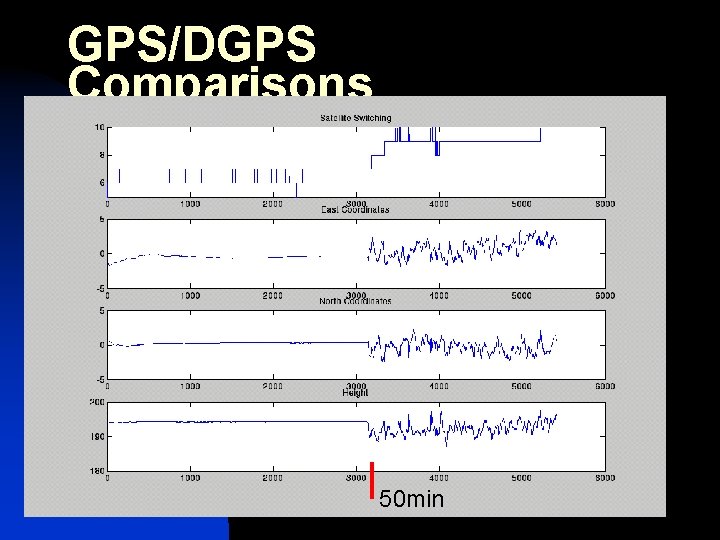
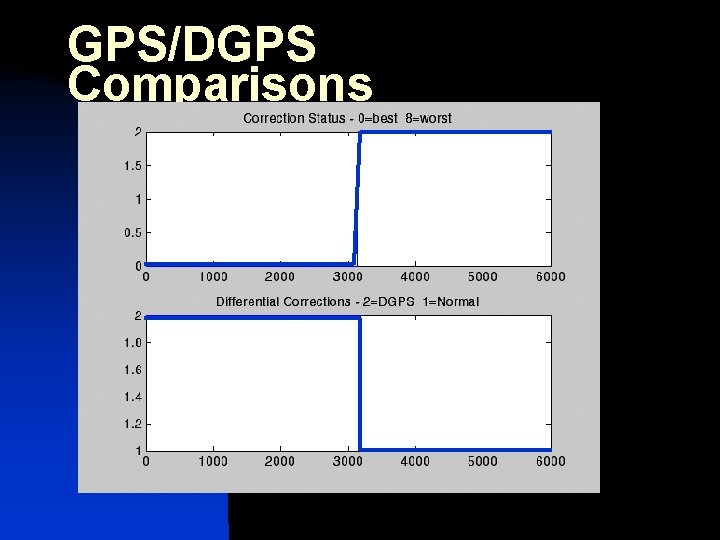
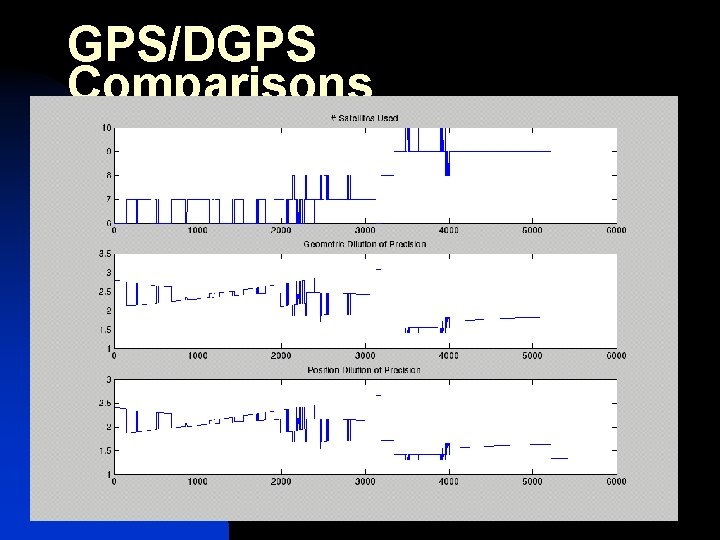
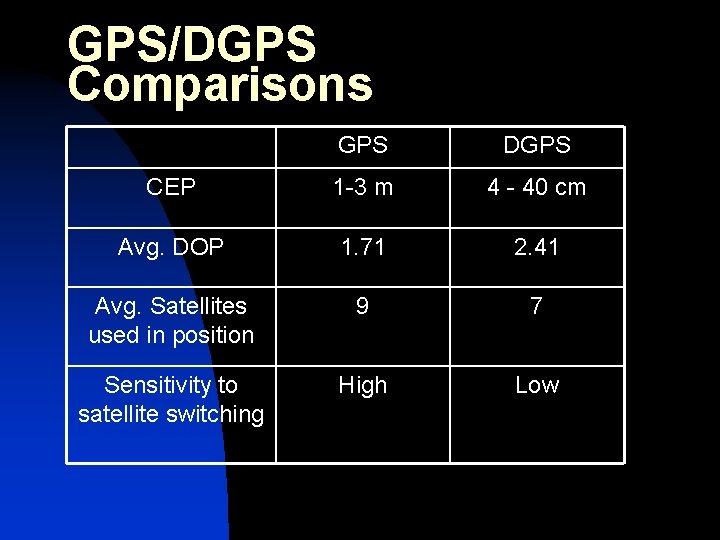
GPS/DGPS Comparisons n n n Take DGPS data Turn off corrections after 50 min What are the effects?
GPS/DGPS Comparisons 50 min
GPS/DGPS Comparisons
GPS/DGPS Comparisons
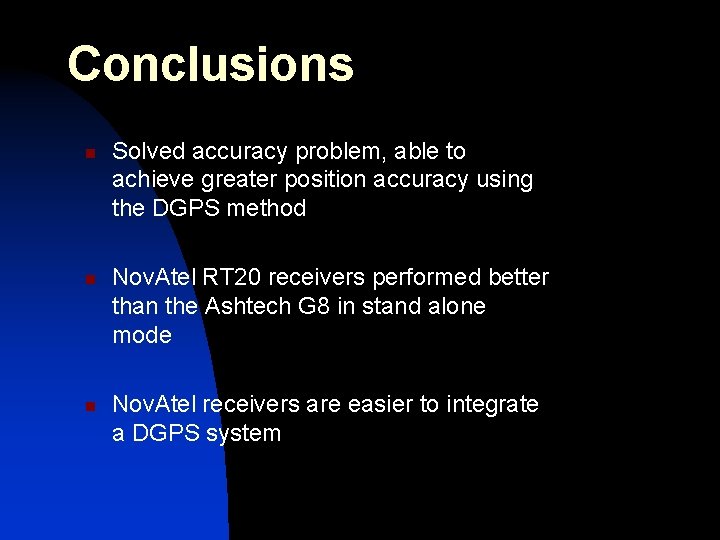
Conclusions n n n Solved accuracy problem, able to achieve greater position accuracy using the DGPS method Nov. Atel RT 20 receivers performed better than the Ashtech G 8 in stand alone mode Nov. Atel receivers are easier to integrate a DGPS system
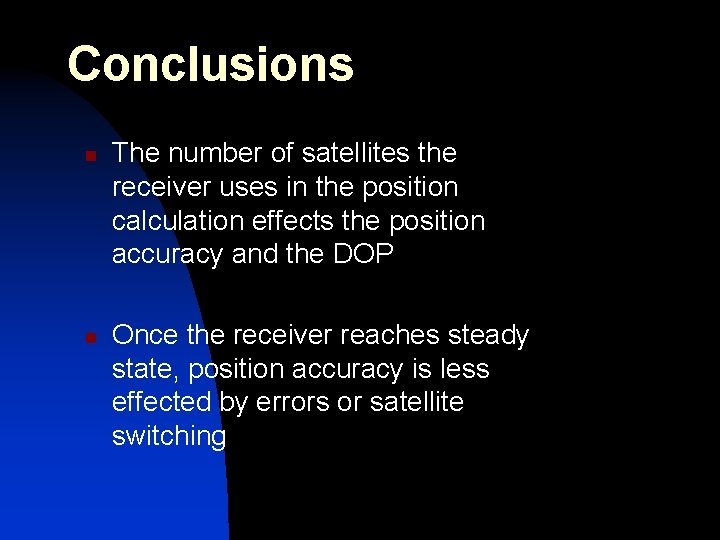
Conclusions n n The number of satellites the receiver uses in the position calculation effects the position accuracy and the DOP Once the receiver reaches steady state, position accuracy is less effected by errors or satellite switching
GPS/DGPS Comparisons GPS DGPS CEP 1 -3 m 4 - 40 cm Avg. DOP 1. 71 2. 41 Avg. Satellites used in position 9 7 Sensitivity to satellite switching High Low
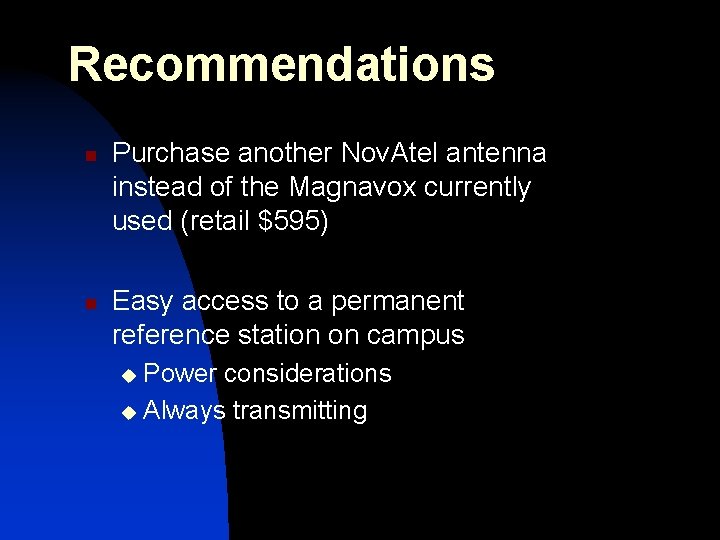
Recommendations n n Purchase another Nov. Atel antenna instead of the Magnavox currently used (retail $595) Easy access to a permanent reference station on campus Power considerations u Always transmitting u
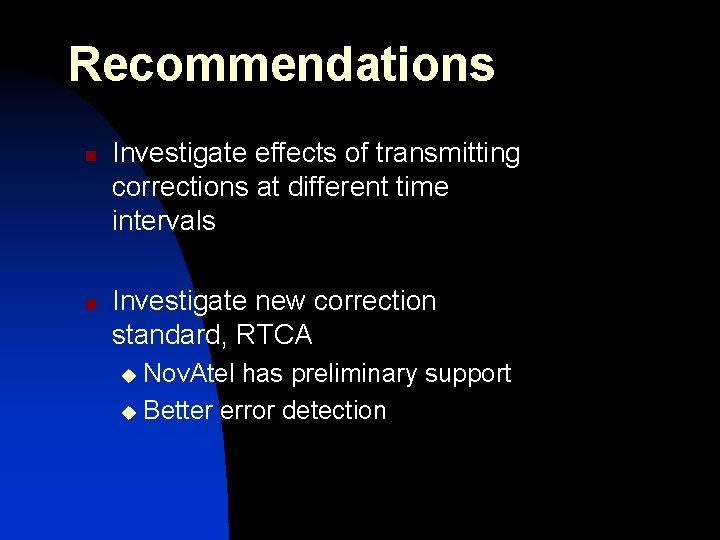
Recommendations n n Investigate effects of transmitting corrections at different time intervals Investigate new correction standard, RTCA Nov. Atel has preliminary support u Better error detection u
Special Thanks n Dr. In Soo Ahn n Bill Allen of Caterpillar n Dr. James Sennott of TISI
Questions