Impact of p CODR on Cancer Drug Funding
- Slides: 19
Impact of p. CODR on Cancer Drug Funding Decisions CADTH Symposium 2016 April 11, 2016 Amirrtha Srikanthan, Helen Mai, Nianda Penner, Eitan Amir, Andreas Laupacis, Mona Sabharwal, Kelvin K. W. Chan
Presenter Disclosures • Fellowship financial support via an educational grant from the Ontario Drug Policy Research Network
The national landscape prior to p. CODR • Differences in structures and processes for drug review and funding of cancer drugs • Variation in use/acceptability of pharmaco-economic information, submission requirements, who could submit • Variation in coverage across jurisdictions • Can it be better?
What was done? • 2007 – i. JODR formed – An interim process – Not a formal structure – Provinces (other than ON) were observers not active participants – No obligation to follow recommendations or timing of work – An evaluative process • 2011 – p. CODR formed – National, formalized transparent process – Resources for rigorous evidence-based review – Reduce duplication of review of same drug
So what? • Has p. CODR made a difference? • Our aims: 1. Describe changes in concordance of decisions across participating provinces 2. Describe changes in time from Health Canada Notice of Compliance (NOC) to drug funding across provinces • Conducted a retrospective review with the support of the p. CODR provincial advisory group, provincial Ministries of Health and Cancer Agencies and Health Canada
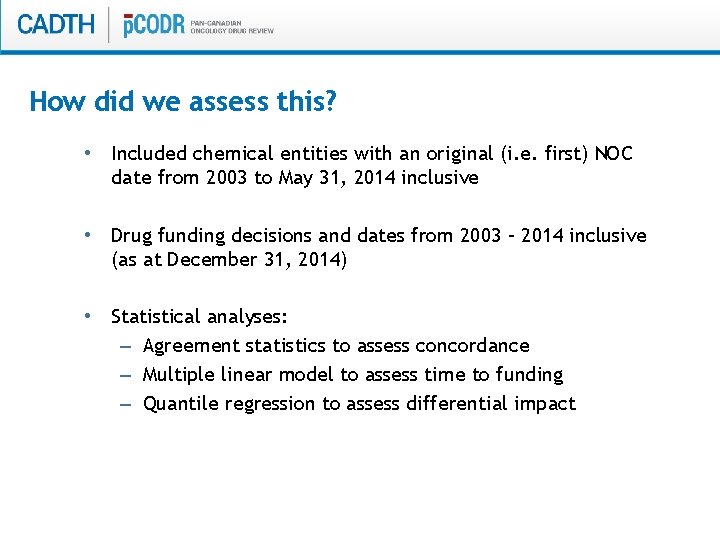
How did we assess this? • Included chemical entities with an original (i. e. first) NOC date from 2003 to May 31, 2014 inclusive • Drug funding decisions and dates from 2003 – 2014 inclusive (as at December 31, 2014) • Statistical analyses: – Agreement statistics to assess concordance – Multiple linear model to assess time to funding – Quantile regression to assess differential impact
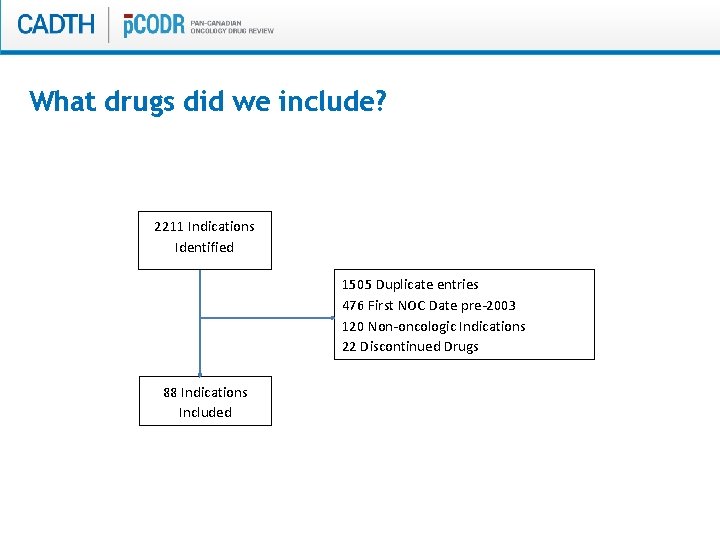
What drugs did we include? 2211 Indications Identified 1505 Duplicate entries 476 First NOC Date pre-2003 120 Non-oncologic Indications 22 Discontinued Drugs 88 Indications Included
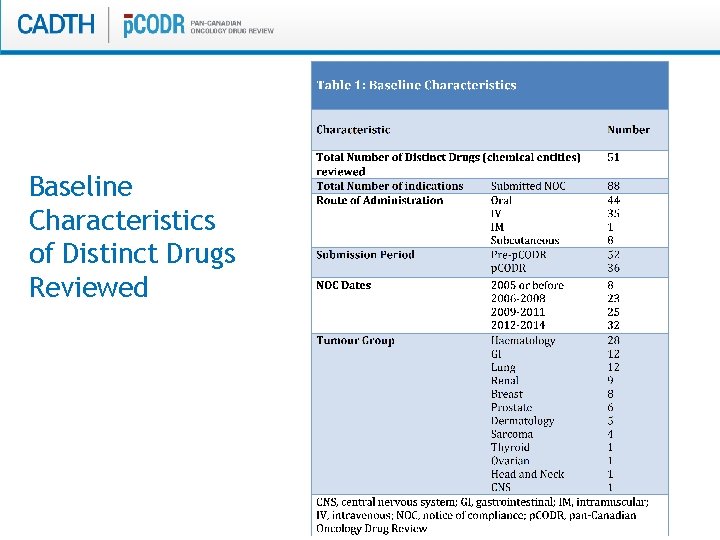
Baseline Characteristics of Distinct Drugs Reviewed
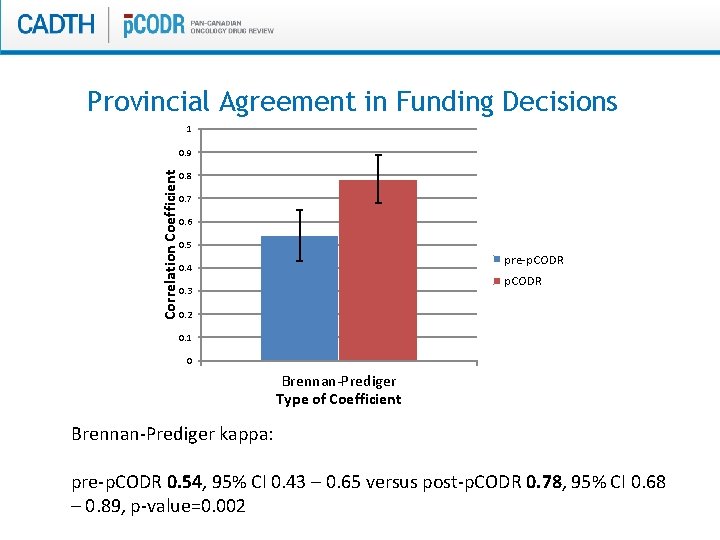
Provincial Agreement in Funding Decisions 1 Correlation Coefficient 0. 9 0. 8 0. 7 0. 6 0. 5 pre-p. CODR 0. 4 p. CODR 0. 3 0. 2 0. 1 0 Brennan-Prediger Type of Coefficient Brennan-Prediger kappa: pre-p. CODR 0. 54, 95% CI 0. 43 – 0. 65 versus post-p. CODR 0. 78, 95% CI 0. 68 – 0. 89, p-value=0. 002
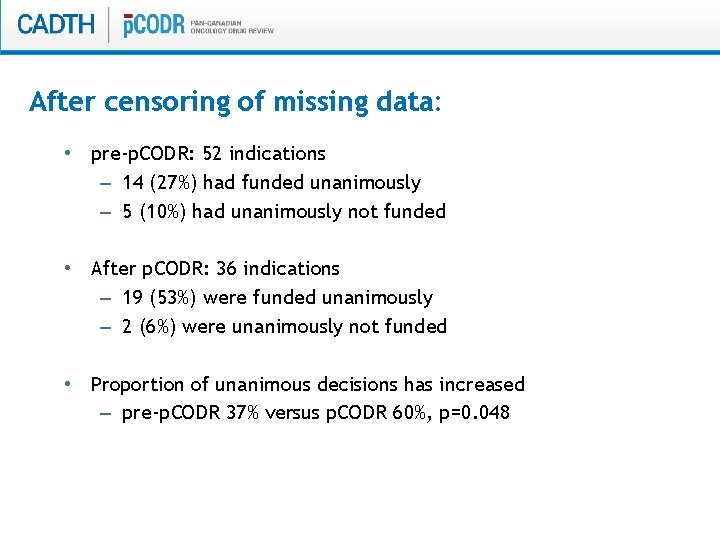
After censoring of missing data: • pre-p. CODR: 52 indications – 14 (27%) had funded unanimously – 5 (10%) had unanimously not funded • After p. CODR: 36 indications – 19 (53%) were funded unanimously – 2 (6%) were unanimously not funded • Proportion of unanimous decisions has increased – pre-p. CODR 37% versus p. CODR 60%, p=0. 048
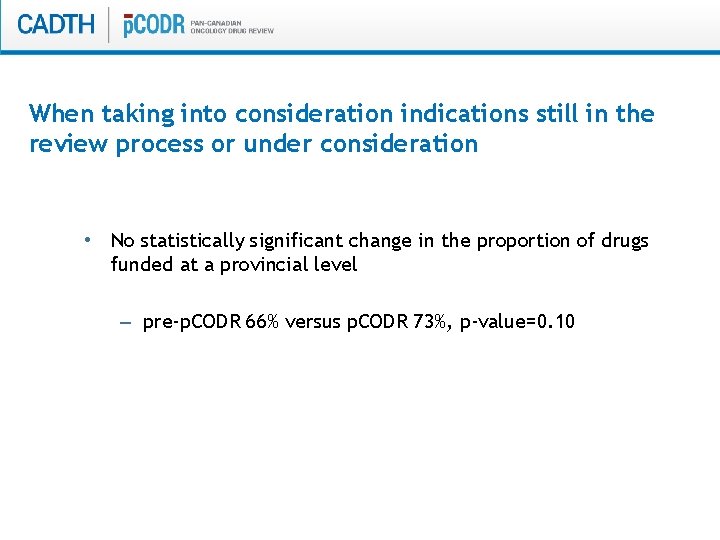
When taking into consideration indications still in the review process or under consideration • No statistically significant change in the proportion of drugs funded at a provincial level – pre-p. CODR 66% versus p. CODR 73%, p-value=0. 10
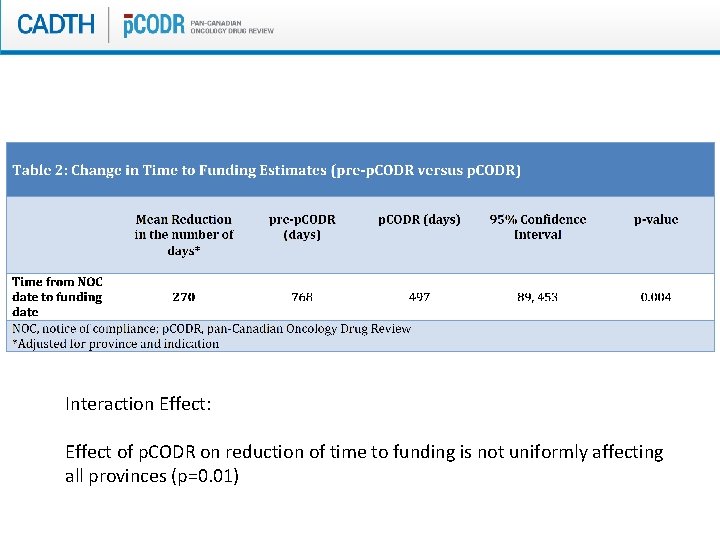
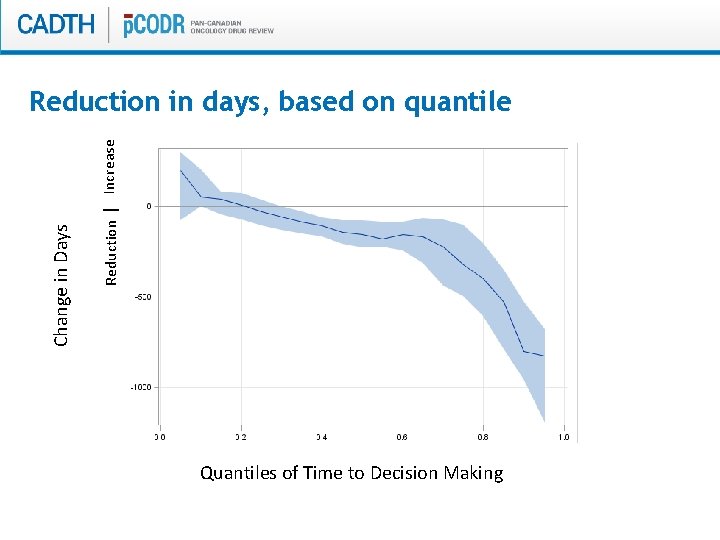
Interaction Effect: Effect of p. CODR on reduction of time to funding is not uniformly affecting all provinces (p=0. 01)
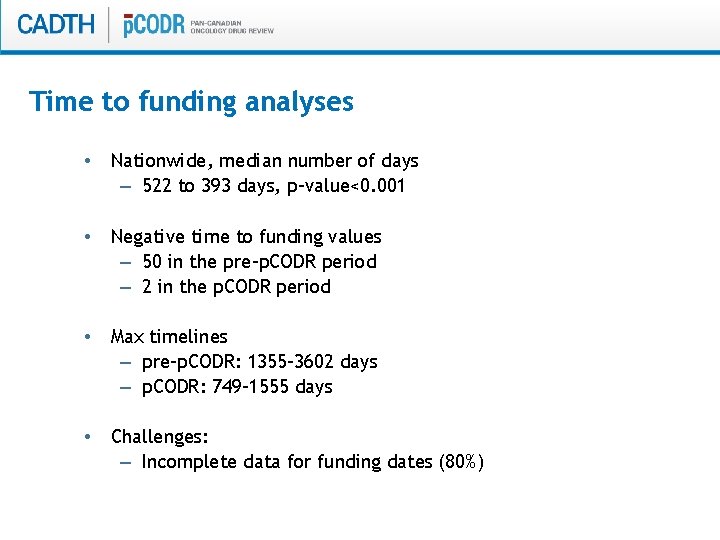
Time to funding analyses • Nationwide, median number of days – 522 to 393 days, p-value<0. 001 • Negative time to funding values – 50 in the pre-p. CODR period – 2 in the p. CODR period • Max timelines – pre-p. CODR: 1355 -3602 days – p. CODR: 749 -1555 days • Challenges: – Incomplete data for funding dates (80%)
Reduction | Increase Change in Days Reduction in days, based on quantile Quantiles of Time to Decision Making
Summary of Conclusions • Standardization of review has led to: – Increased concordance in decisions across provinces – No change in proportion funded – Decrease in time to funding timelines
Limitations • Lack of complete data sets • Lack of dates • Unknown rationale for discordance • Lack of access to drug costs
Discussion Points • Negative time intervals • Prolonged time to funding intervals (>3 years) • Ongoing inter-provincial variation • Improved availability of data • Collaboration (pan-Canadian Pharmaceutical Alliance)
Acknowledgements • • p. CODR Provincial Advisory Group Provincial Ministries of Health and Cancer Agencies Health Canada ODPRN Program • Specific Individuals – Helen Mai – Nianda Penner – Mona Sabharwal – Eitan Amir – Andreas Laupacis – Kelvin Chan
Thank you! ? ? ? Contact: Amirrtha Srikanthan, MD amirrtha. srikanthan@bccancer. bc. ca