Impact of Cloud Microphysics on the Development of


 Collision Coalescence")

 – One-moment scheme (single-moment scheme) – Predicts mass")


 Storm morphology qx (thin solid line) Θ’ = -2 K (thick solid line)")
 Precipitation and the cold pool Surface rainfall rate 2 -M 1 -M 2")

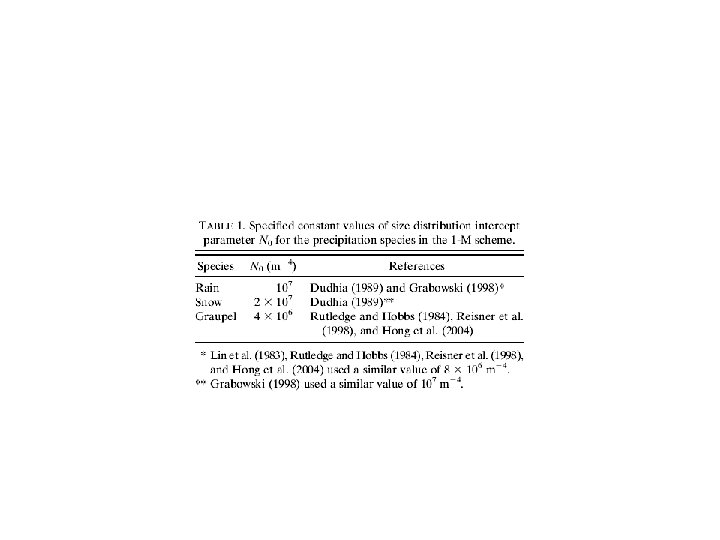
 Rain intercept parameter (N 0 r)")
 3) Mesoscale dynamics Difference in vertical velocity")

 Difference in front-to-rear flux of buoyancy SF")
 Convective updrafts Sensitivity simulation of evaporation rate Calculate rain evaporation rate by limiting")

 1 -M sensitivity test 1 -M* (")
 1 -M* (")


")
- Slides: 30
Impact of Cloud Microphysics on the Development of Trailing Stratiform Precipitation in a Simulated Squall Line: Comparison of One- and Two-Moment Schemes Reporter: Prudence Chien Reference: Morrison, H. , G. Thompson, V. Tatarskii, 2009: Impact of cloud microphysics on the development of trailing stratiform precipitation in a simulated squall line: comparison of one- and two-moment schemes. Mon. Wea. Rev. , 137, 991– 1007.
Outline • • • Keywords Motivation Experimental design Results Summary & conclusions
• Squall line Keywords • A line of active thunderstorms, either continuous or with breaks, including contiguous precipitation areas resulting from the existence of the thunderstorms. The squall line is a type of mesoscale convective system distinguished from other types by a larger length-to-width ratio. Conceptual model of a squall line
Aggregation Deposition Melting layer Evaporation (Biggerstaff & Houze 1991) Collision Coalescence
Keywords • N 0 jump N 0 r decreases rapidly during the transition from convective to widespread stratiform rain. Drop Size Distribution (DSD) N 0: intercept Λ: slope μ: shape parameter D: particle diameter (吳子瑜 2008)
Keywords • Two-moment scheme (double-moment scheme) – One-moment scheme (single-moment scheme) – Predicts mass mixing ratio(q) and number concentration(N) – 5 hydrometer species: cloud droplets, cloud ice, snow, rain, and graupel
Motivation • In general, models cannot catch squall-line features very successfully, the transition zone and the trailing stratiform region in particular. • Limitation: – Bulk schemes assume an underlying shape for the hydrometeor size distribution, and predict one or more bulk quantities of the distribution. – Bin microphysics schemes not feasible for most application. • Compare the Impact of one- and two-moment scheme on the evolution of an idealized 2 -D squall line.
Experimental design • WRF V 2. 2 • 2 D idealized squall-line case • Horizontal domain: 600 km, Δx = 1000 m Vertical domain: 20 km, Δz = 250 m • Simulated period: 7 h, Δt =5 s • Environmental temperature and moisture profile: Weisman and Klemp (1982, 1984) • Thermal bubble: θmax= 3 K at 1. 5 km height • Specified N 0 r = 107 m-4 in 1 -M
Results • • Storm Morphology Precipitation and Cold Pool Mesoscale Dynamics Convective Updrafts
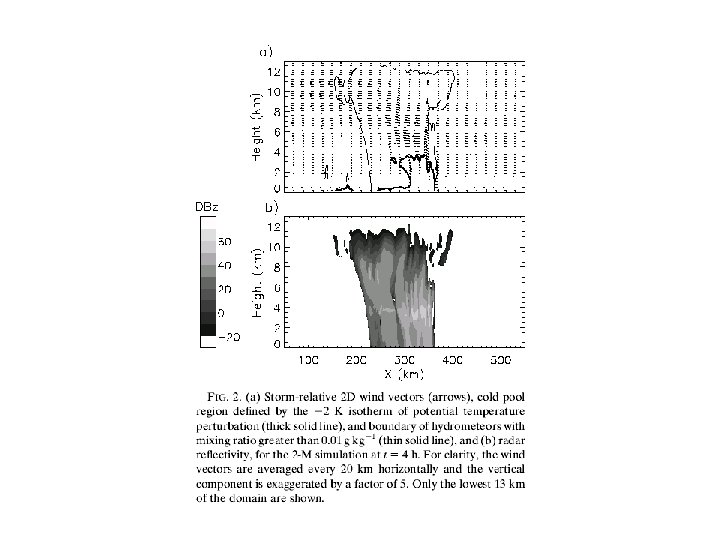
1) Storm morphology qx (thin solid line) Θ’ = -2 K (thick solid line) Wind vector (arrows) 1 -M 2 -M SF CV • Much narrower and weaker region of trailing stratiform precipitation in 1 -M • Radar reflectivities in 1 -M are lower than 2 -M in the stratiform region • Large rain evaporation rate between the melting layer and the surface in the stratiform region in 1 -M
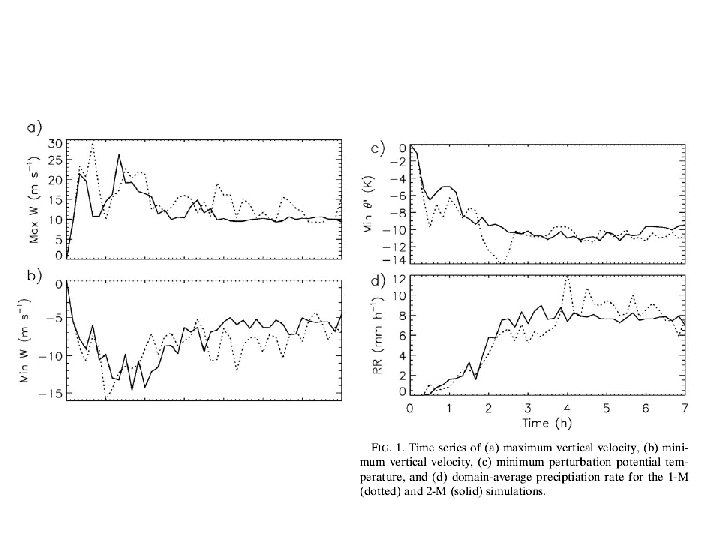
2) Precipitation and the cold pool Surface rainfall rate 2 -M 1 -M 2 -M : Larger rain rate in stratiform region Slightly smaller rain rate in convective region
Rain mixing ratio Rain evaporation rate SF CV Larger rain evaporation rate in 1 -M leads to smaller rain mixing ratio than 2 -M below the melting layer.
2 -M warmer than 1 -M (shaded gray) Rain intercept parameter (N 0 r) SF CV Difference in perturbation potential temperature SF CV • Larger value of N 0 r leads to larger evaporation rate. • Largest values of N 0 r occur in the convective region, and steadily decrease through the trailing stratiform region. • The increased evaporation rate in the stratiform region leads to a broader and generally colder cold pool in 1 -M than 2 -M.
2 -M > 1 -M (shaded gray) 3) Mesoscale dynamics Difference in vertical velocity SF CV Difference in buoyancy SF CV The mesoscale updraft at midlevels of the stratiform region is stronger in 2 -M than 1 -M. Main factor: (1)Latent heating rate (2)Rearward horizontal fluxes of condensate and buoyancy
Difference in latent heating rate SF CV Latent heating rate due to vapor deposition growth of ice is greater in 2 -M than 1 -M in the stratiform region.
2 -M > 1 -M (shaded gray) Difference in front-to-rear flux of buoyancy SF CV Difference in front-to-rear flux of condensate SF CV • Much larger flux of buoyancy at midlevels from the convective to the stratiform region in 2 -M than in 1 -M. • Much smaller amounts of ice condensate in the convective region in 2 -M than 1 -M. => Rearward flux of condensate from the convective region tends to be much smaller in 2 -M than in 1 -M.
4) Convective updrafts Sensitivity simulation of evaporation rate Calculate rain evaporation rate by limiting N 0 r’s maximum=107 m-4 in convective region (2 -M*) Difference in vertical velocity SF CV 2 -M > 2 -M* (gray shaded) Rain evaporation are reduced in convective region, leading to reduced latent cooling and increased mean convective updraft intensity.
Sensitivity simulation of evaporation rate Difference in front-to-rear flux of buoyancy SF CV Difference in front-to-rear flux of condensate 2 -M > 2 -M* (gray shaded) • Reduced rearward flux of positively buoyant air to stratiform region • Increased rearward flux of condensate
1 -M ( N 0 r=107 m-4) 1 -M sensitivity test 1 -M* ( N 0 r=2*106 m-4) SF CV 2 -M • Reduced rain evaporation rate • Produce much more trailing stratiform precipitation • The leading edge of convective precipitation is poorly defind. • Cold pool is much weaker than in 2 -M • Smaller rearward buoyancy and condensate flux at midlevels into the stratiform region • Reflectivities are weak above the melting layer compared to 2 -M
1 -M sensitivity test 1 -M ( N 0 r=107 m-4) 1 -M* ( N 0 r=2*108 m-4) SF CV 2 -M • Increased rain evaporation rate • Very little surface rainfall in the stratiform region • Increased rearward flux of positively buoyancy into the stratiform region • Reflectivities are weak above the melting layer compared to 2 -M => The importance of capturing the variability of N 0 r between the straitiform and convective region. Two-moment schemes allow a more rigorous treatment of N 0 r
Summary & conclusion • 2 -M scheme produced a much more widespread and prominent region of stratiform precipitation, relative to 1 M scheme. • Key factor: reduced rain evaporation rate in the stratiform region in 2 -M – Larger mean raindrop size in 2 -M than in 1 -M in the stratiform region directly contributed to the larger radar reflectivity. • Secondary factor: increased rain evaporation rates in the convective region at midlevels – Reduction in the intensity of the convective updrafts. – An increased flux of positively buoyant air at midlevels from the convective to stratiform region. – An increased intensity of the mesoscale updraft.
• Difference in the rain evaporation rate between 1 -M and 2 -M were the result of differences in the rain size distribution parameters. – Larger N 0 r in the convective region were associated with significant collision-coalescence; in contrast, rain in the stratiform region was primarily produced by melting of snow. – The variability of N 0 r is consistent with surface disdrometer measurements. There a sharp decrease in N 0 r(N 0 jump) between convective and stratiform region.
• Rain evaporation plays a key role in the development of the trailing stratiform region. Rain evaporation rate is sensitive to the number concentration in the 2 -M scheme. • A scheme with two-moments predicted for rain only was able to reproduce the stratiform region features using the full 2 -M scheme.
Thanks for your attention. Questions?
Gamma function:
Rain evaporation rate
2 -M vertical velocity Positive vertical velocity (gray shaded)