
IMPACT Breach Formation WP 2 Review of The
IMPACT ~ Breach Formation (WP 2) Review of The Numerical Model predictions for Test Case 2
Outline • Description of the test case • Summary of the data • Numerical results comparison • Discussion
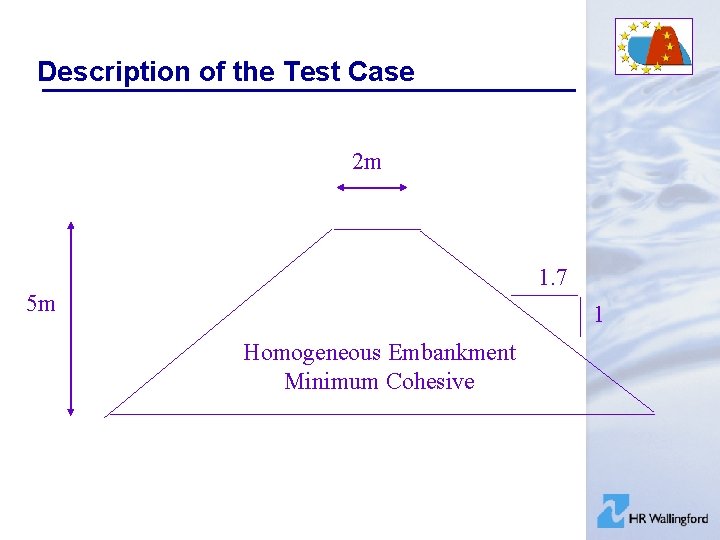
Description of the Test Case 2 m 1. 7 5 m 1 Homogeneous Embankment Minimum Cohesive
Summary of the Data General • Overtopping failure • Constant upstream water level (up to 450 m 3/s) • Free flow downstream (No DS control) • Stage-Area and Volume curves • XYZ Data for 2 D models • Geometry • Initial breach dimensions • Material properties
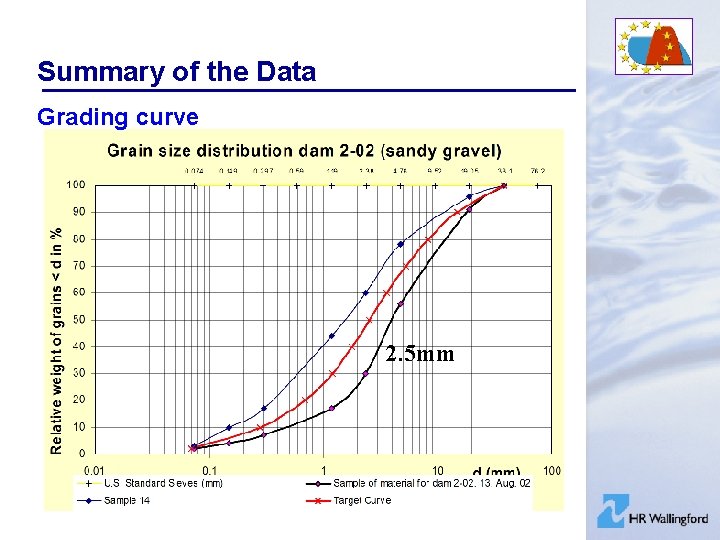
Summary of the Data Grading curve 2. 5 mm
Numerical Results Comparison • Breach outflow • Reservoir levels • Breach invert level • Breach width
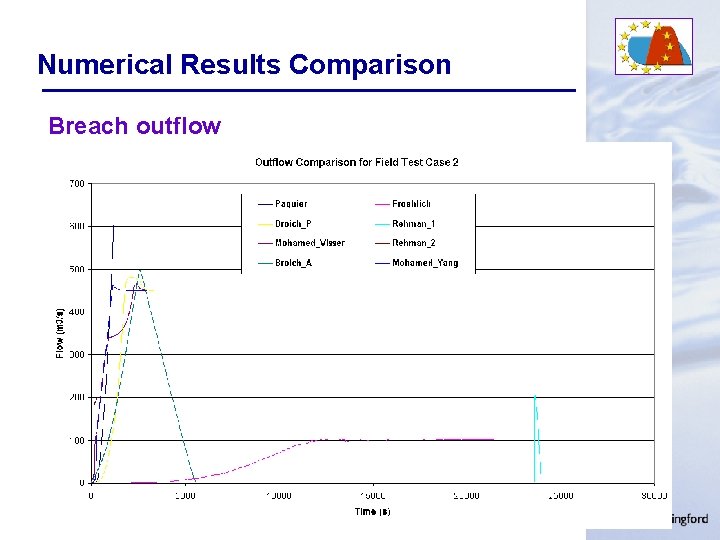
Numerical Results Comparison Breach outflow
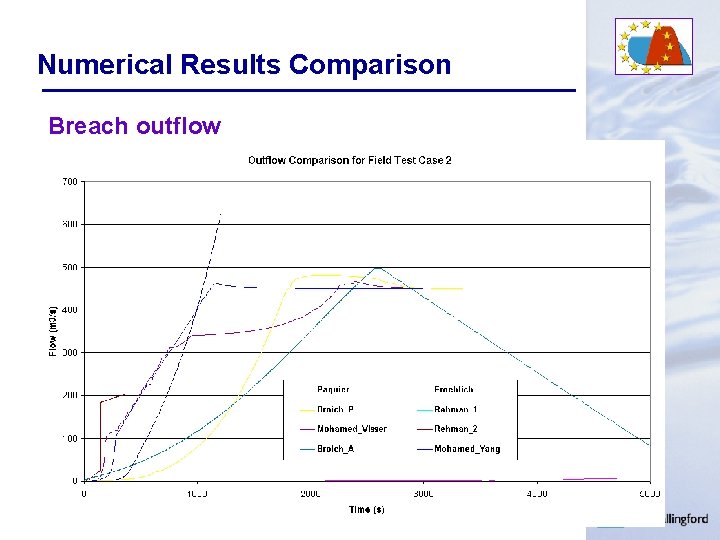
Numerical Results Comparison Breach outflow
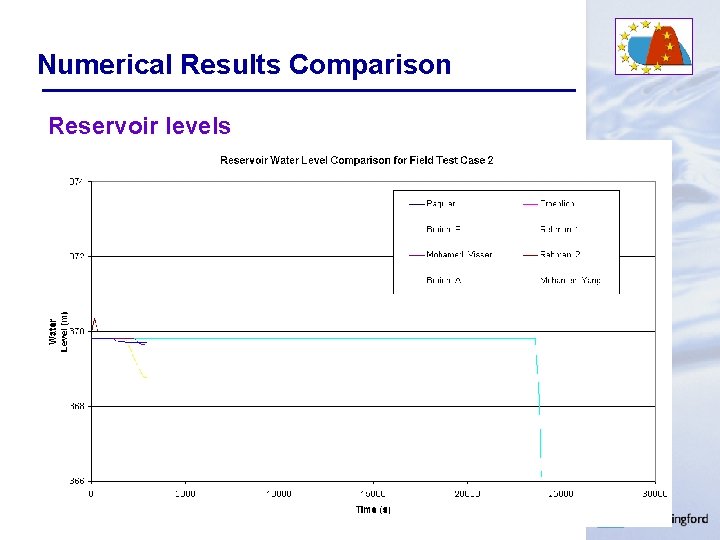
Numerical Results Comparison Reservoir levels
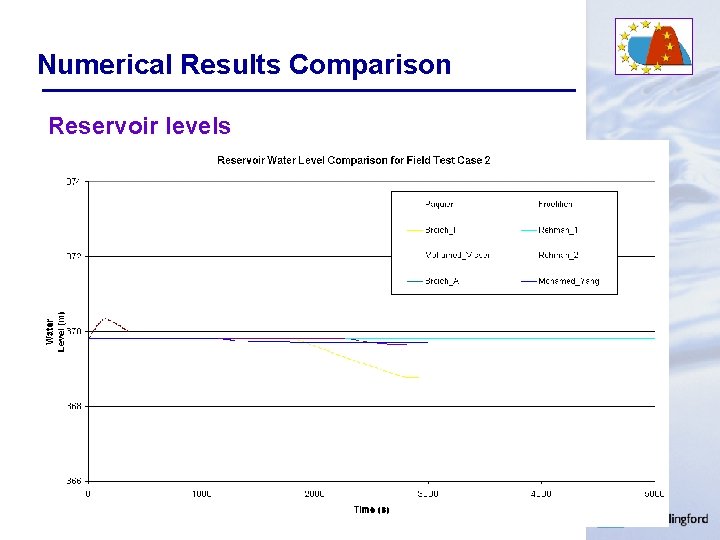
Numerical Results Comparison Reservoir levels
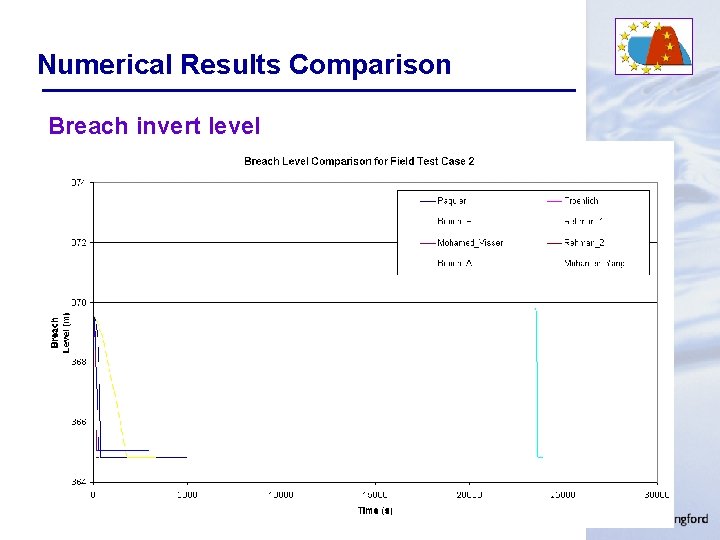
Numerical Results Comparison Breach invert level
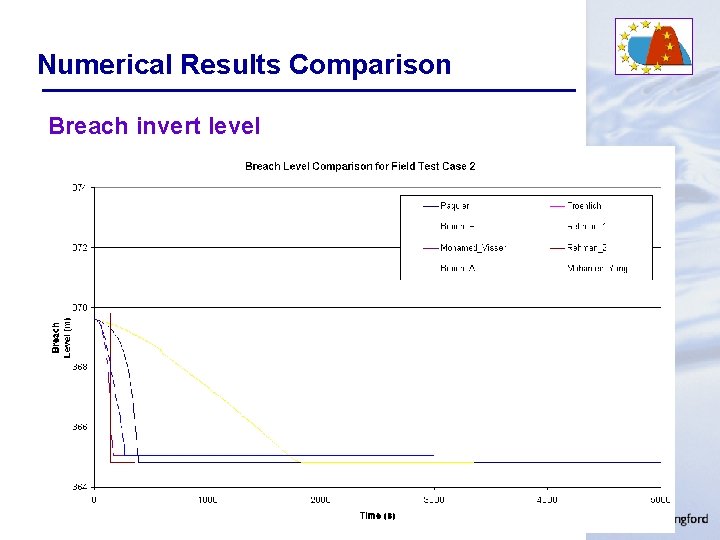
Numerical Results Comparison Breach invert level
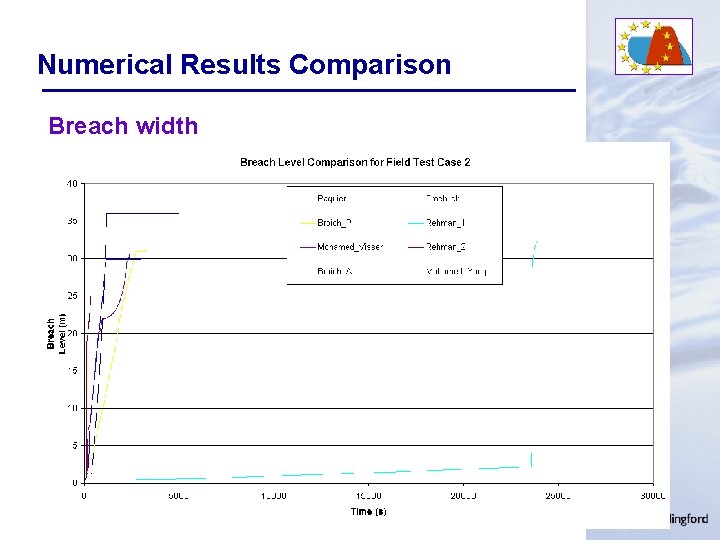
Numerical Results Comparison Breach width
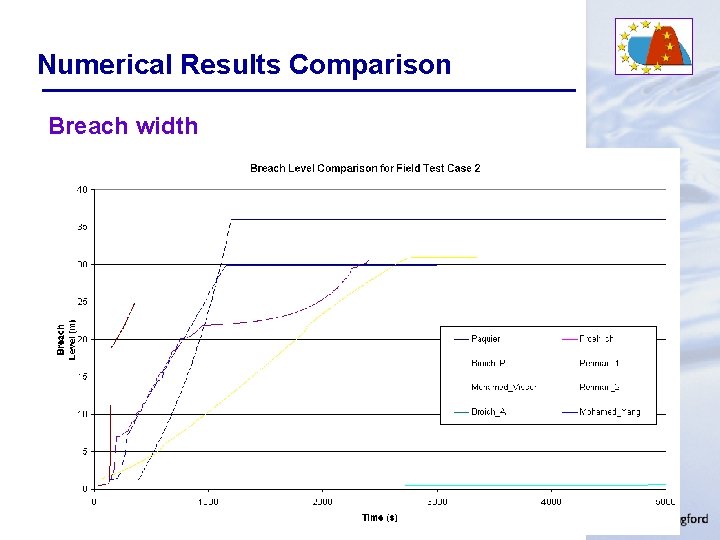
Numerical Results Comparison Breach width
Discussion • Test Data – Actual field test conditions varied significantly from theoretical conditions sent to modellers – Incomplete survey data for the reservoir affected u/s conditions • Models and Test Results – Four 1 D models and one 2 D model were utilised – Smaller variation in modelling results for most of the models compared to Field Test #1 (e. g. Peak outflow from 475 m 3/s to 620 m 3/s)
- Slides: 15